To sign up to receive the latest Canadian Energy Centre research to your inbox email: [email protected]
Download the PDF here
The following summary facts and data are drawn from 23 Fact Sheets and 11 Research Briefs released in 2021 by the Canadian Energy Centre. For sources and methodology, as well as additional data and information, the 34 original reports are available at the research portal on the Canadian Energy Centre website at canadianenergycentre.ca
Revenues to Governments
1.
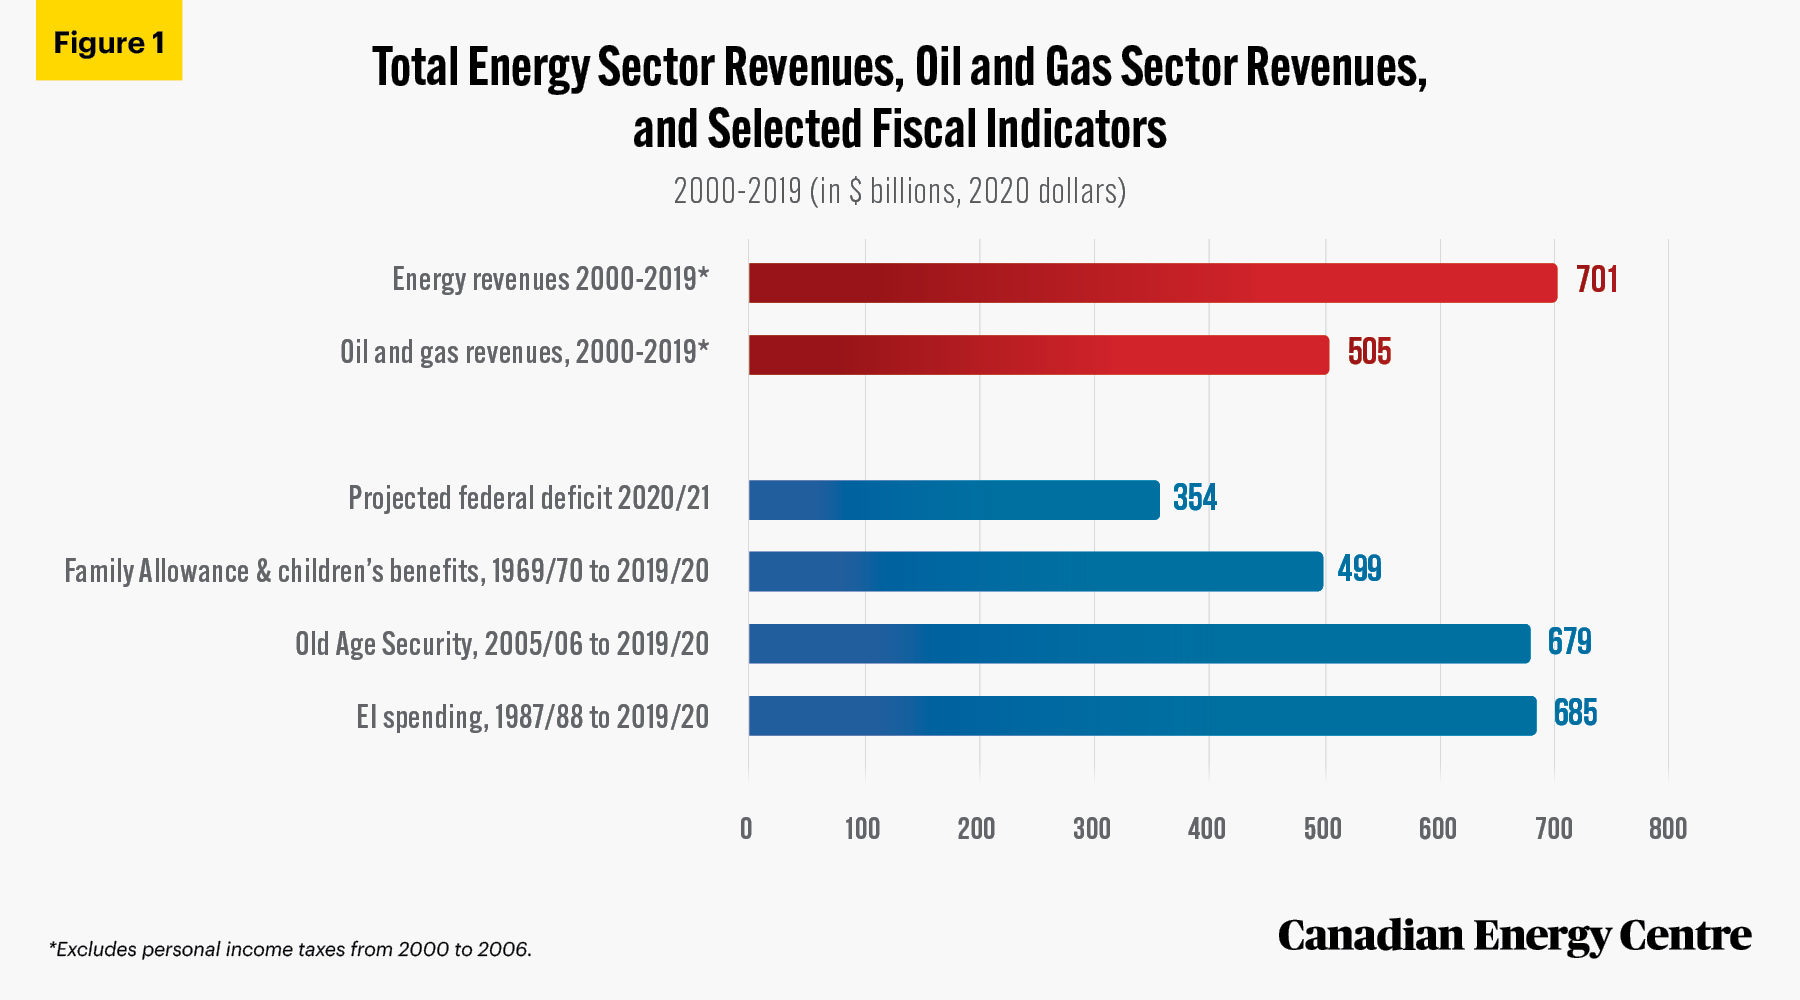
Canada’s energy industry paid over $701 billion in federal, provincial and local taxes, royalties, and fees since 2000. That is:
- Nearly twice the latest forecast of the federal budget deficit of $354 billion for 2020/21;
- More than the $679 billion paid out in Old Age Security (OAS) benefits between 2005/06 and 2019/20; and
- More than the $685 billion in Employment Insurance (EI) benefits paid out between 1987/88 and 2019/20.
Sources: Statistics Canada and CAPP.
2.
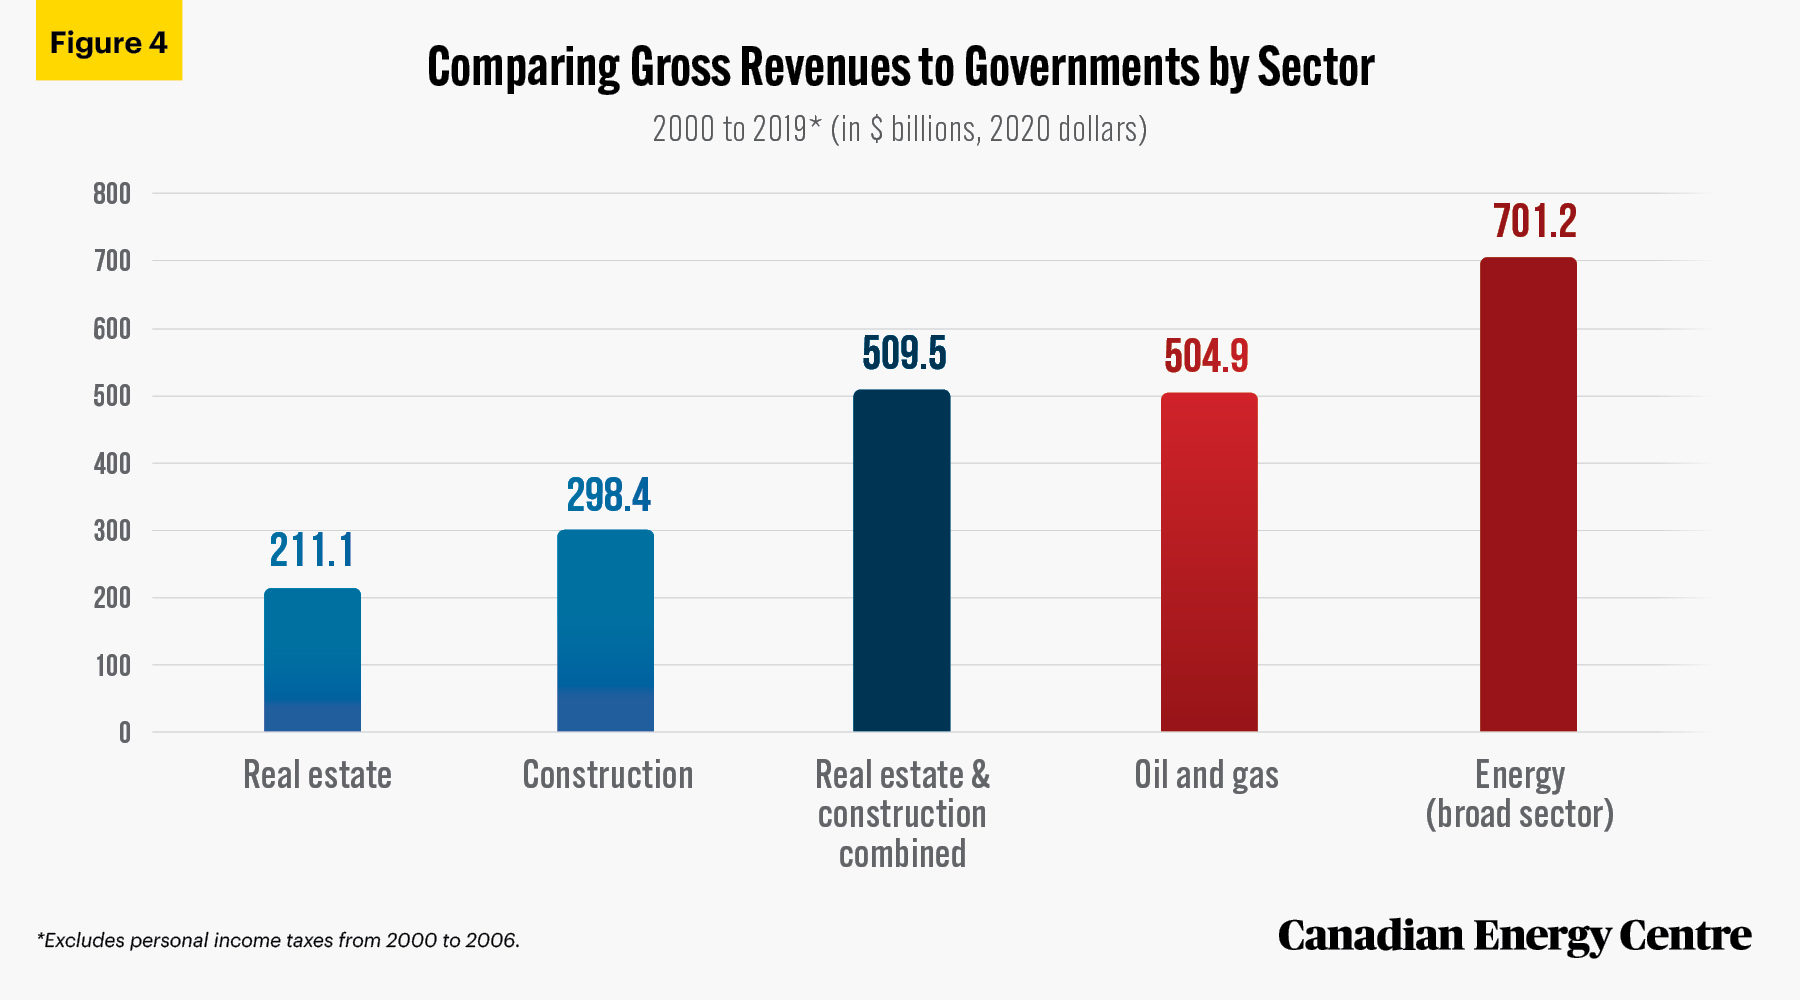
Since 2000, Canada’s oil and gas sector alone paid nearly $505 billion to federal, provincial, and local governments.
- This is almost the same as the real estate and construction sectors combined (at $510 billion); and
- This is more than the $499 billion in Family Allowance and children’s benefits paid out between 1969/70 and 2019/20.
Sources: Statistics Canada and CAPP.
3.
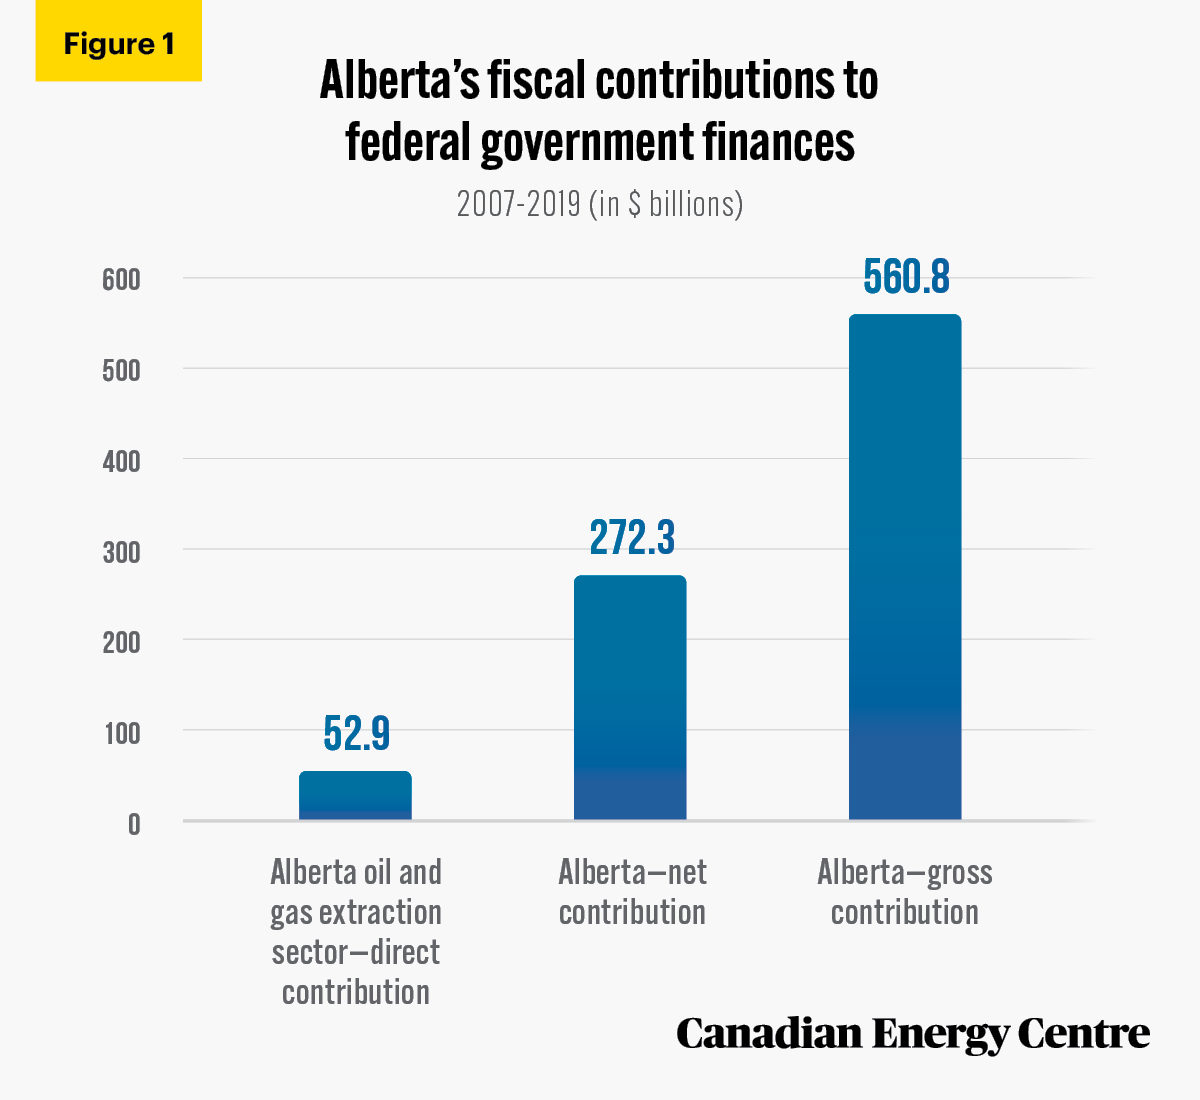
Alberta taxpayers made a $272 billion net contribution to federal government finances between 2007 and 2019.
- The direct share from Alberta’s oil and gas extraction sector was, at a minimum, nearly $53 billion, about 9 per cent of gross Alberta contributions and 19 per cent of Alberta’s total net fiscal contribution over the period.
Sources: Derived from Statistics Canada, Table 36-10-0450-01; Alberta Finance, Albertan’s Net Contribution to Con-federation for 2011; and Statistics Canada, Table 17-10-0005-01.
Contribution to National and Regional Economies
4.
The oil and gas sector makes an outsized contribution to the Canadian economy, when healthy or when enduring a slump.
- Average weekly earnings are highest in oil and gas extraction at $2,740 weekly in 2019 compared with $1,534 in aerospace, $1.427 in motor vehicle manufacturing, and $1,029 for the average of all industries.
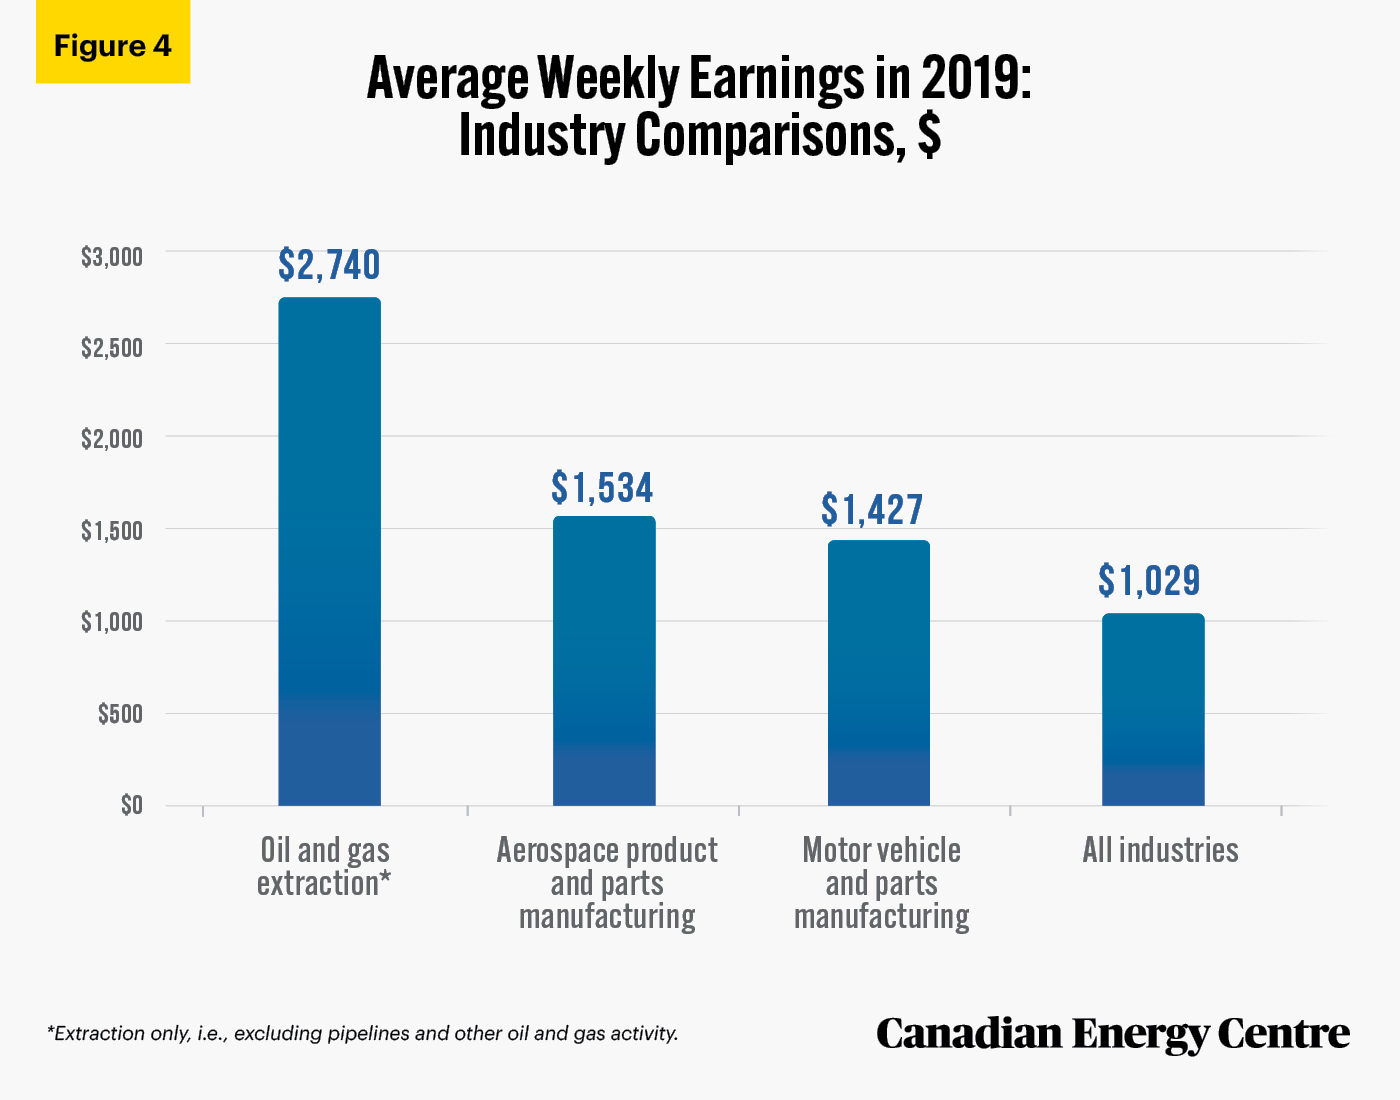
Source: Statistics Canada, Table 14-10-0204-01.
5.
In 2017, the oil and gas sector was responsible for adding $7.7 billion in nominal GDP to the Ontario economy. Oil and gas:
- Generated $15.3 billion in outputs, consisting primarily of the value of goods and services produced by sectors in the Ontario economy;
- Supported over 71,000 jobs in Ontario, directly and indirectly; and
- Paid $2.1 billion in wages and salaries to workers in Ontario.
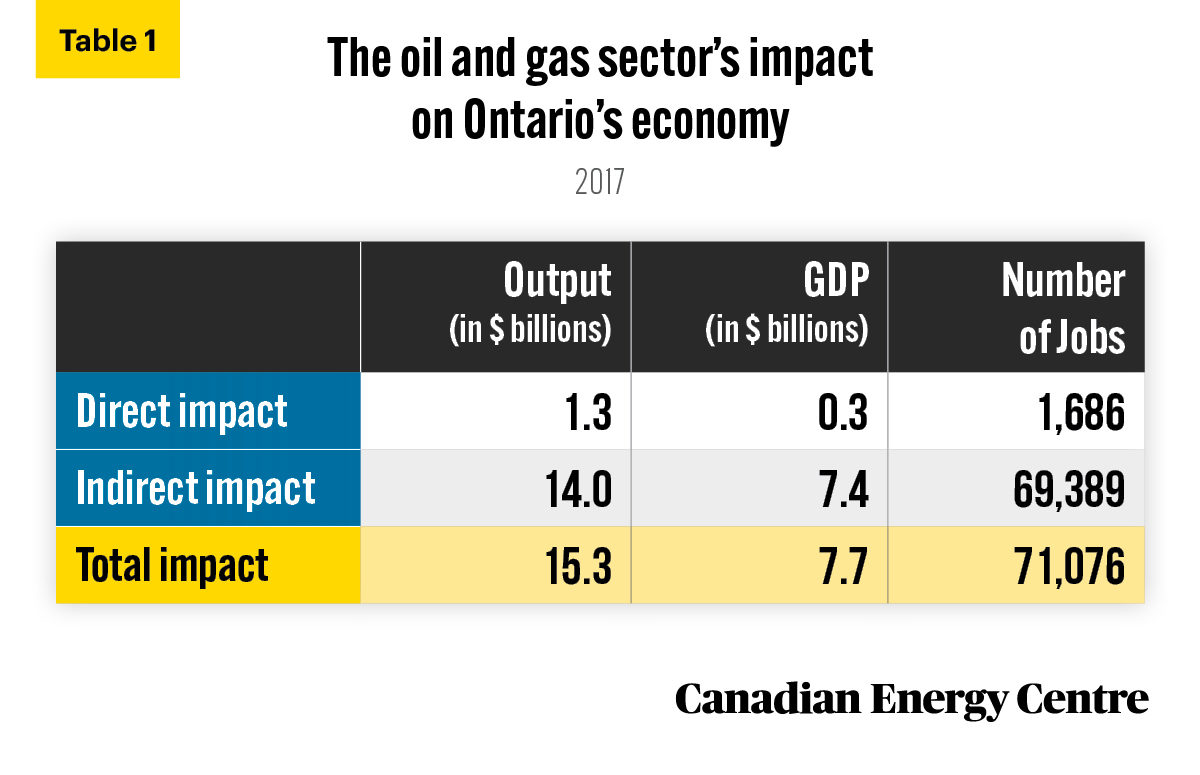
Source: Derived from Statistics Canada, Supply and Use Tables, custom tabulation.
6.
In 2017, the oil and gas sector was responsible for adding nearly $9.5 billion in nominal GDP to the B.C. economy. Oil and gas:
- Generated nearly $18.0 billion in outputs, consisting primarily of the value of goods and services produced by various sectors in the B.C. economy;
- Supported nearly 62,000 jobs in B.C., directly and indirectly; and
- Paid over $3.1 billion in wages and salaries to workers in B.C.
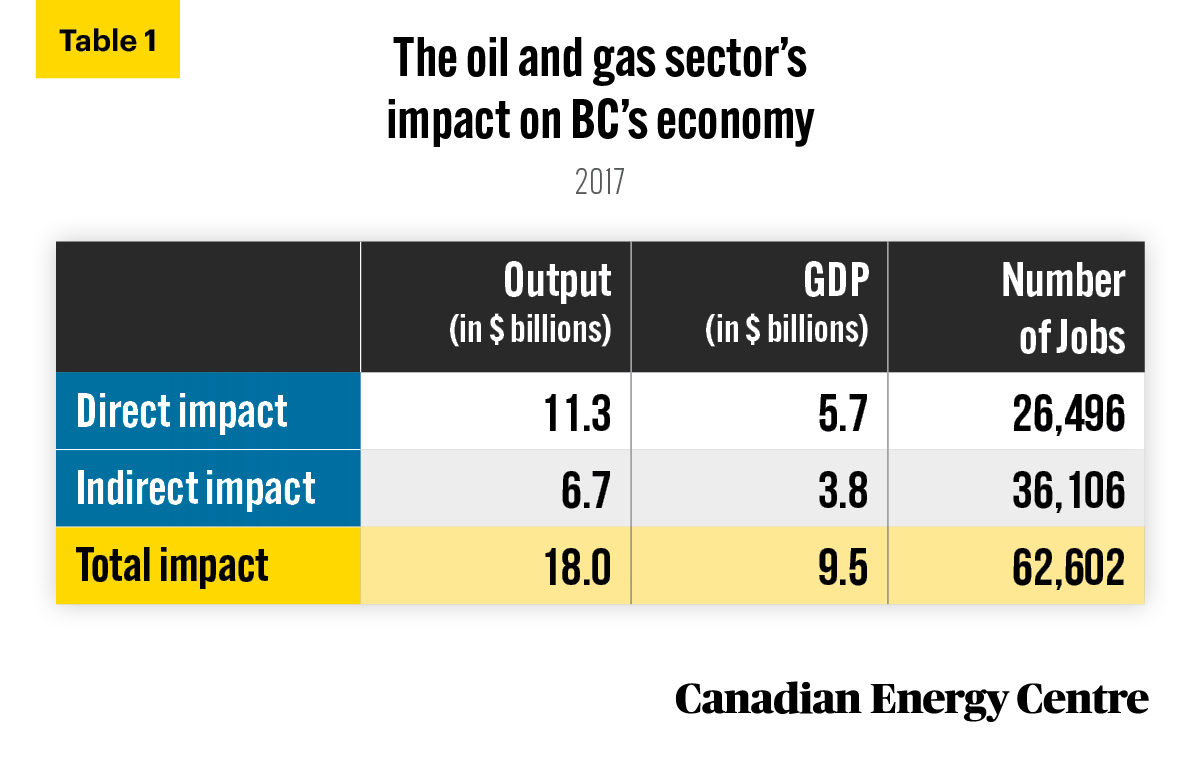
Source: Derived from Statistics Canada, Supply and Use tables, custom tabulation.
7.
In 2017, the oil and gas sector was responsible for adding nearly $6.9 billion in nominal GDP to Atlantic Canada economy. Oil and gas:
- Generated nearly $11.4 billion in outputs, consisting primarily of the value of goods and services produced by various sectors in the Atlantic economy;
- Supported over 20,000 jobs in Atlantic Canada, directly and indirectly; and
- Paid over $1.36 billion in wages and salaries to workers in Atlantic Canada.
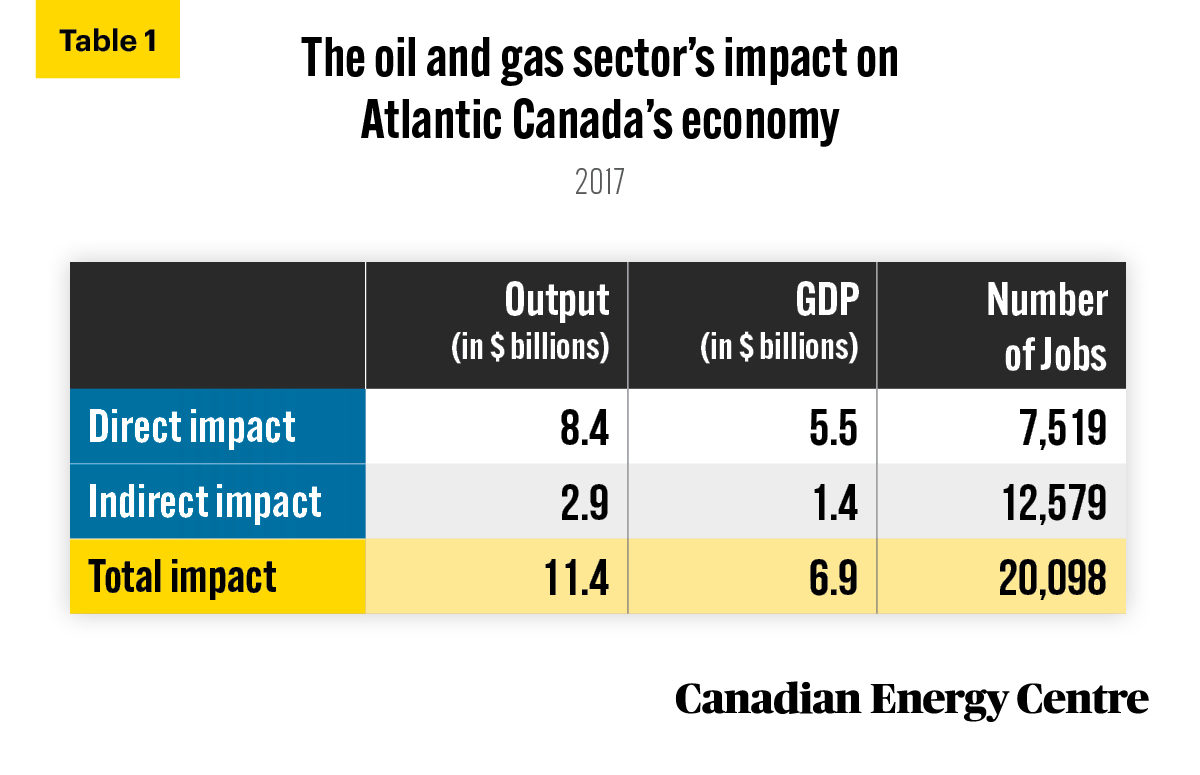
Source: Derived from Statistics Canada, Supply and Use Tables, custom tabulation. Totals may not add exactly due to rounding.
8.
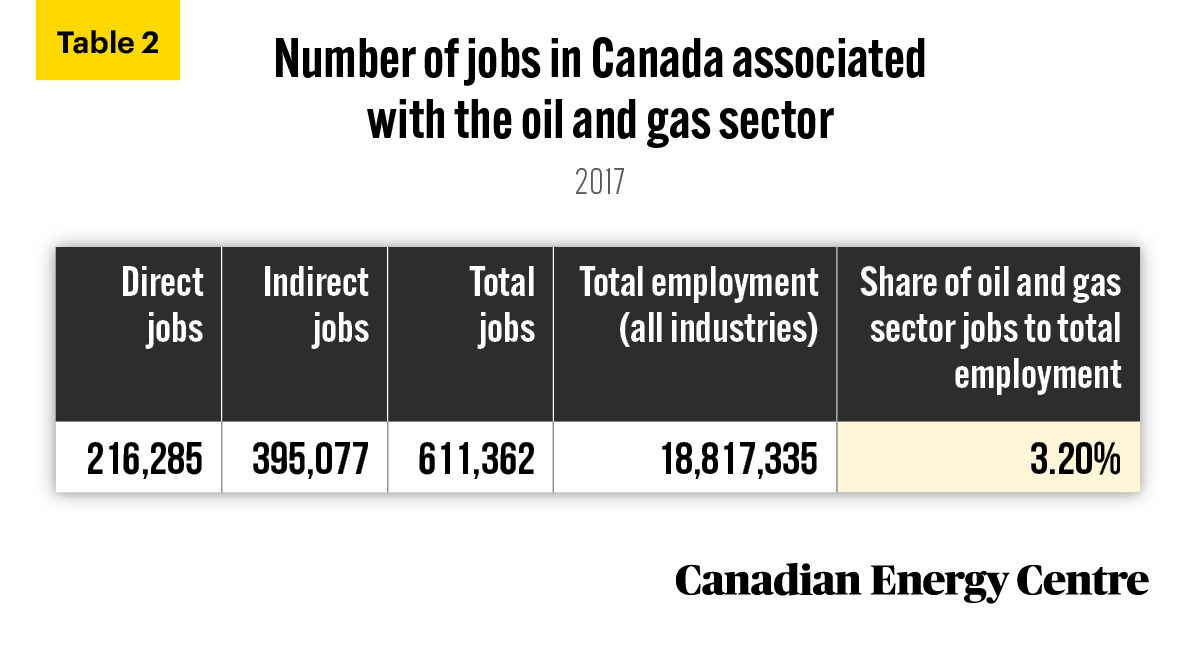
In 2017, the GDP associated with the Canadian oil and gas sector totalled $128 billion, or 6.4 per cent of the total Canadian economy. In 2017, there were 216,285 direct jobs and 395,077 indirect jobs associated with the Canadian oil and gas sector, or 611,362 in total, representing about 3.2 per cent of all jobs across Canada.
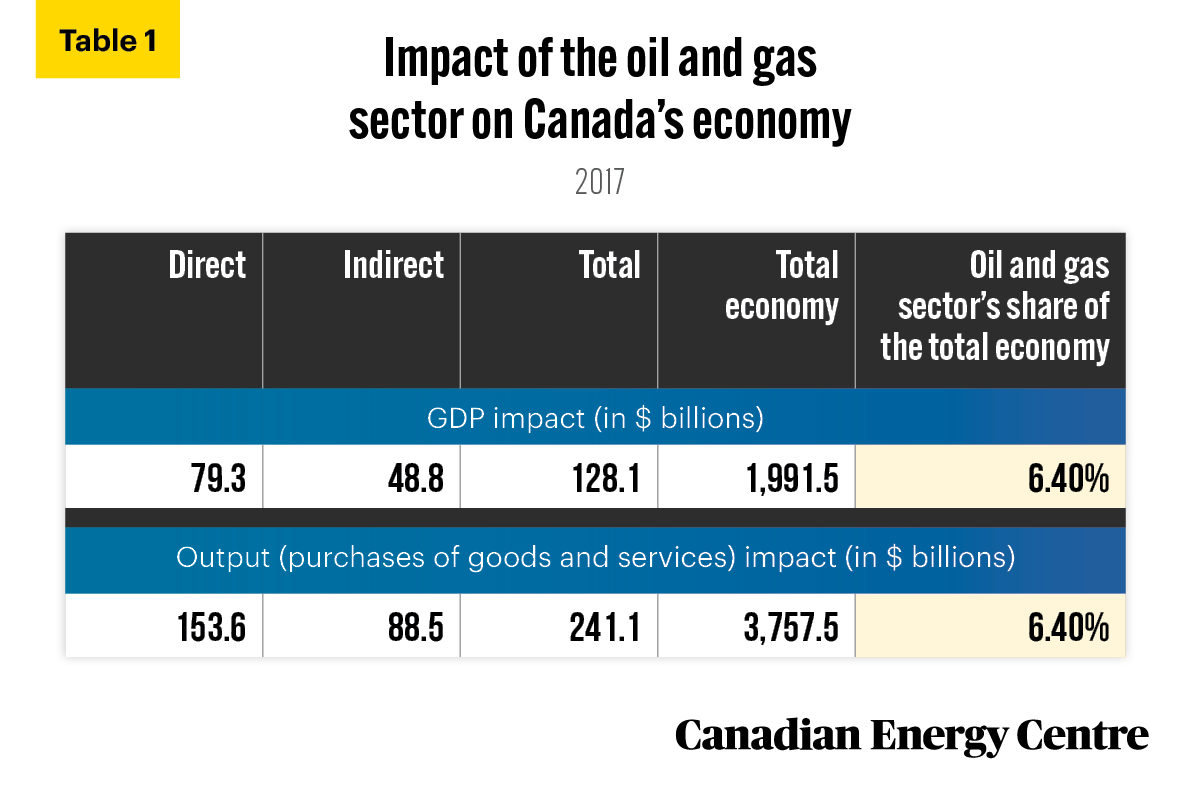
Source: Derived from Statistics Canada, Custom Tabulation of the Supply and Use Tables, 2017.
Source: Derived from Statistics Canada, Custom Tabulation of the Supply and Use Tables, 2017.
9.
In 2017, Canada’s oil and gas industry GDP was three times the size of the country’s automotive industry and nearly seven times the size of its aerospace industry.
- In 2017, oil and gas extraction was worth $46.6 billion of Canada’s nominal GDP;
- In 2017, the motor vehicle and parts manufacturing sector accounted for $16.5 billion of Canada’s nominal GDP; and
- In 2017, the aerospace product and parts manufacturing sector accounted for $5.9 billion of Canada’s nominal GDP.
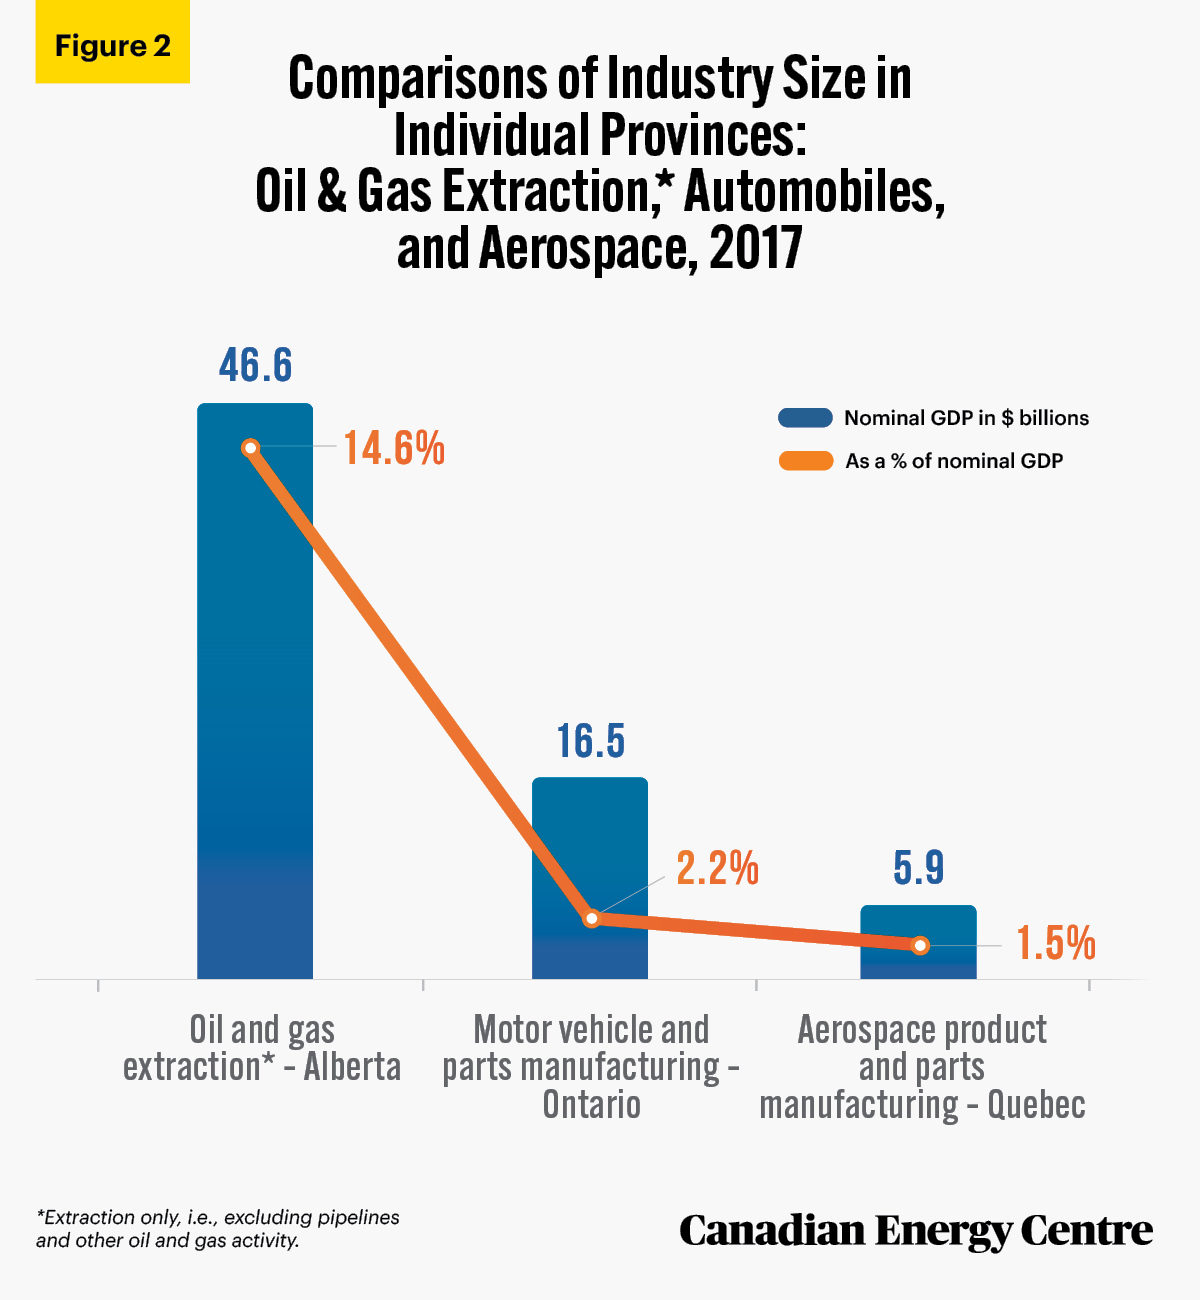
Source: Statistics Canada, Table 36-10-0401-01.
Value of Canadian Oil and Gas Exports
10.
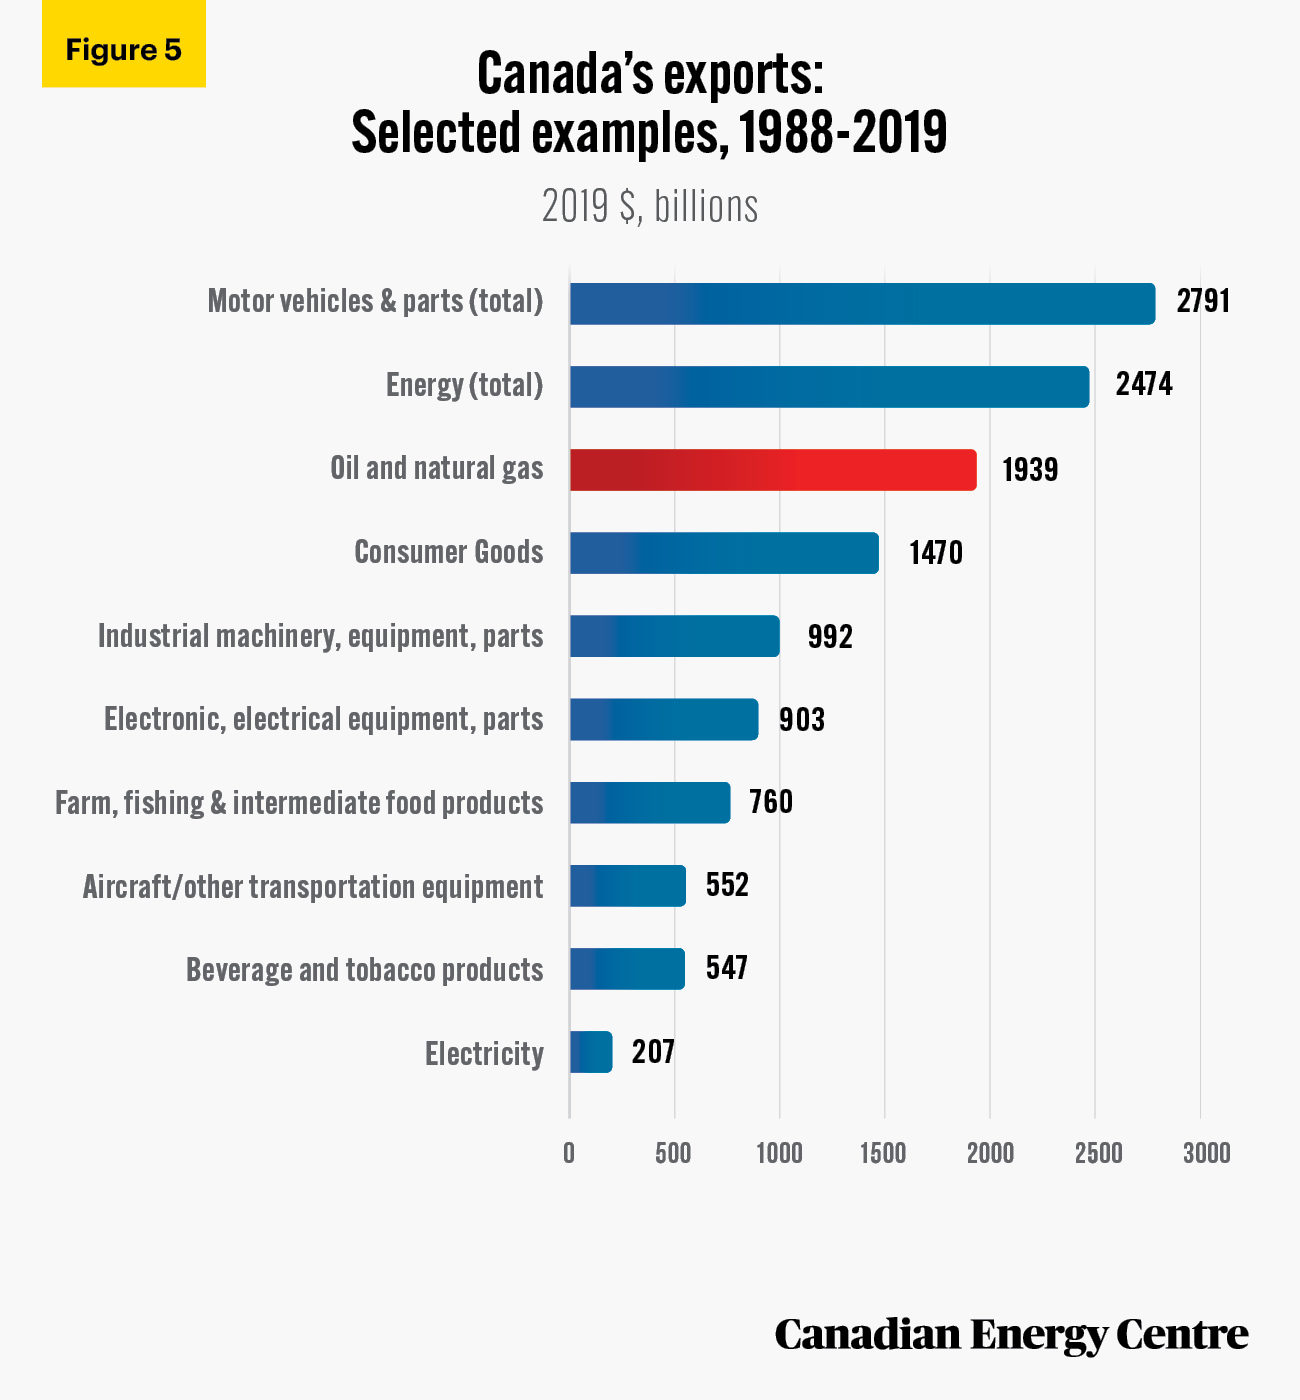
The cumulative real value of Canada’s oil and natural gas product exports was over $1.94 trillion between 1988 and 2019.
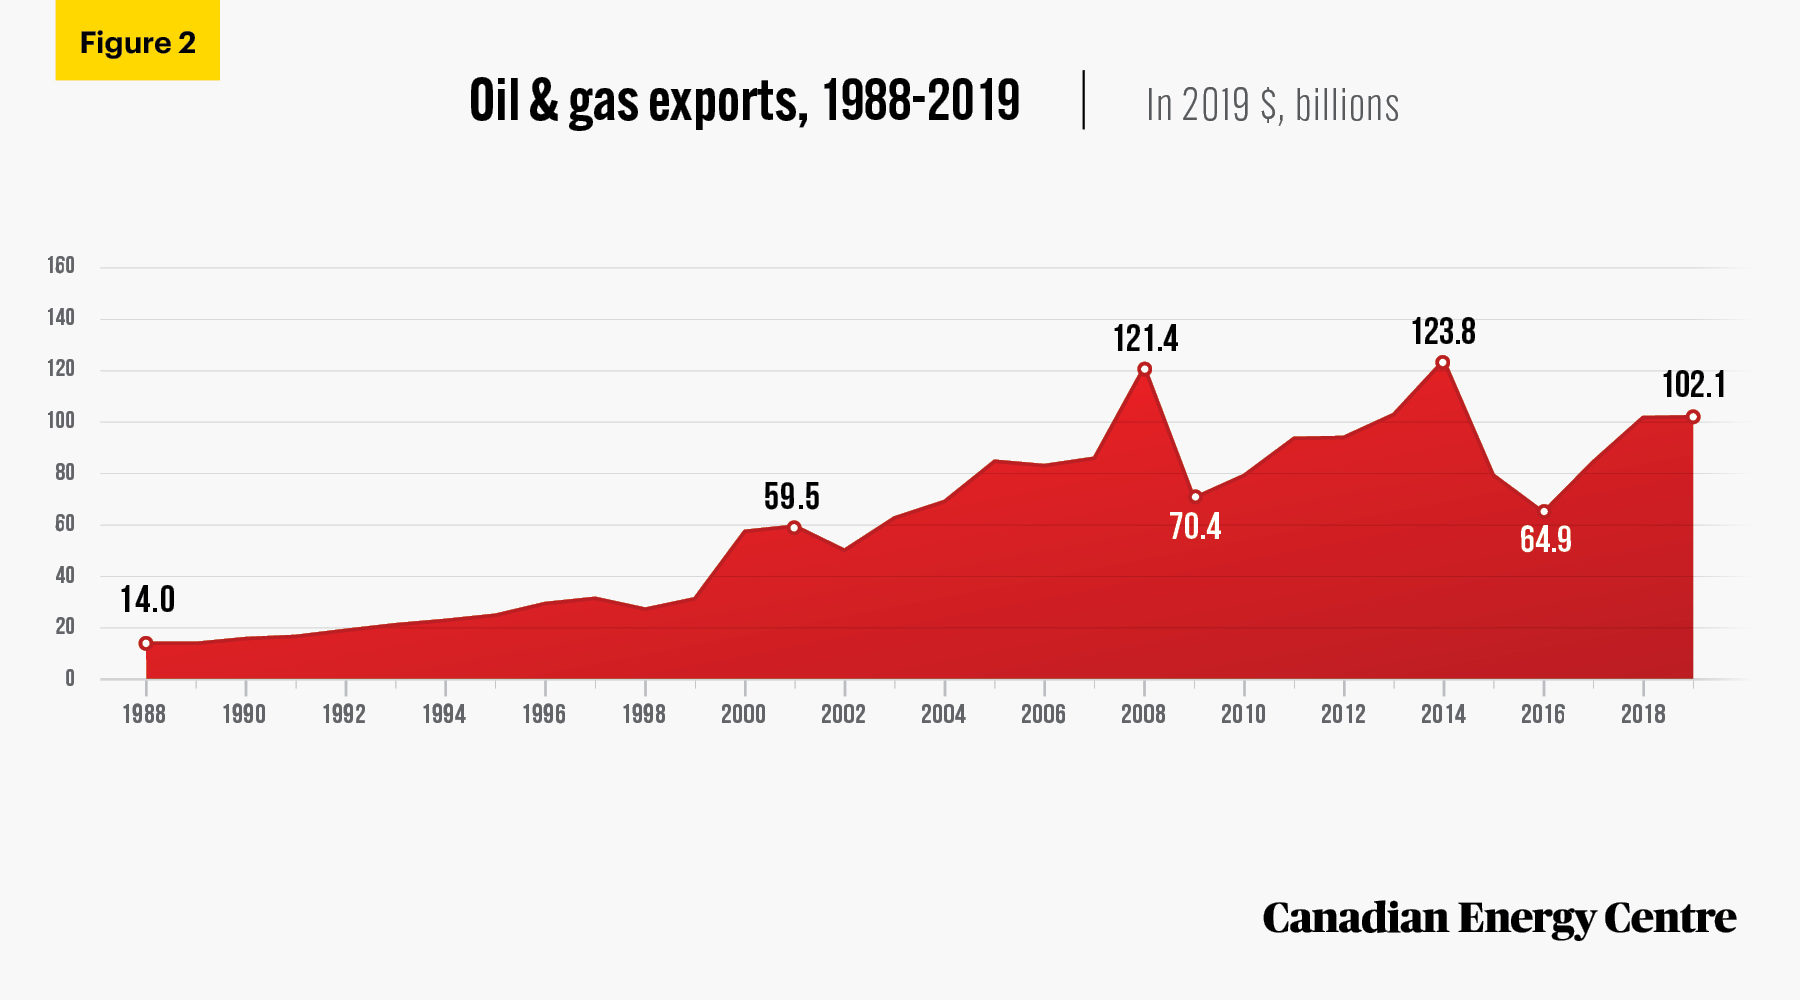
Source: Statistics Canada. Table 12-10-0121-01.
11.
The $1.94 trillion value of Canadian oil and natural gas product exports between 1988 and 2019 compares favourably to other key Canadian export products. Between 1988 and 2019, the cumulative real value of various exports included:
- electricity exports ($207 billion);
- aircraft and other transportation equipment ($552 million); and
- consumer goods exports (1.47 trillion).
Source: Statistics Canada. Table 12-10-0121-01.
Contribution of Canadian Oil to U.S. Refineries
12.
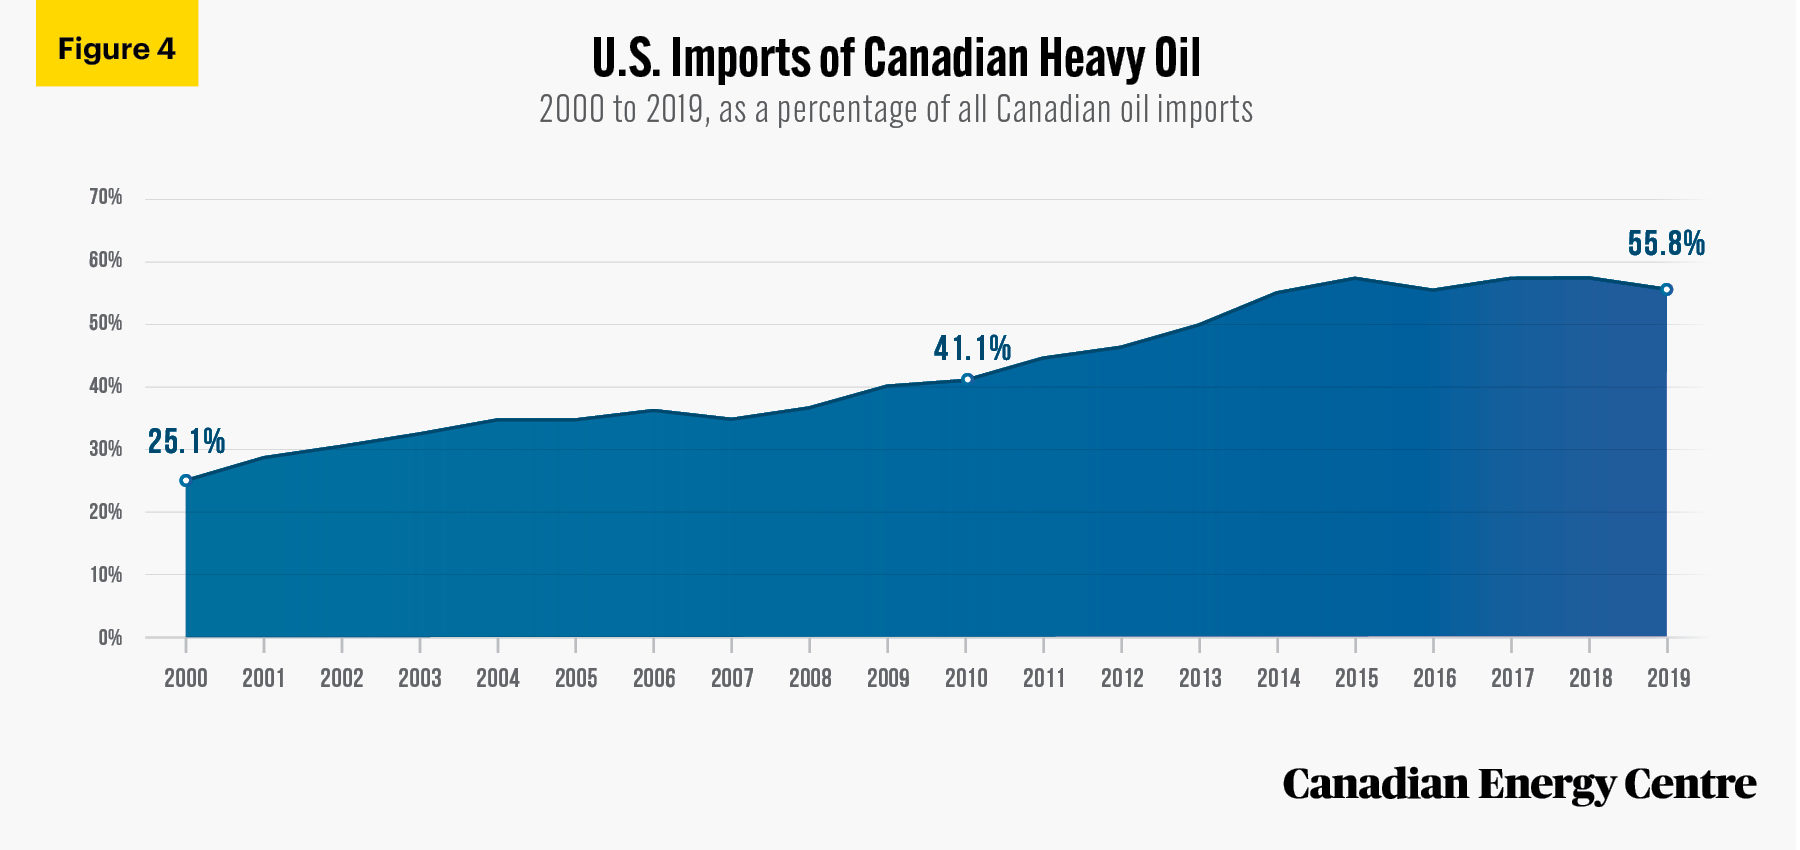
U.S. refineries are growing increasingly reliant on Canadian heavy oil, including oil from the oil sands. The total percentage of heavy crude oil that the U.S. imports from Canada as a share of all of its imports of Canadian oil has risen from 25.1 per cent in 2000 to 55.8 per cent in 2019, an increase of 122 per cent over the past two decades.
Source: US Energy Information Administration, 2021a.
13.
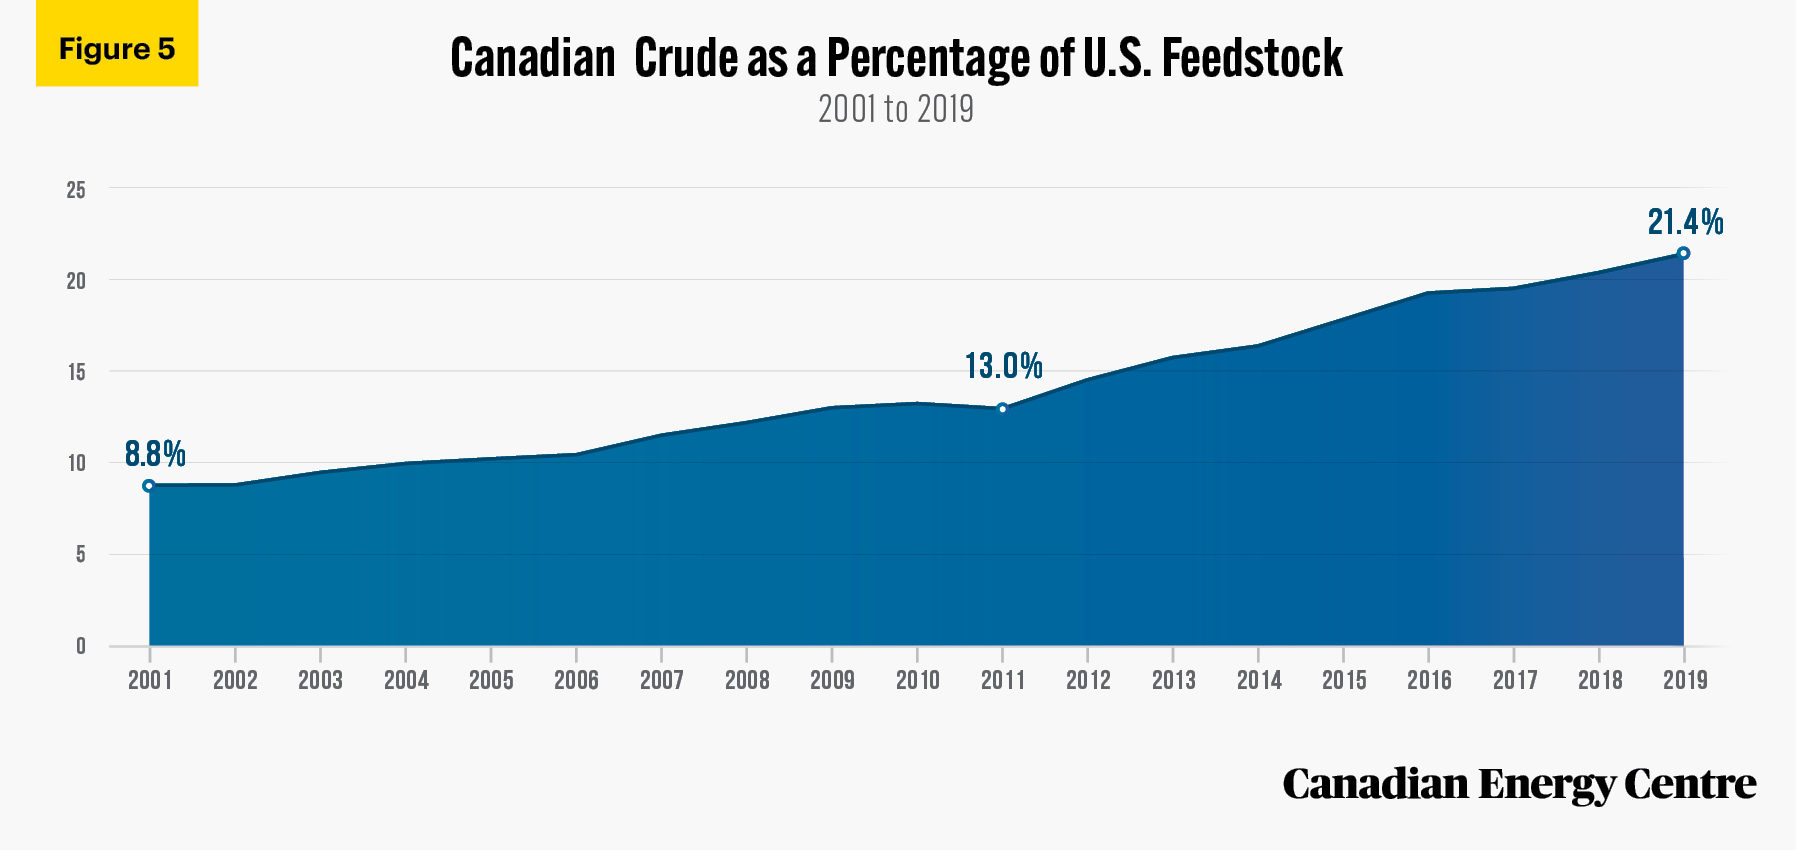
The per cent of Canadian crude in U.S. refinery feedstock (i.e., the raw materials and intermediate materials processed at refineries to produce finished petroleum products, otherwise known as refinery inputs) has steadily risen from nearly 9 per cent in 2000 to over 21 per cent by the end of 2019.
Sources: U.S. Energy Information Administration, 2020b and 2021b.
Canada and LNG
14.
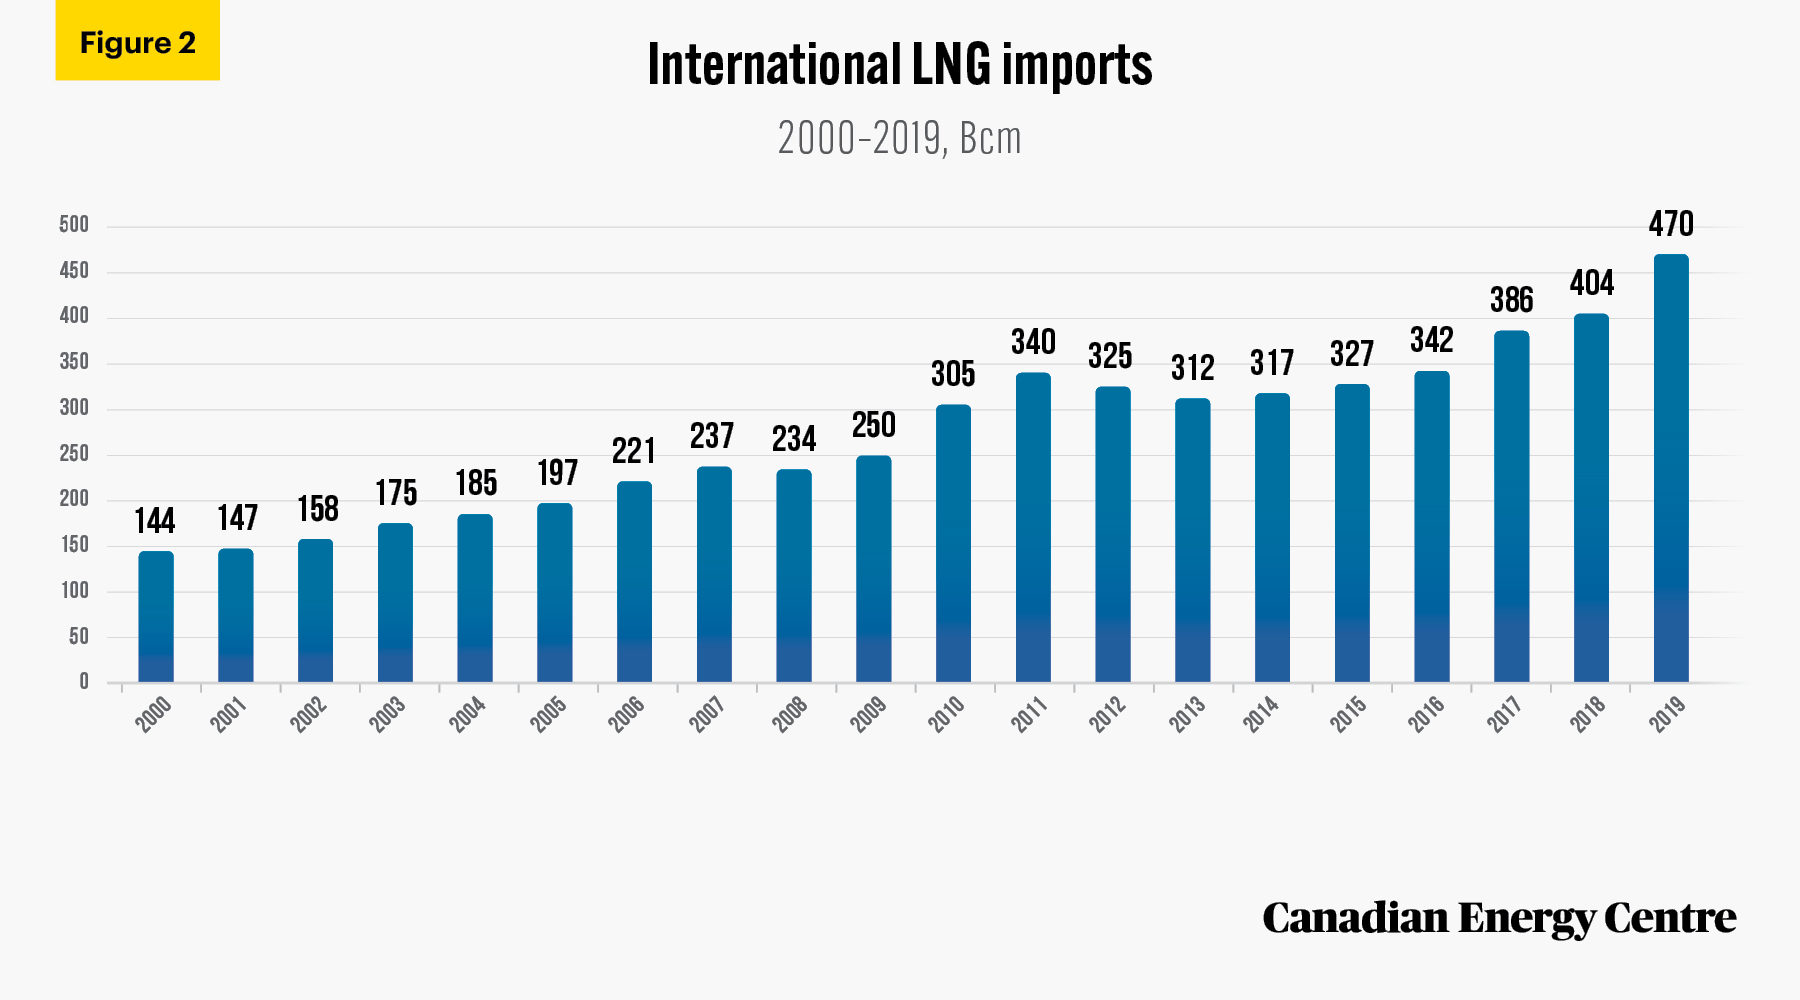
Worldwide imports of natural gas, in the form of Liquefied Natural Gas (LNG), rose from 144 billion cubic metres (bcm) in 2000 to 470 bcm in 2019, an increase of 326 Bcm and 226 per cent during the period. The sharpest rise in LNG imports by volume occurred in Asia (up 237 Bcm). The Asia-Pacific region, with LNG imports of 346 Bcm in 2019, constituted 74 per cent of the world share of all LNG imports.
Source: Authors’ calculations from IEA (2020b), World Energy Statistics (database).
15.
Relative to Western Canada and the Asia-Pacific market for natural gas (in the form of LNG), the price difference between Canada and Asia provides an opportunity for Canadian natural gas producers to export to Asia-Pacific markets. Since 2009, Asian natural gas prices have been higher than Canadian natural gas by triple percentages, i.e., selling for between 122 and 775 per cent more in Asia than in Canada, depending on the year.
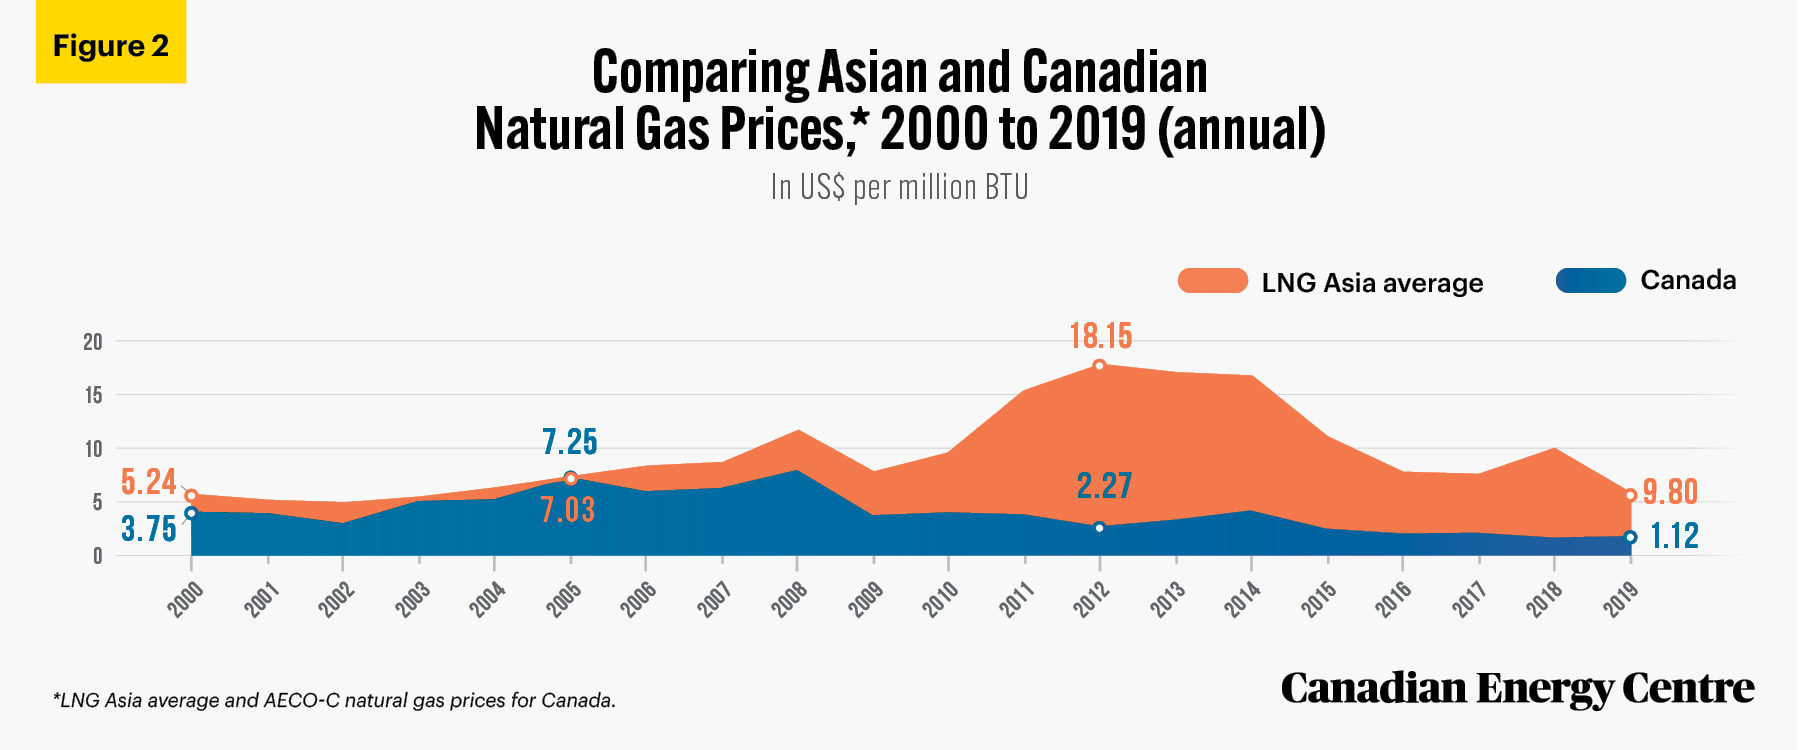
Sources: BP Statistical Review (2020) and International Monetary Fund (2021).
Energy Trade Flows Between Canada and the U.S.
16.
Over the past two decades, the cumulative aggregate value of energy products trade between Canada and the United States was $1.96 trillion, including $138 billion in 2019.
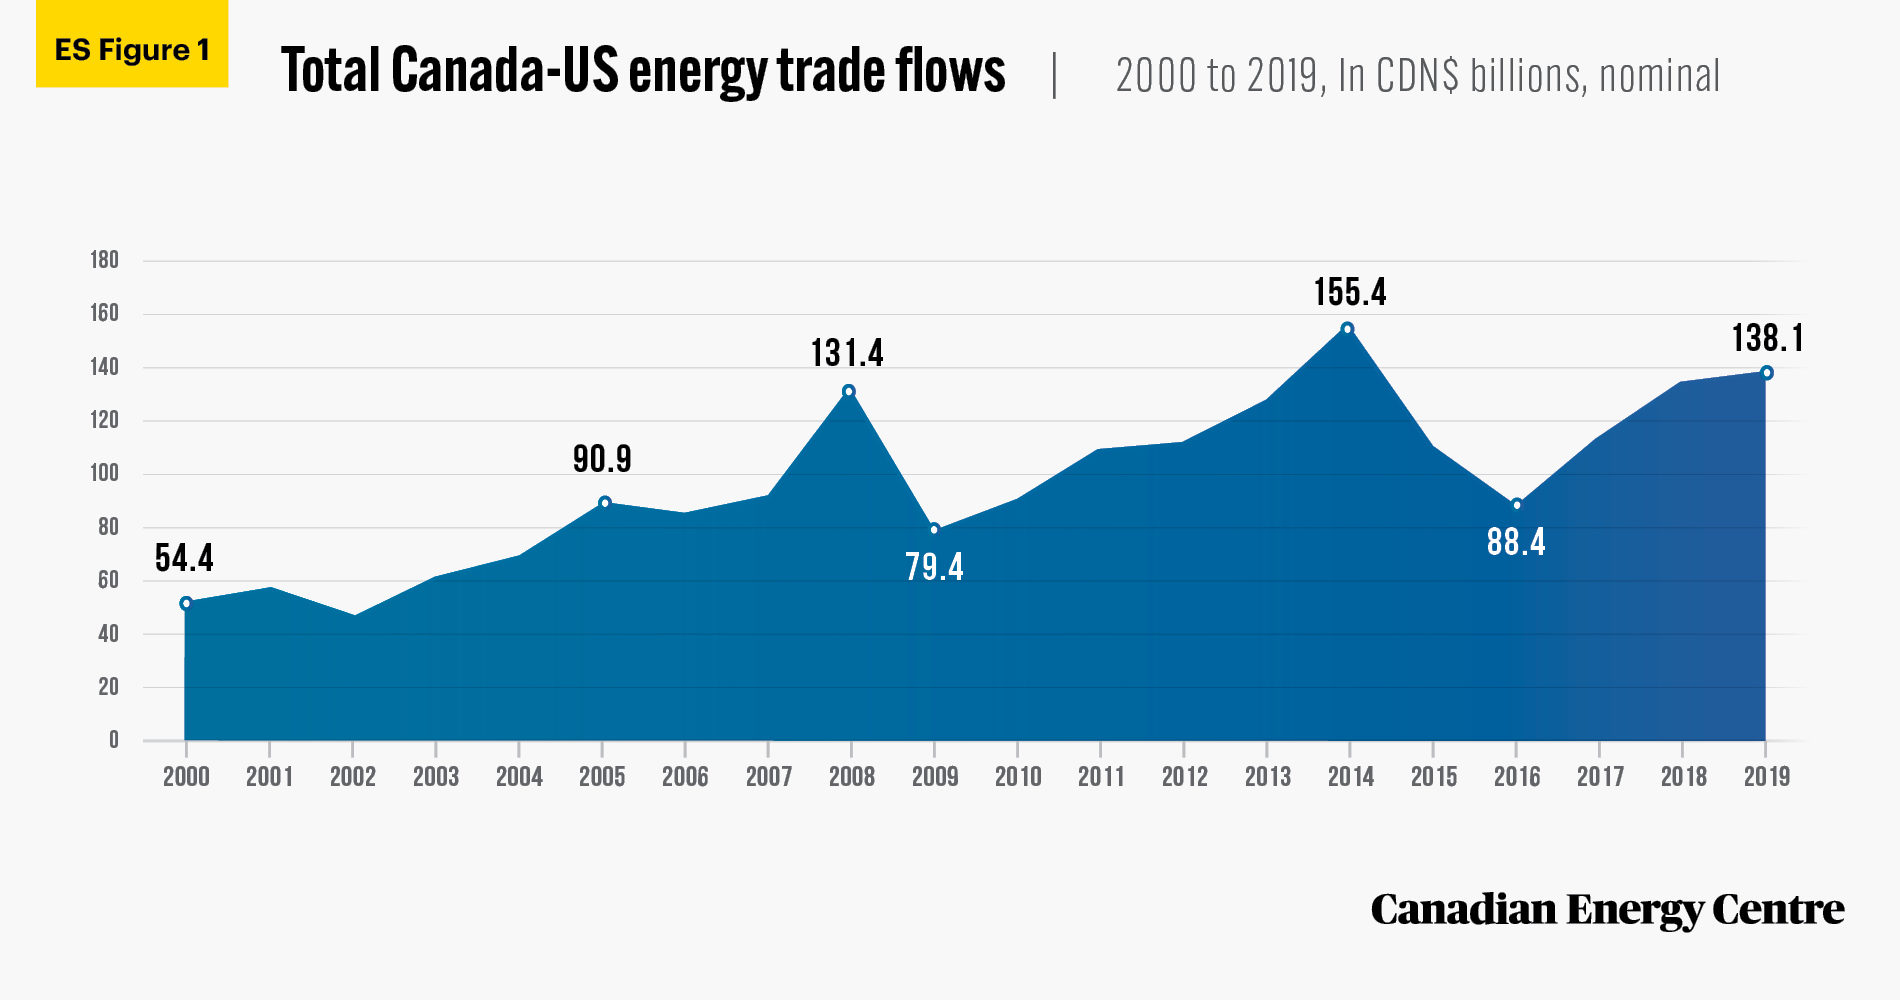
Source: Statistics Canada, Table 12-10-0133-01
17.
Crude oil (including bitumen) has been the largest commodity in the Canada-United States energy products trade flow; a total of $1.12 trillion in crude oil and bitumen has flowed between the two countries from 2000 to 2019, including $101.5 billion in 2019. The second largest commodity in the Canada-United States energy products trade flow over the past two decades is natural gas; a cumulative total trade value of $426.3 billion of that product has passed between the two countries, including $12.1 billion in 2019.
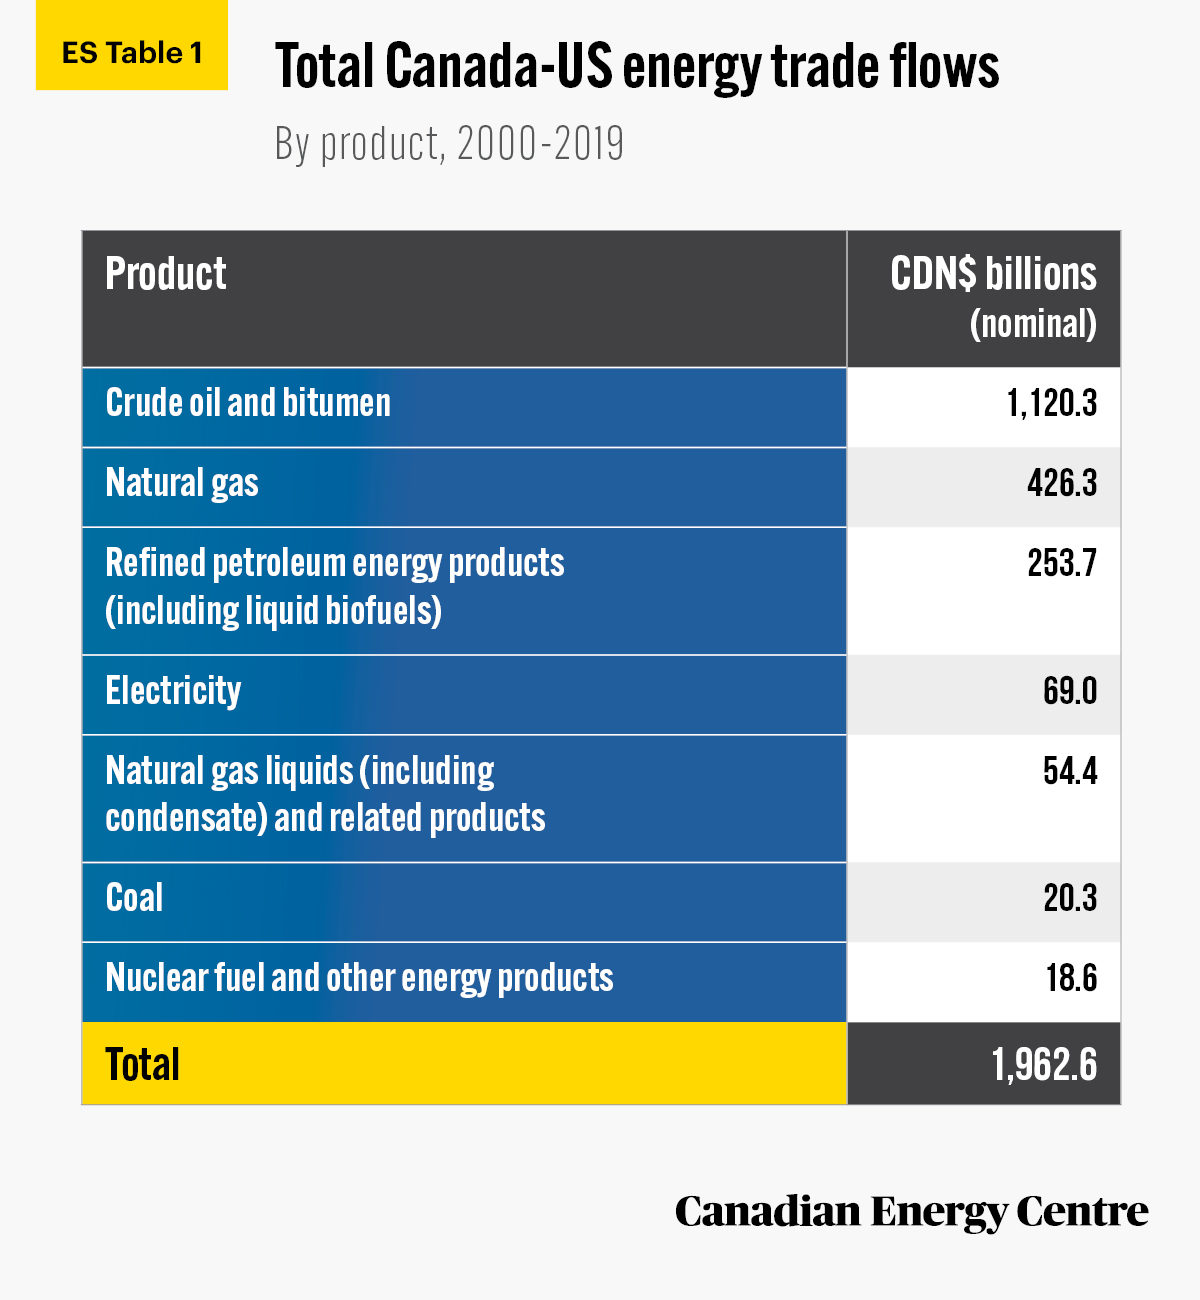
Source: Statistics Canada, Table 12-10-0133-01.
18.
Enbridge Line 5, the pipeline that winds its way between Superior, Wisconsin, and Sarnia, Ontario. carries products that fuel the region’s industries and communities: light oil, synthetic light oil, and natural gas liquids (NGLs), much of which is refined into propane. In 2019, the total value of energy product trade flows between Canada and Michigan was over CA$5.8 billion or US$4.4 billion.
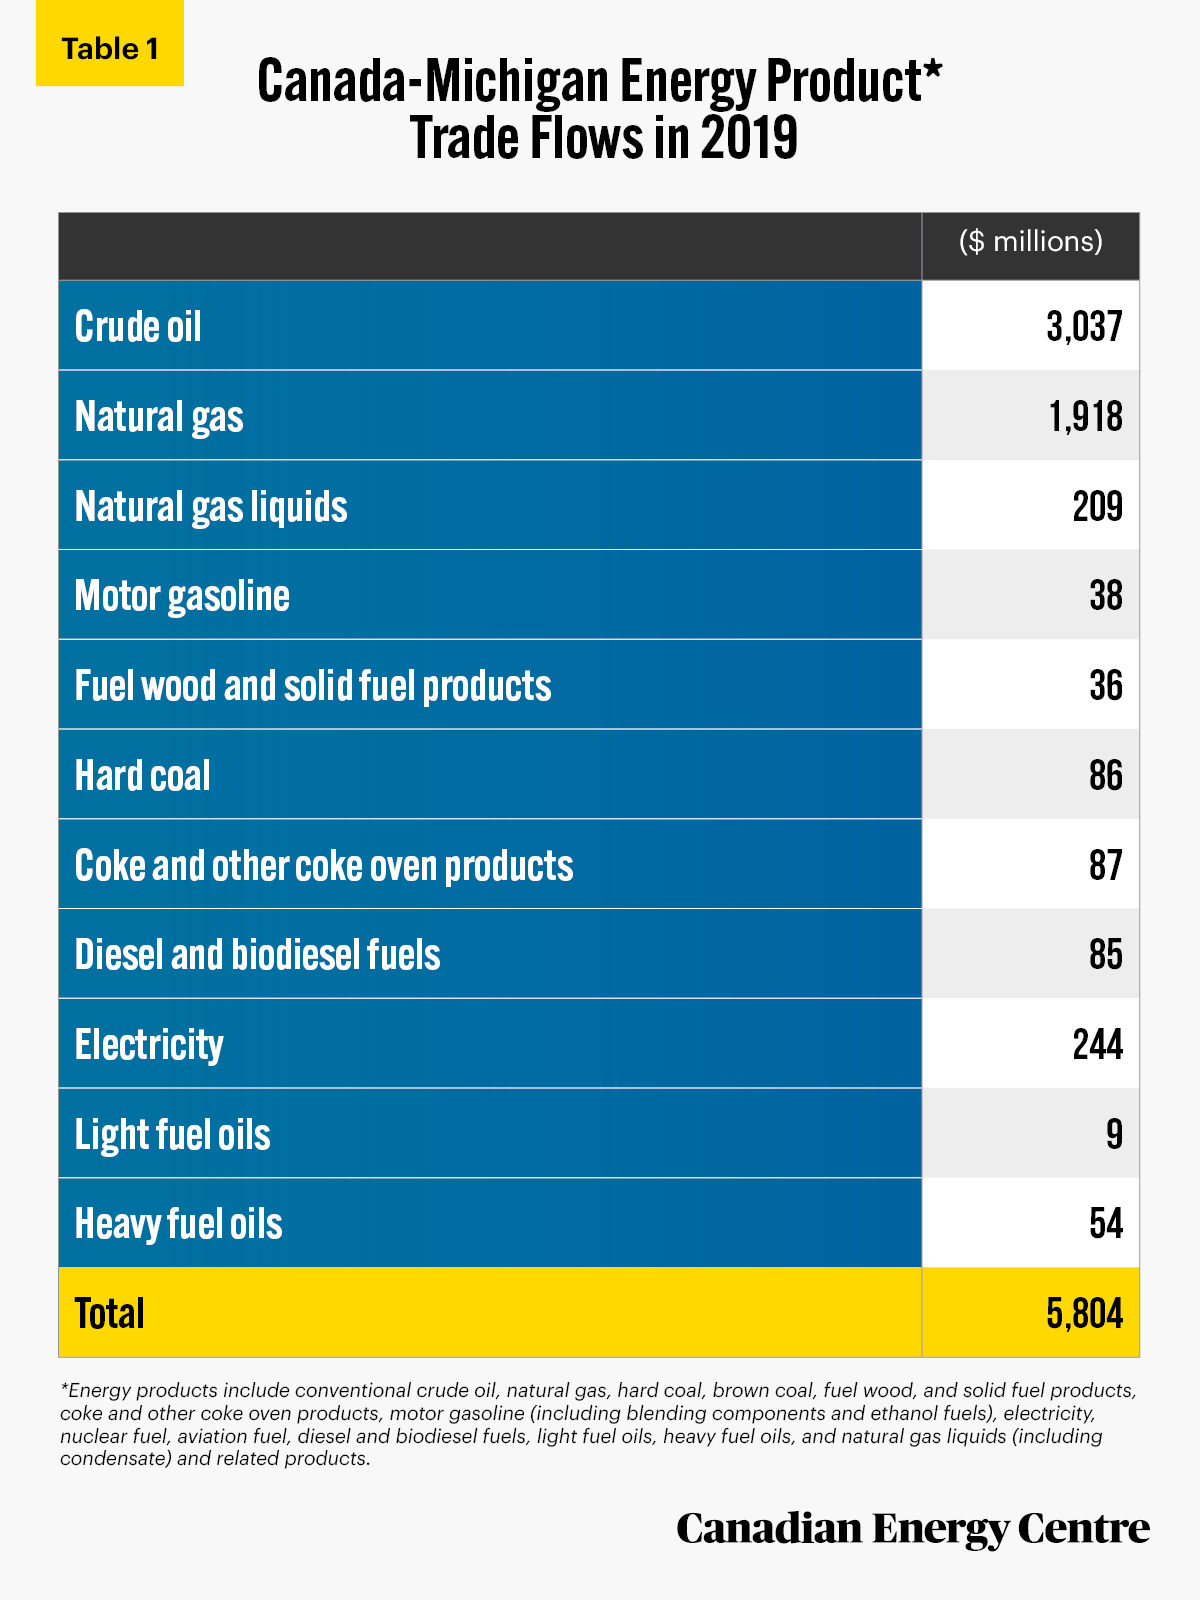
Source: Statistics Canada, International Accounts and Trade Division (2021a and 20201b).
19.
Enbridge’s Line 3 Replacement Project is bringing employment and safer, more reliable energy to communities in Minnesota. In 2019, the total value of the trade flows of energy products between Minnesota and Canada was nearly CA$8.3 billion, or about US$6.4 billion.
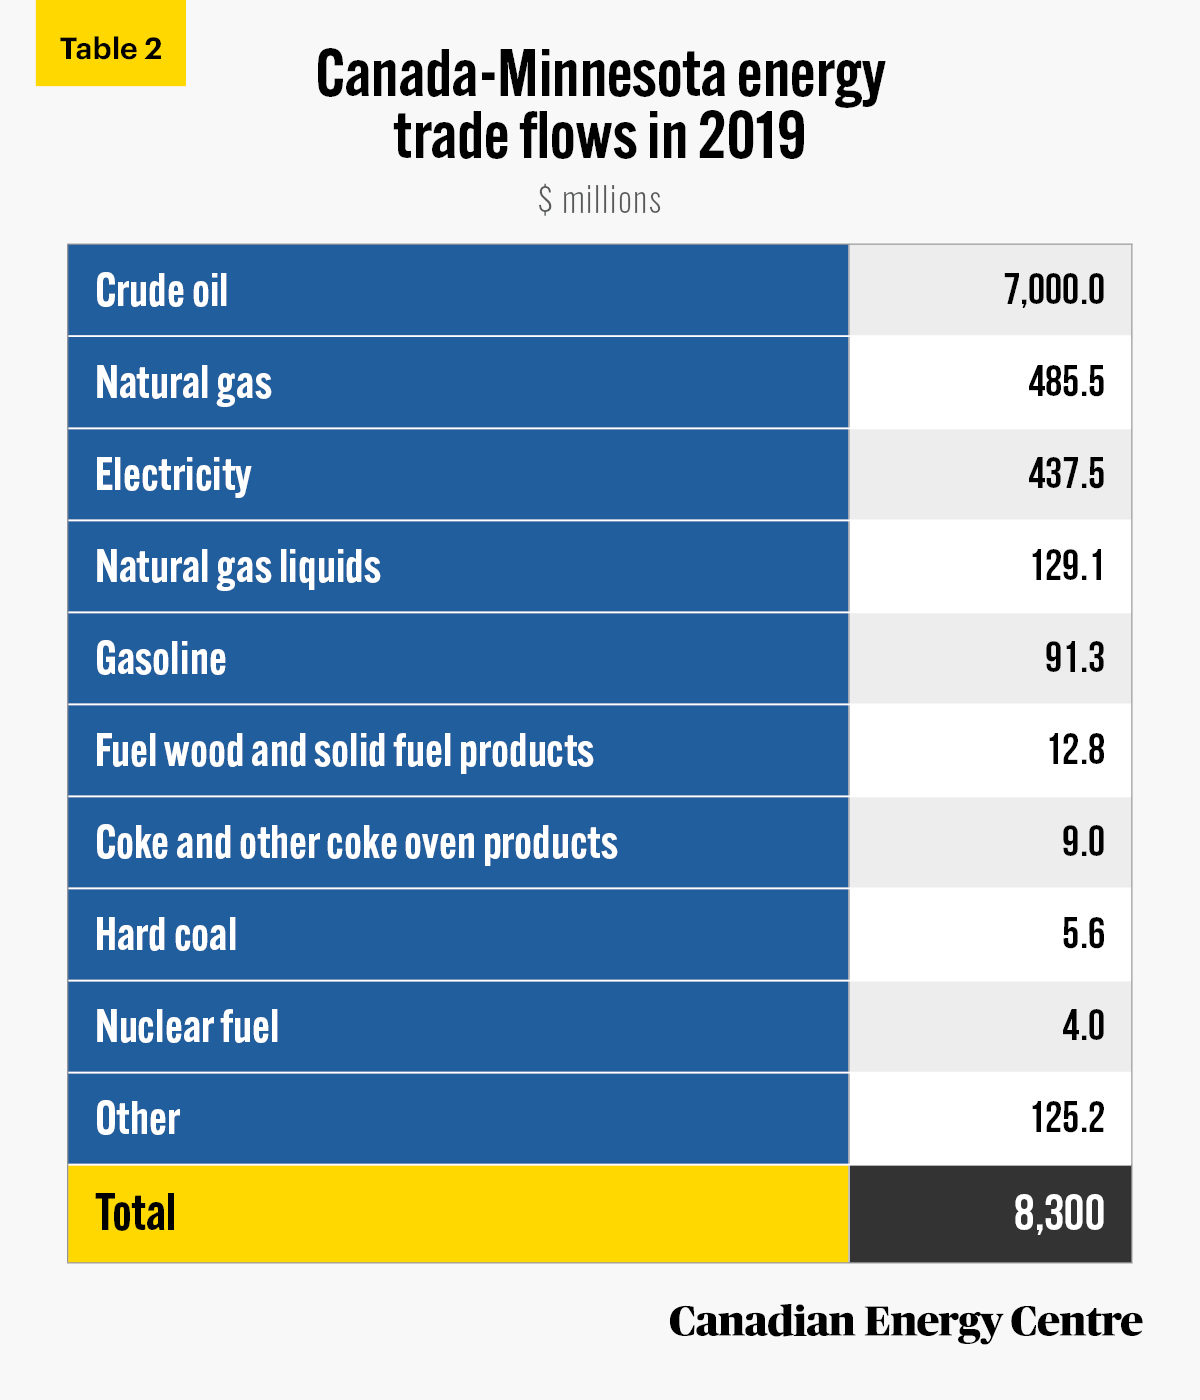
Source: Statistics Canada, International Accounts and Trade Division (2021a and 20201b).
Canada-U.S. Pipeline Network
20.
The Canada-United States (U.S.) pipeline network is a critical component of North American energy security. Pipelines carry crude oil, natural gas, and refined petroleum products within and between the two countries. Combined, the Canada-U.S. energy pipeline network is over 453,000 kilometres long, 11 times the earth’s circumference.
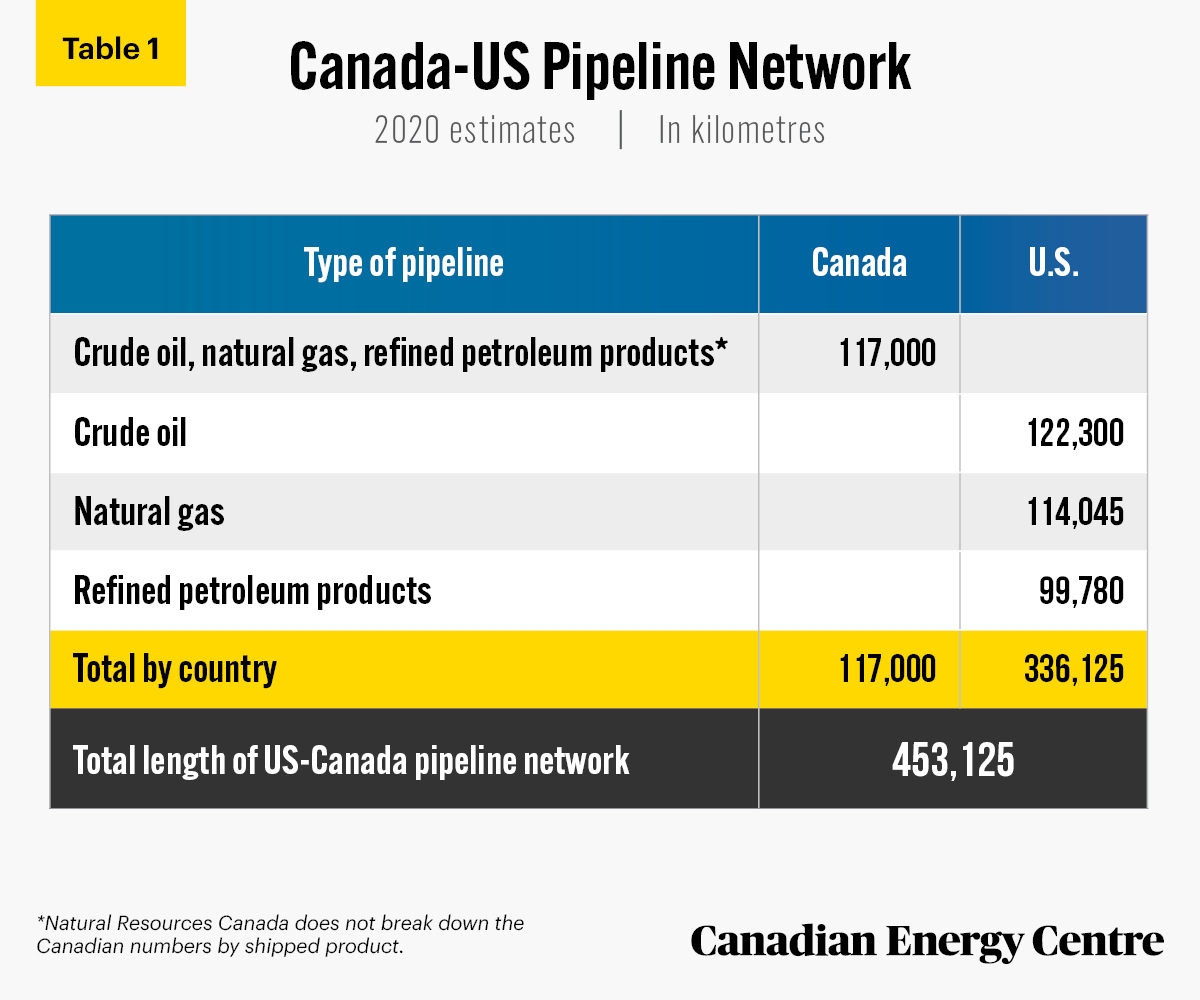
Sources: Natural Resources Canada, undated; American Fuel and Petrochemical Manufacturers, undated.
21.
The economic benefits of the Canada-U.S. pipeline network are nearly $60 billion in GDP and more than 63,400 jobs in the industry, with an average annual salary of over $80,000.
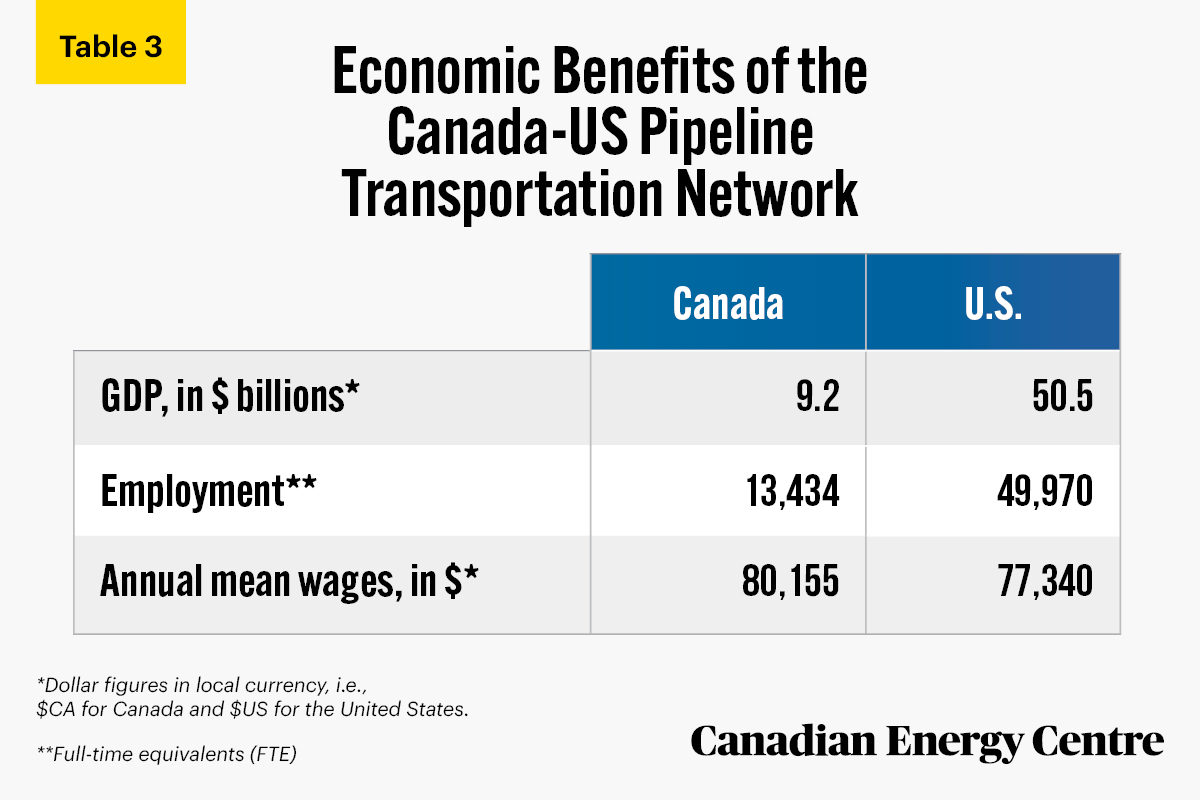
Sources: Alberta Labour Information Service, 2020; Canadian Energy Pipeline Association, 2020; Statistics Canada 2021b; US Bureau of Economic Analysis 2020; US Bureau of Labor Statistics, 2020 and 2021.
22.
As of May 2019, the annual mean wage for an employee in the pipeline transportation industry in the United States was $77,340, nearly 45 per cent higher than the annual mean wage for all occupations.

Source: US Bureau of Labor Statistics, 2020.
23.
A strong American oil and gas industry is a critical element of economic prosperity for the North American energy security network between Canada, the United States and Mexico. This includes pipeline infrastructure such as the Line 3 Replacement Project in Minnesota. The pipeline transportation industry plays a significant role in the Minnesota economy, employing 1,169 people, providing nearly $134 million in employee compensation, contributing nearly $444 million to value-added/GDP, and generating nearly $128 million in taxes for federal, state and county governments.
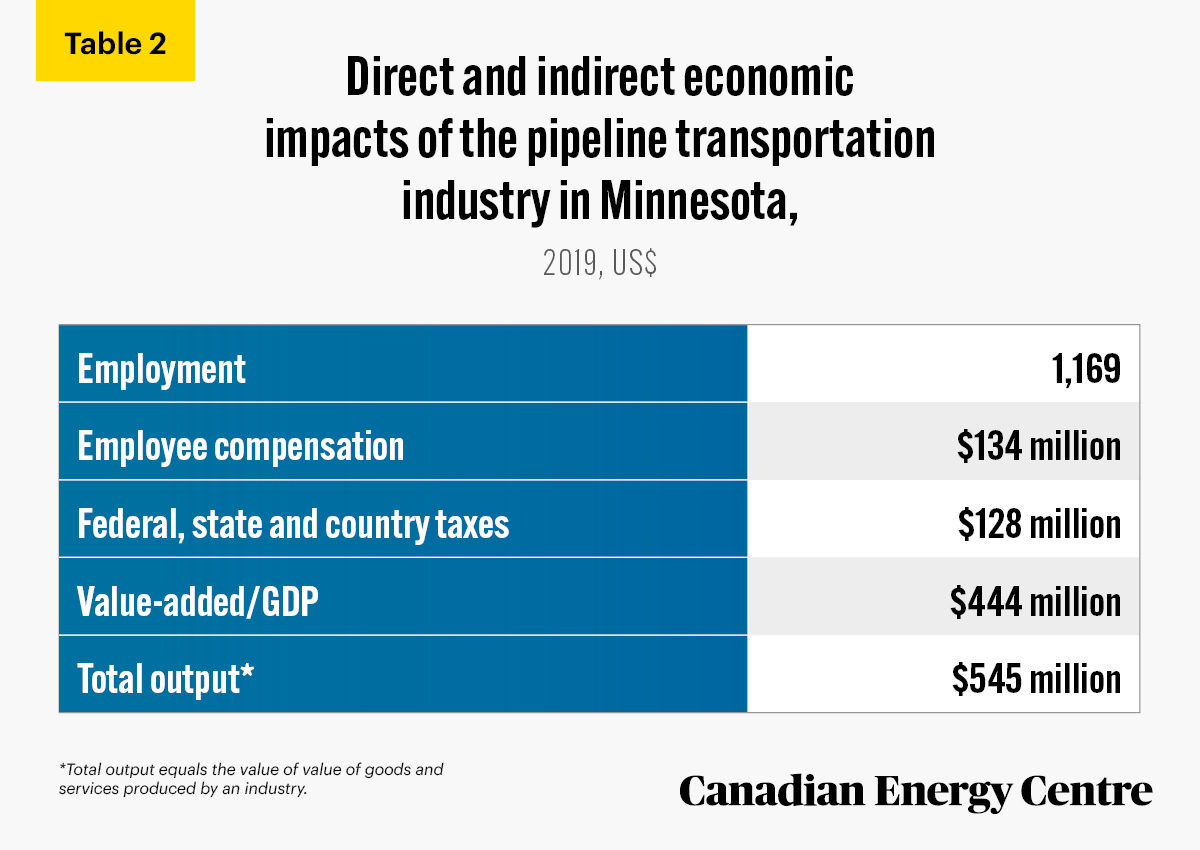
Source: IMPLAN 2021
Economic Impacts of the U.S. Oil and Gas Industry
24.
A strong American oil and gas industry is a critical element of economic prosperity and the North American energy security network linking Canada, the United States, and Mexico. The direct and indirect economic impacts of the U.S. oil and gas industry in 2019 included two million direct jobs, three million indirect jobs, $356 billion in employee compensation, over $238 billion in direct and indirect federal, state, and county taxes, $985 billion in direct and indirect value-added/GDP, and $2.1 trillion in what is known as “outputs,” i.e., the value of goods and services produced by an industry.
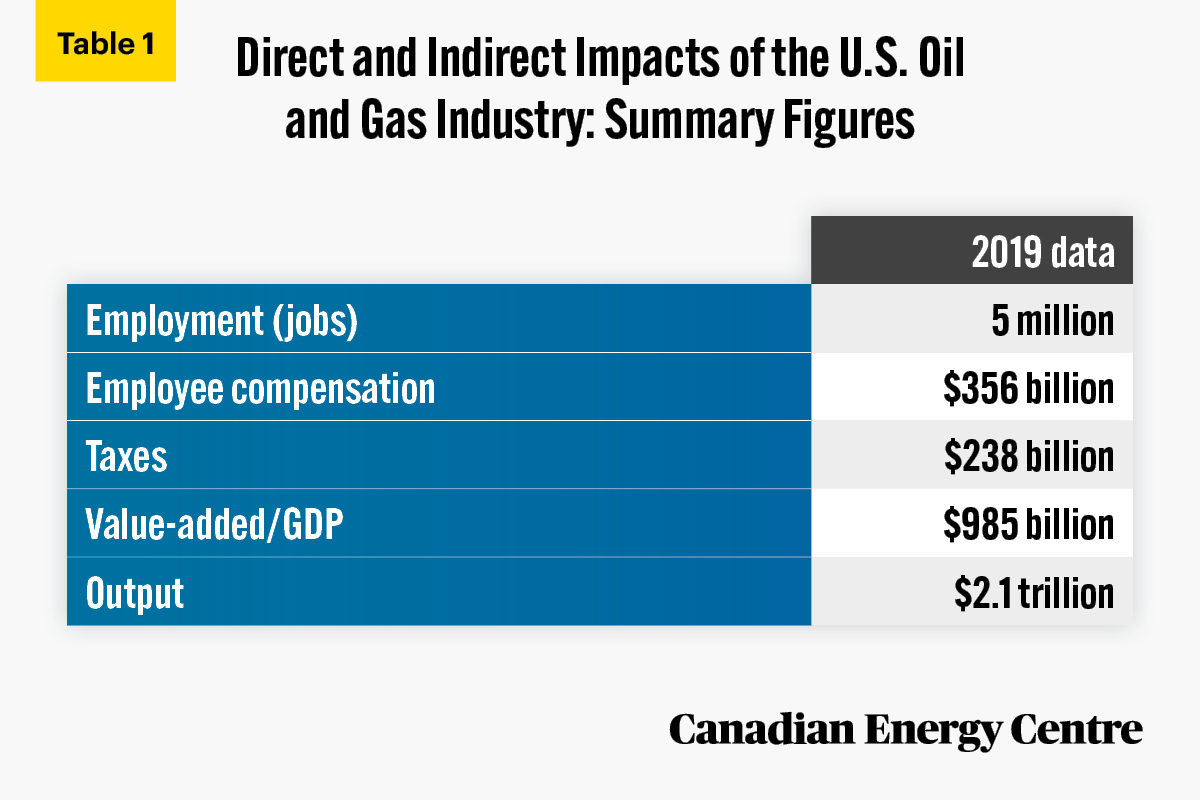
Source: IMPLAN, 2021.
New Canadians in Canada’s Resource Sector
25.
The number of landed immigrants employed in the oil and gas sector has increased from 8,800 in 2006 to 15,600 in 2020.

Source: Derived from Statistics Canada, Labour Force Survey, custom tabulation.
26.
Landed immigrants employed in the oil and gas extraction sector are paid more than those working in other goods-producing industries and more than the average for all industries for landed immigrants. In 2020, the average weekly wage ranged from $1,082 for landed immigrants employed in agriculture, forestry, fishing, and hunting to $2,161 in the oil and gas extraction sector. By comparison, the all-industry average weekly wage for landed immigrants was $1,264.
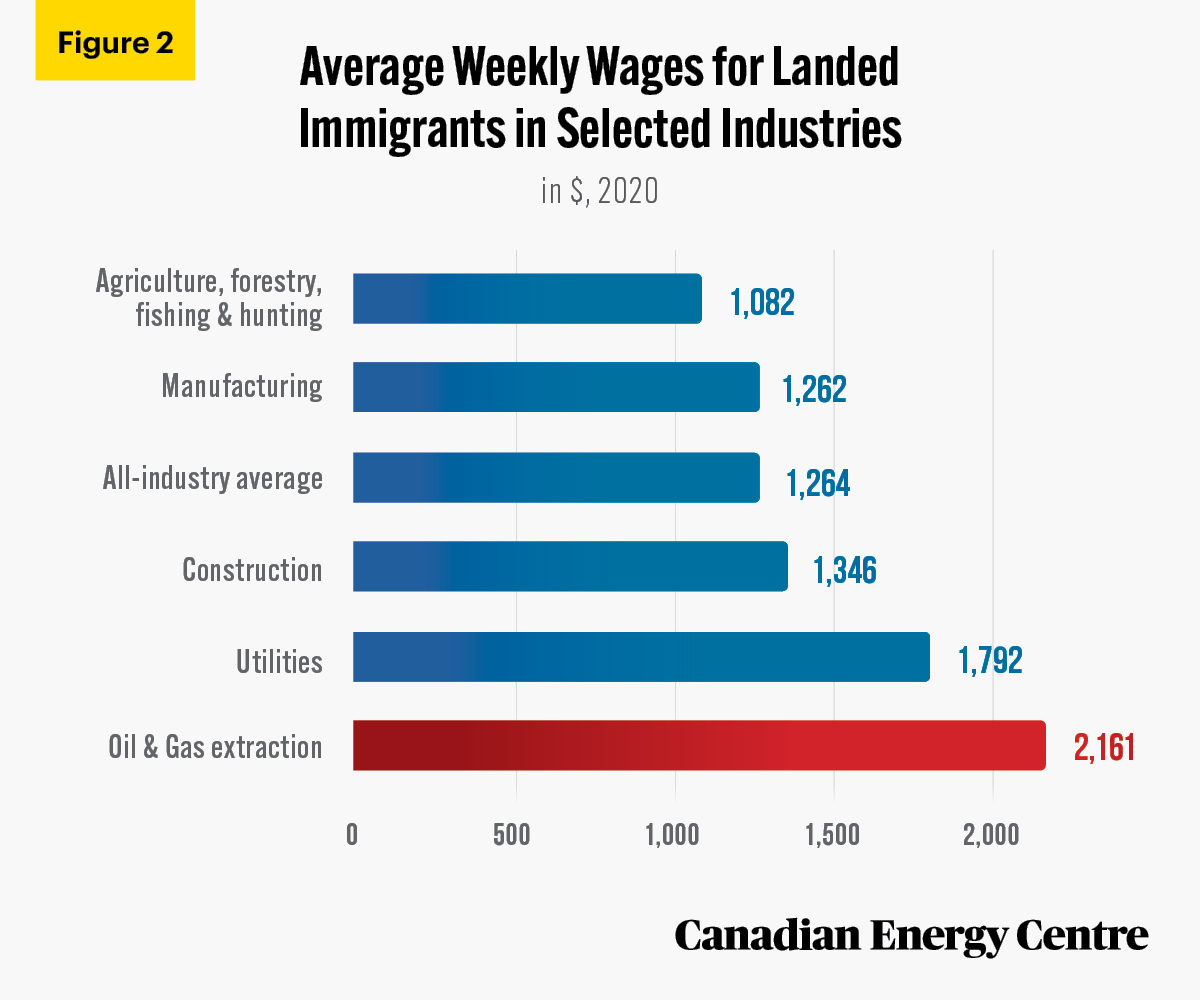
Derived from Statistics Canada, Labour Force Survey, custom tabulation.
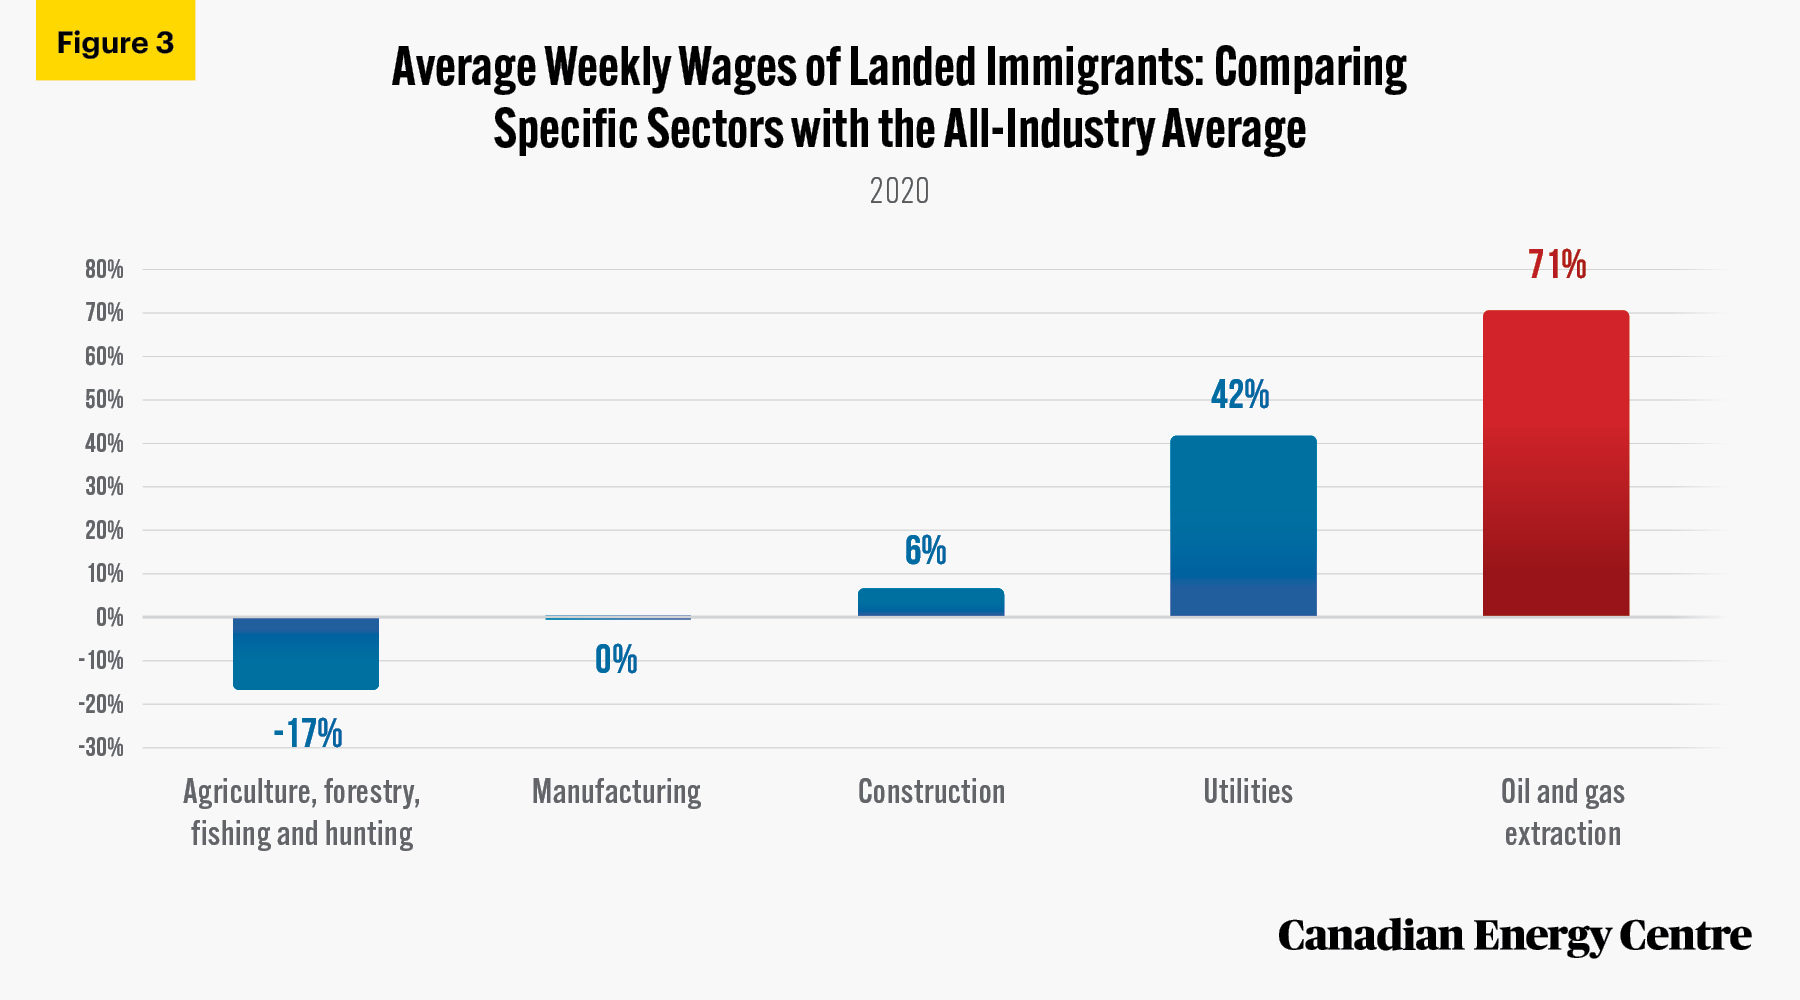
27.
The average weekly wage for landed immigrants in the oil and gas sector was higher than for those in selected other sectors and the all-industry average. Immigrants in agriculture, forestry, fishing, and hunting earned 17 per cent less than the all-industry average; those in manufacturing earned virtually the same as that average; those in construction earned 6 per cent more; and immigrants working in the utilities sector earned 42 per cent more. Meanwhile, those working in oil and gas earned 71 per cent more than the all-industry average.
Derived from Statistics Canada, Labour Force Survey, custom tabulation.
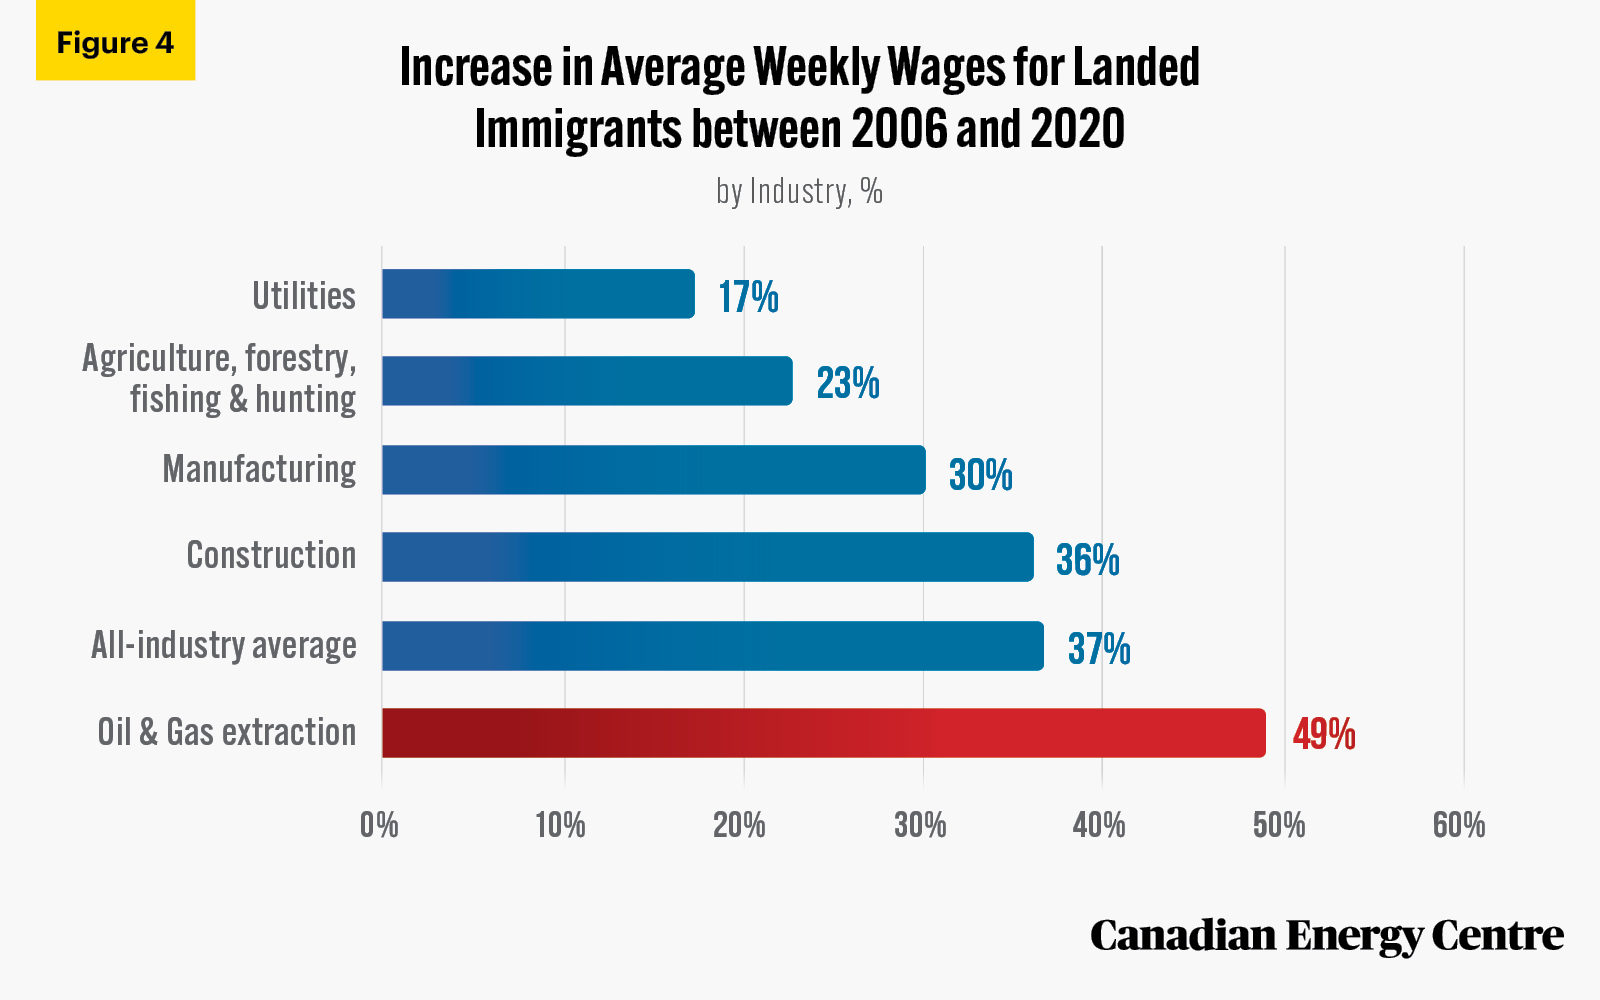
28.
Between 2006 and 2020, average weekly wages for landed immigrants employed in the oil and gas extraction sector grew from $1,450 to $2,161, an increase of nearly 49 per cent, or $711 more. This compares with a range of 17 per cent higher for those in the utilities sector and 36 per cent more for those in construction. The all-industry average growth was 37 per cent between 2006 and 2020, or in dollar terms, an increase of $340.
Derived from Statistics Canada, Labour Force Survey, custom tabulation.

Derived from Statistics Canada, Labour Force Survey, custom tabulation.
Environmental, Social and Governance (ESG)
29.
Canada’s oil and gas sector is estimated to account for just 0.4 per cent of global GHG emissions, while the oil sands sub-sector itself is estimated to account for just 0.2 per cent of global GHG emissions.
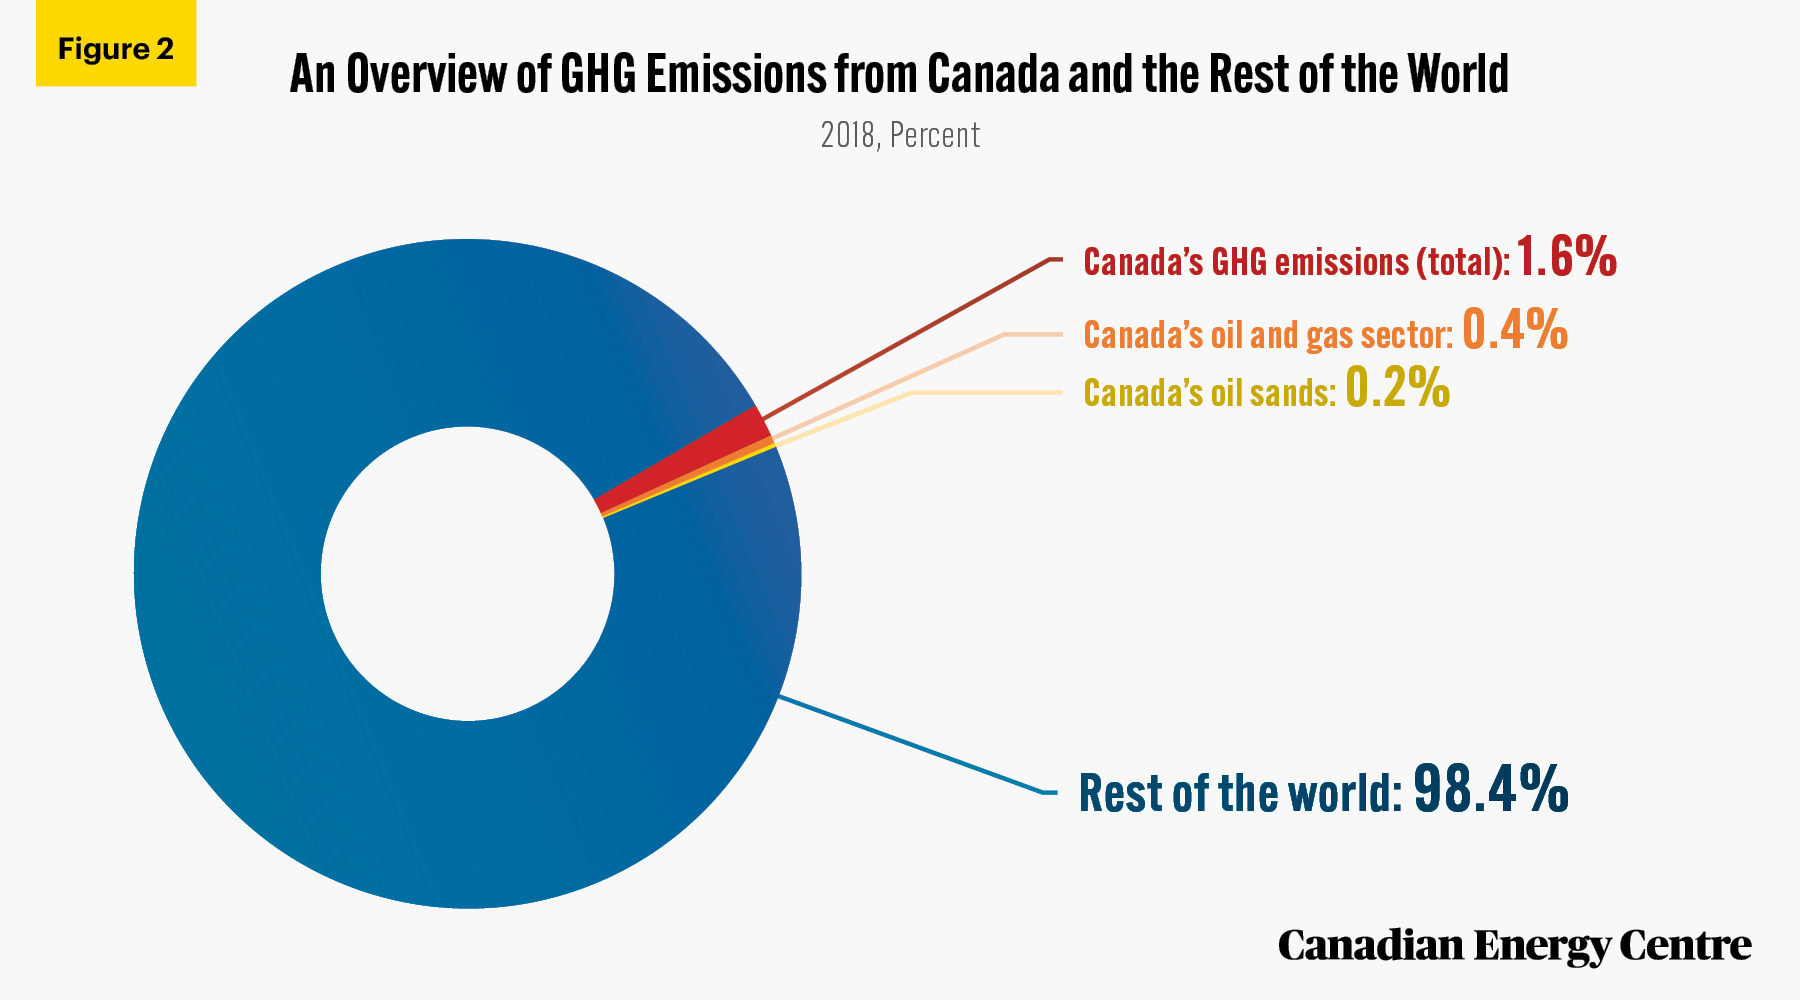
Sources: BMO Capital Markets (2020) and Climate Watch (2021).
30.
On environmental spending, when capital and operating expenses on environmental protection in Canada are combined, out of $67.7 billion spent between 2006 and 2018, the oil and gas sector spent $28.1 billion or 41.5 per cent.
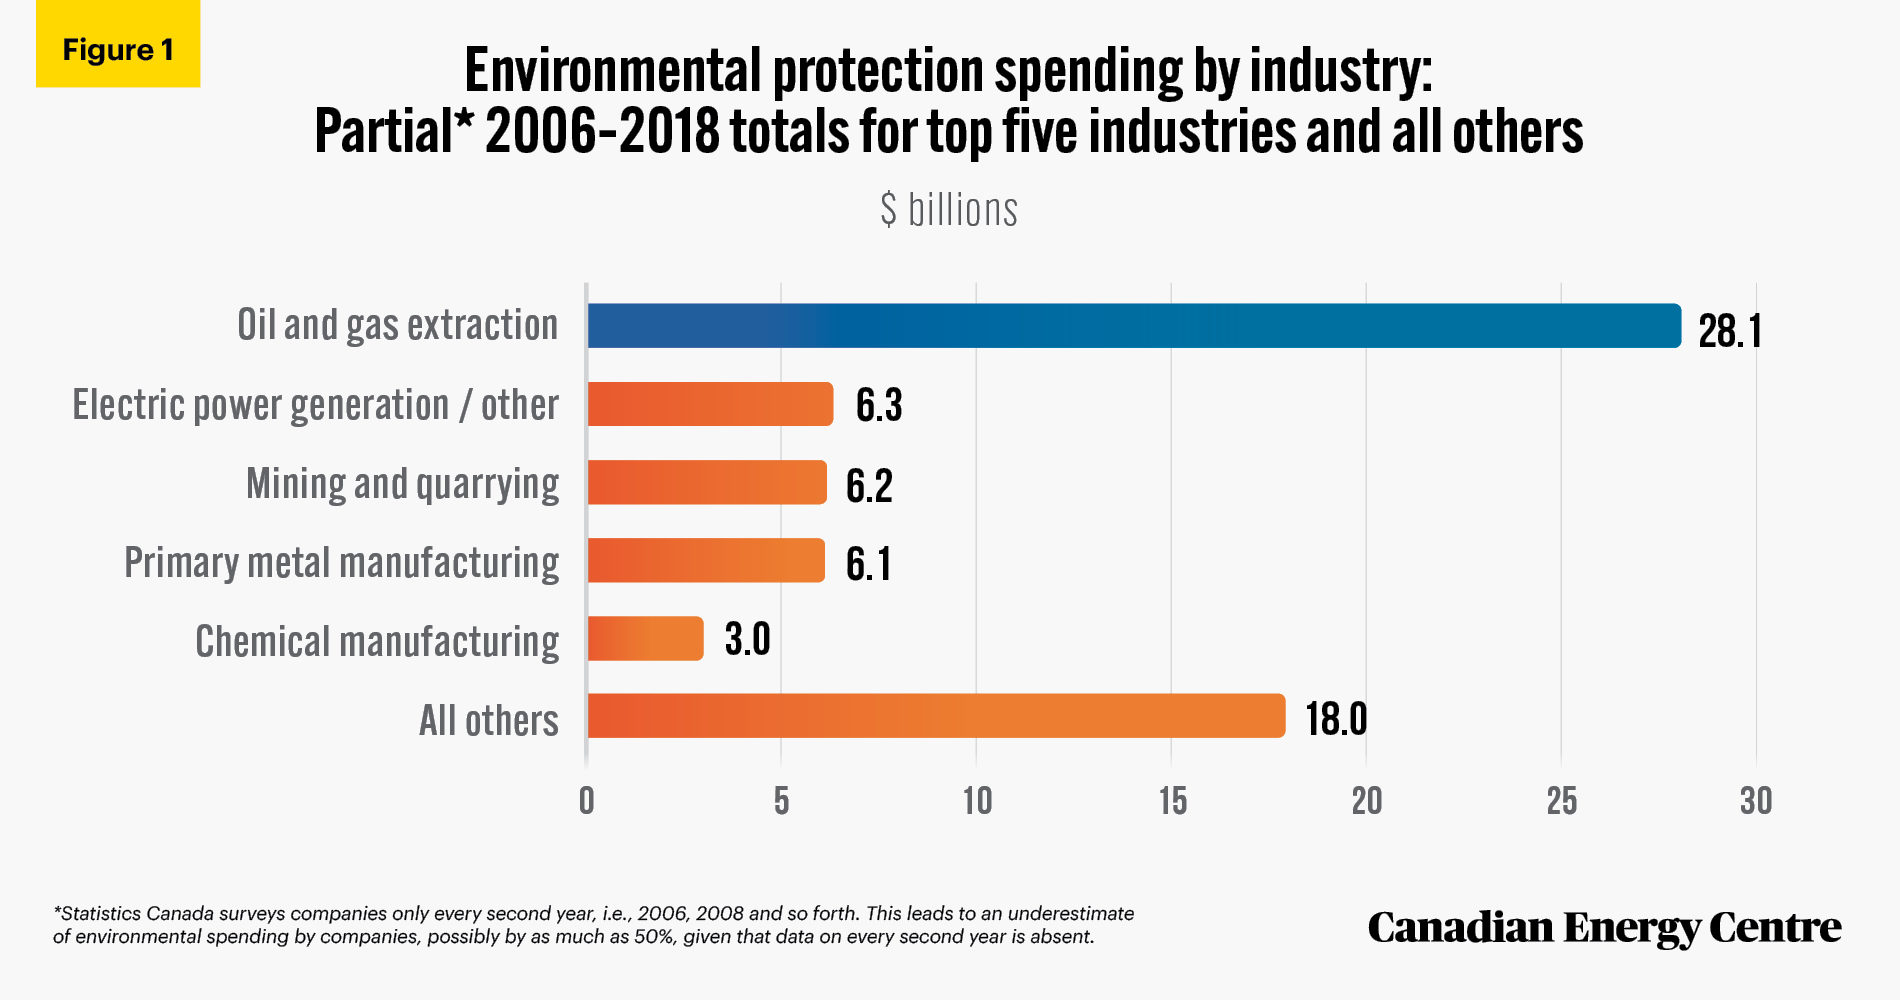
Source: Statistics Canada Table 38-10-0042-01 and Table: 38-10-0130-01.
31.
The oil and gas sector was responsible for 51 per cent ($15.2 billion) of all capital spending for environmental protection compared with 49 per cent for all other industries together ($14.7 billion).
32.
The oil and gas sector was responsible for 34 per cent ($12.9 billion) of all operating expenditures for environmental protection compared with 66 per cent for all other industries together ($24.9 billion).
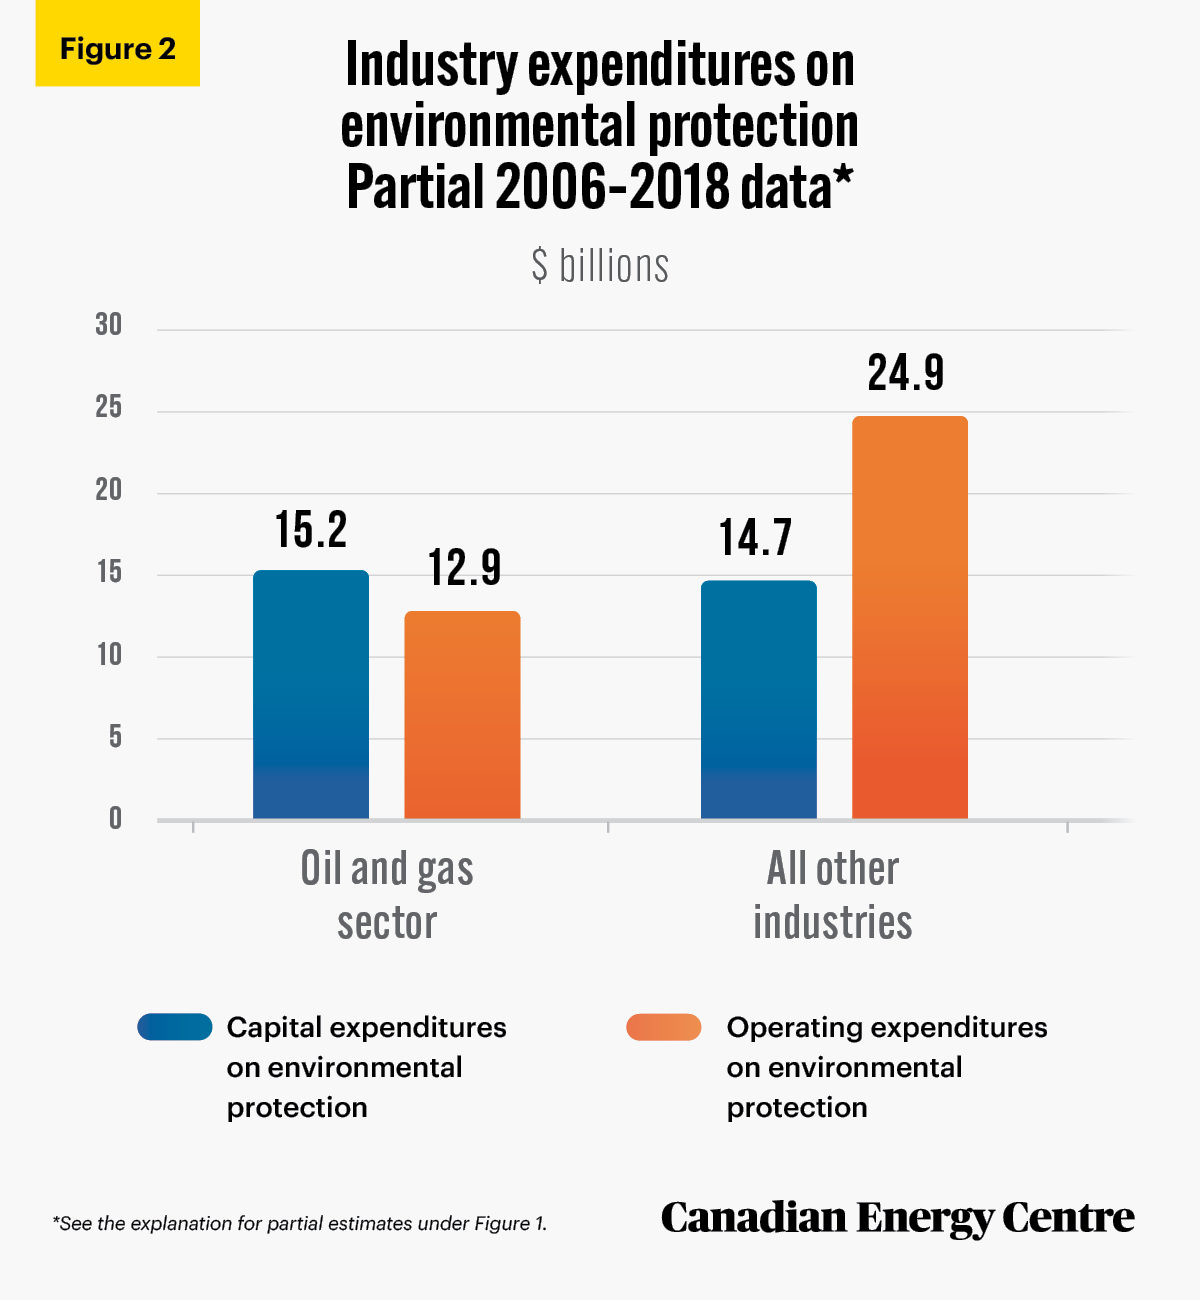
Source: Statistics Canada Table 38-10-0042-01 and Table: 38-10-0130-01
33.
Canada’s greenhouse gas emissions intensity has fallen by 30 per cent since 2000. Between 2000 and 2019, GHG emissions intensity in Canada has fallen from 0.5 megatonnes of carbon dioxide equivalent (Mt of CO2e) per billion dollars of GDP to 0.35 Mt.
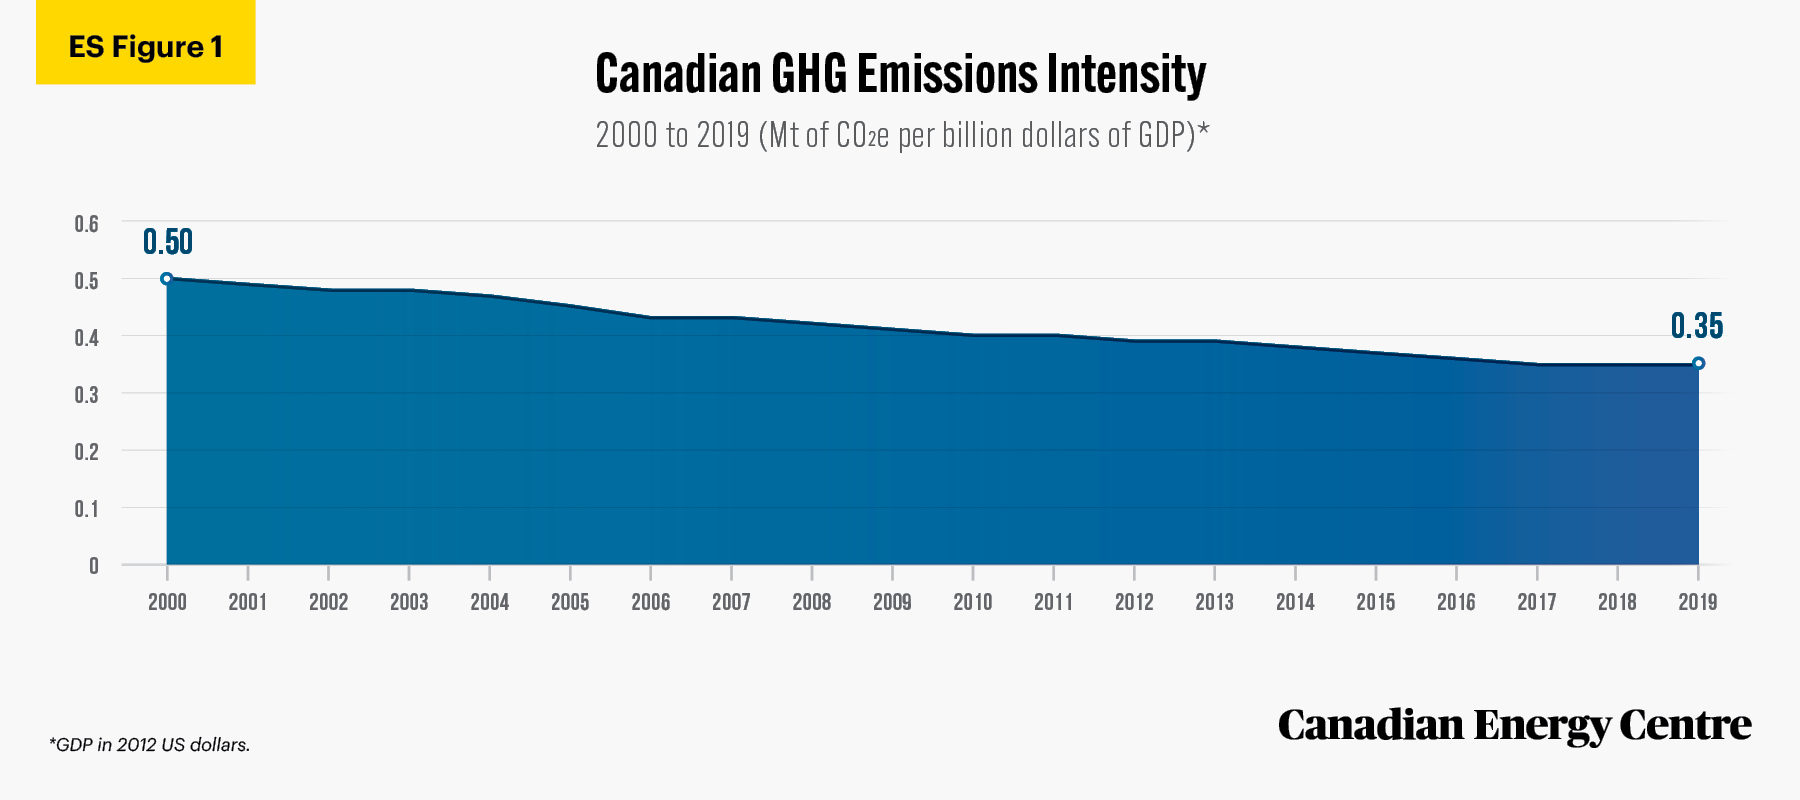
Source: Environment and Climate Change Canada (2021b).
34.
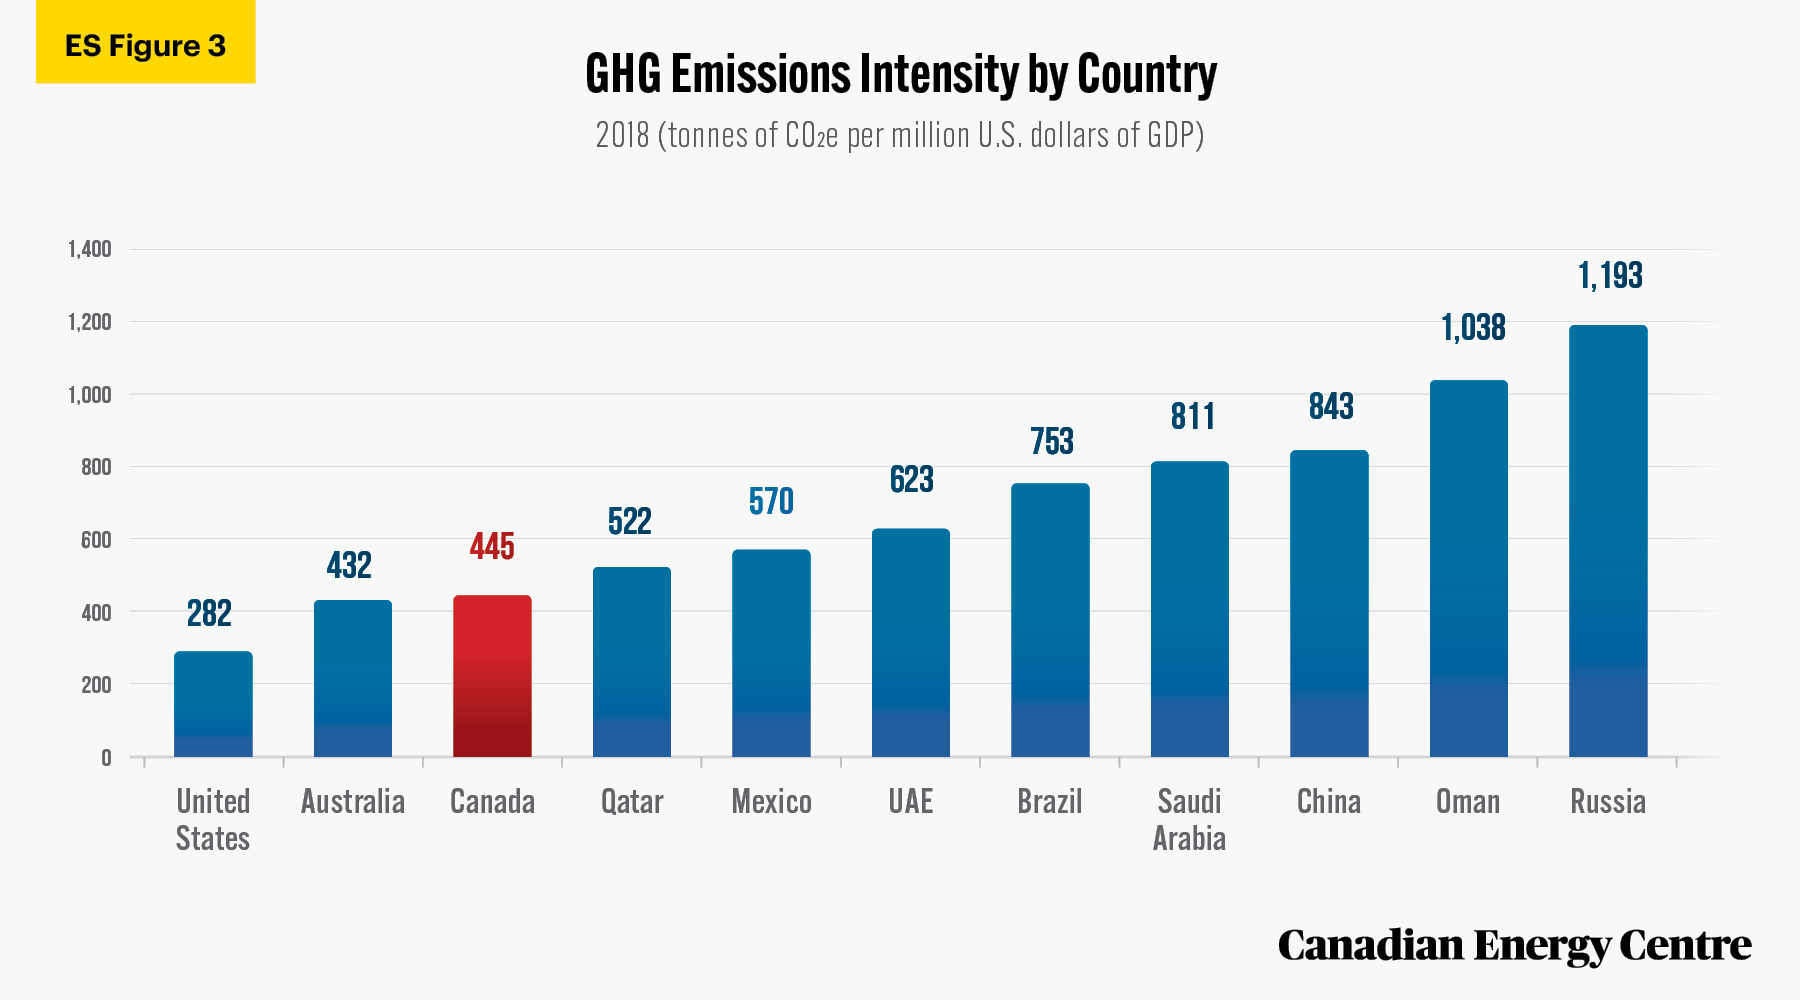
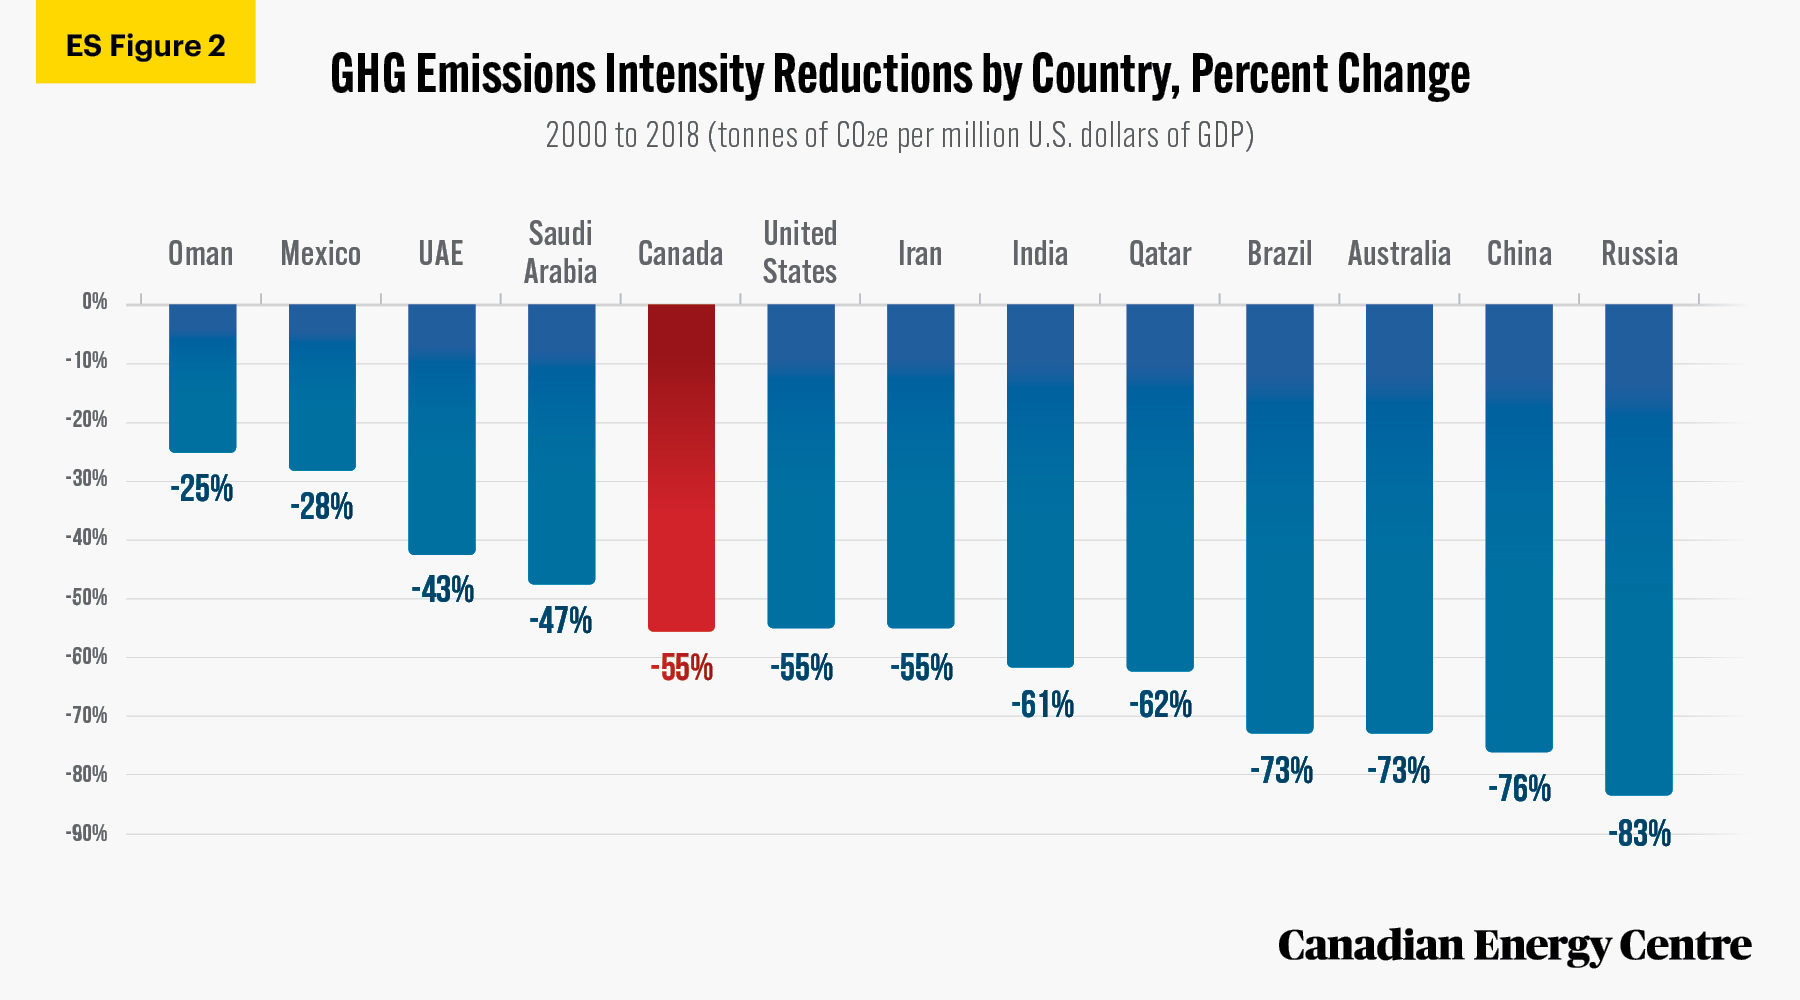
Between 2000 and 2018, Canada’s GHG emissions intensity fell from 996 tonnes of CO2e per million dollars of GDP to 445 tonnes, a decline of over 55 per cent.
Source: Climate Watch (2021).
35.
As of 2018, Canada’s GHG emissions intensity of 445 tonnes of CO2e per million dollars of GDP was lower than many other energy-producing and energy-consuming countries, such as China, India, Brazil, Oman, Russia, Saudi Arabia, Mexico, and the United Arab Emirates.
Source: Climate Watch (2021).
36.
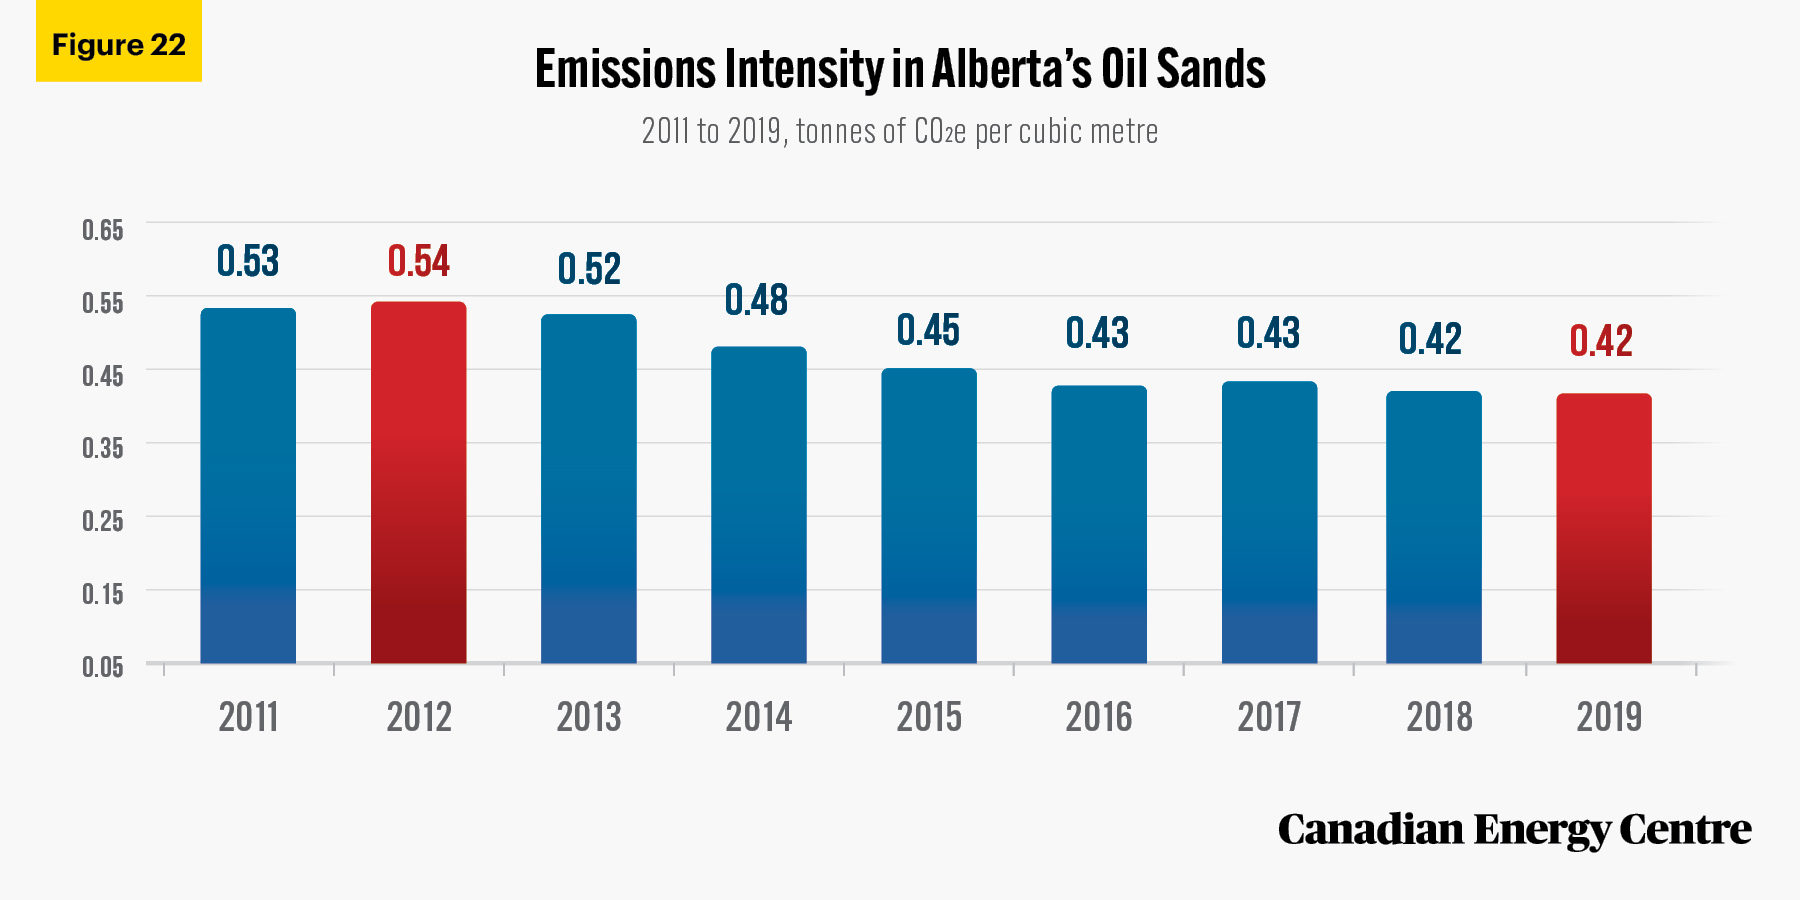
Over the past decade, there has been a marked improvement in GHG emissions intensities (i.e. upstream GHG emissions associated with oil sands extraction and primary processing) for Canadian oil sands crudes.
- Between 2011 and 2019, the crude production GHG emissions intensity of overall Alberta oil sands commonly exported to the United States fell from 0.53 tonnes of CO2e per cubic metre to 0.42 tonnes, a decline of about 22 per cent.
Source: Government of Alberta.
37.
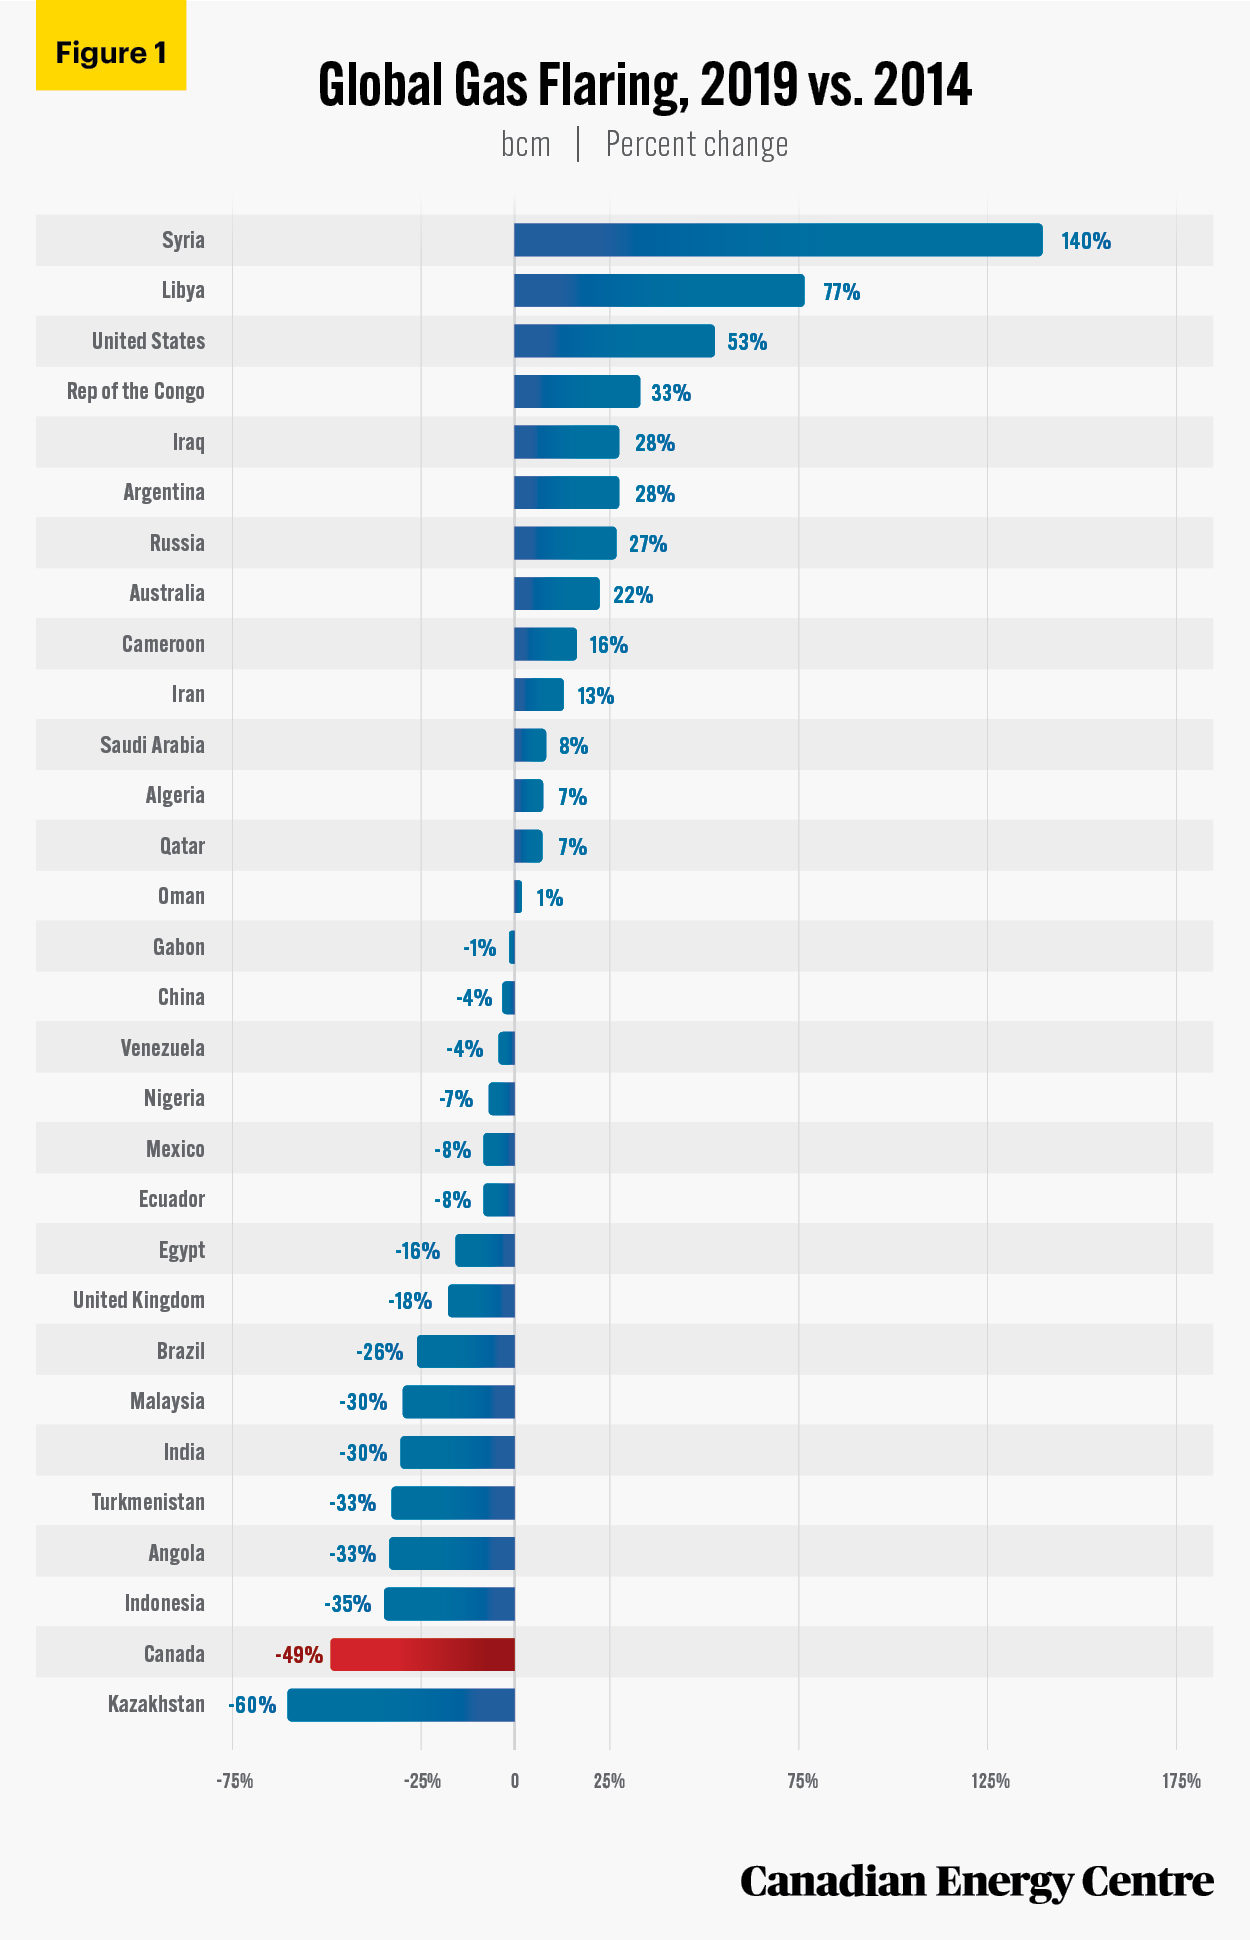
There has been a 49 per cent reduction in emissions from oil and gas flaring in Canada in 2019 relative to 2014, even though oil production rose by 25 per cent.
Source: World Bank.
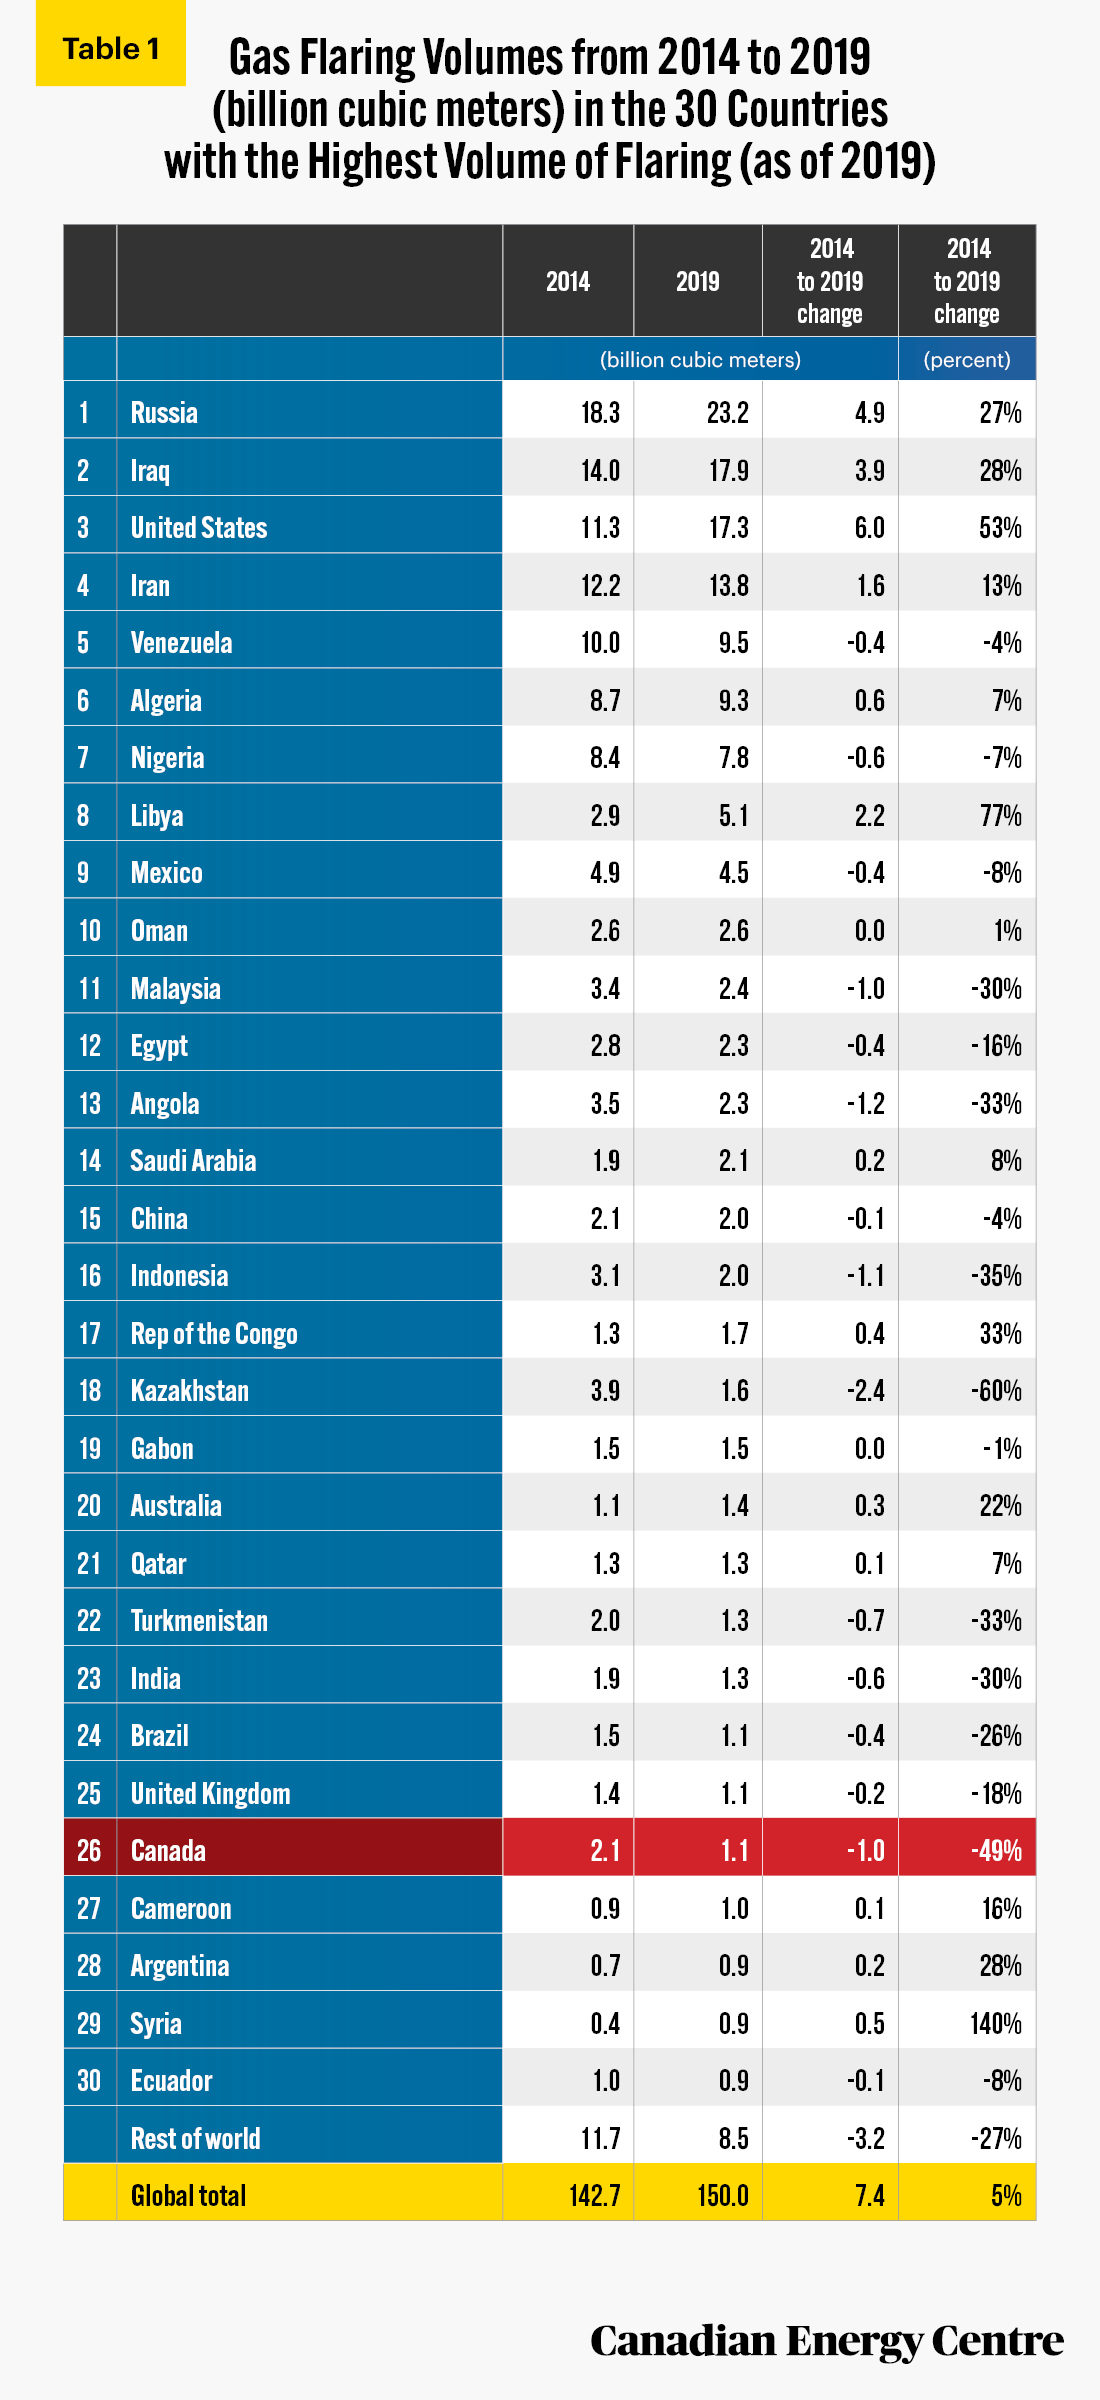
38.
Canada ranks the fifth lowest out of 30 countries for natural gas flaring, despite being the fourth-largest oil and gas producer. Canada’s flaring emissions were 1.1 bcm in 2019, while Russia was the highest at 23.2 bcm, followed by Iraq at 17.9 bcm, the United States at 17.3 bcm, and Iran at 13.8 bcm.
Source: World Bank.
39.
Canada also showed the second-largest decrease in flaring between 2014 and 2019 – a 49 per cent decrease, second only to Kazakhstan, which reduced flaring by 60 per cent. This decrease occurred while petroleum liquids production in Canada rose by 25 per cent and dry natural gas production rose by 5 per cent.
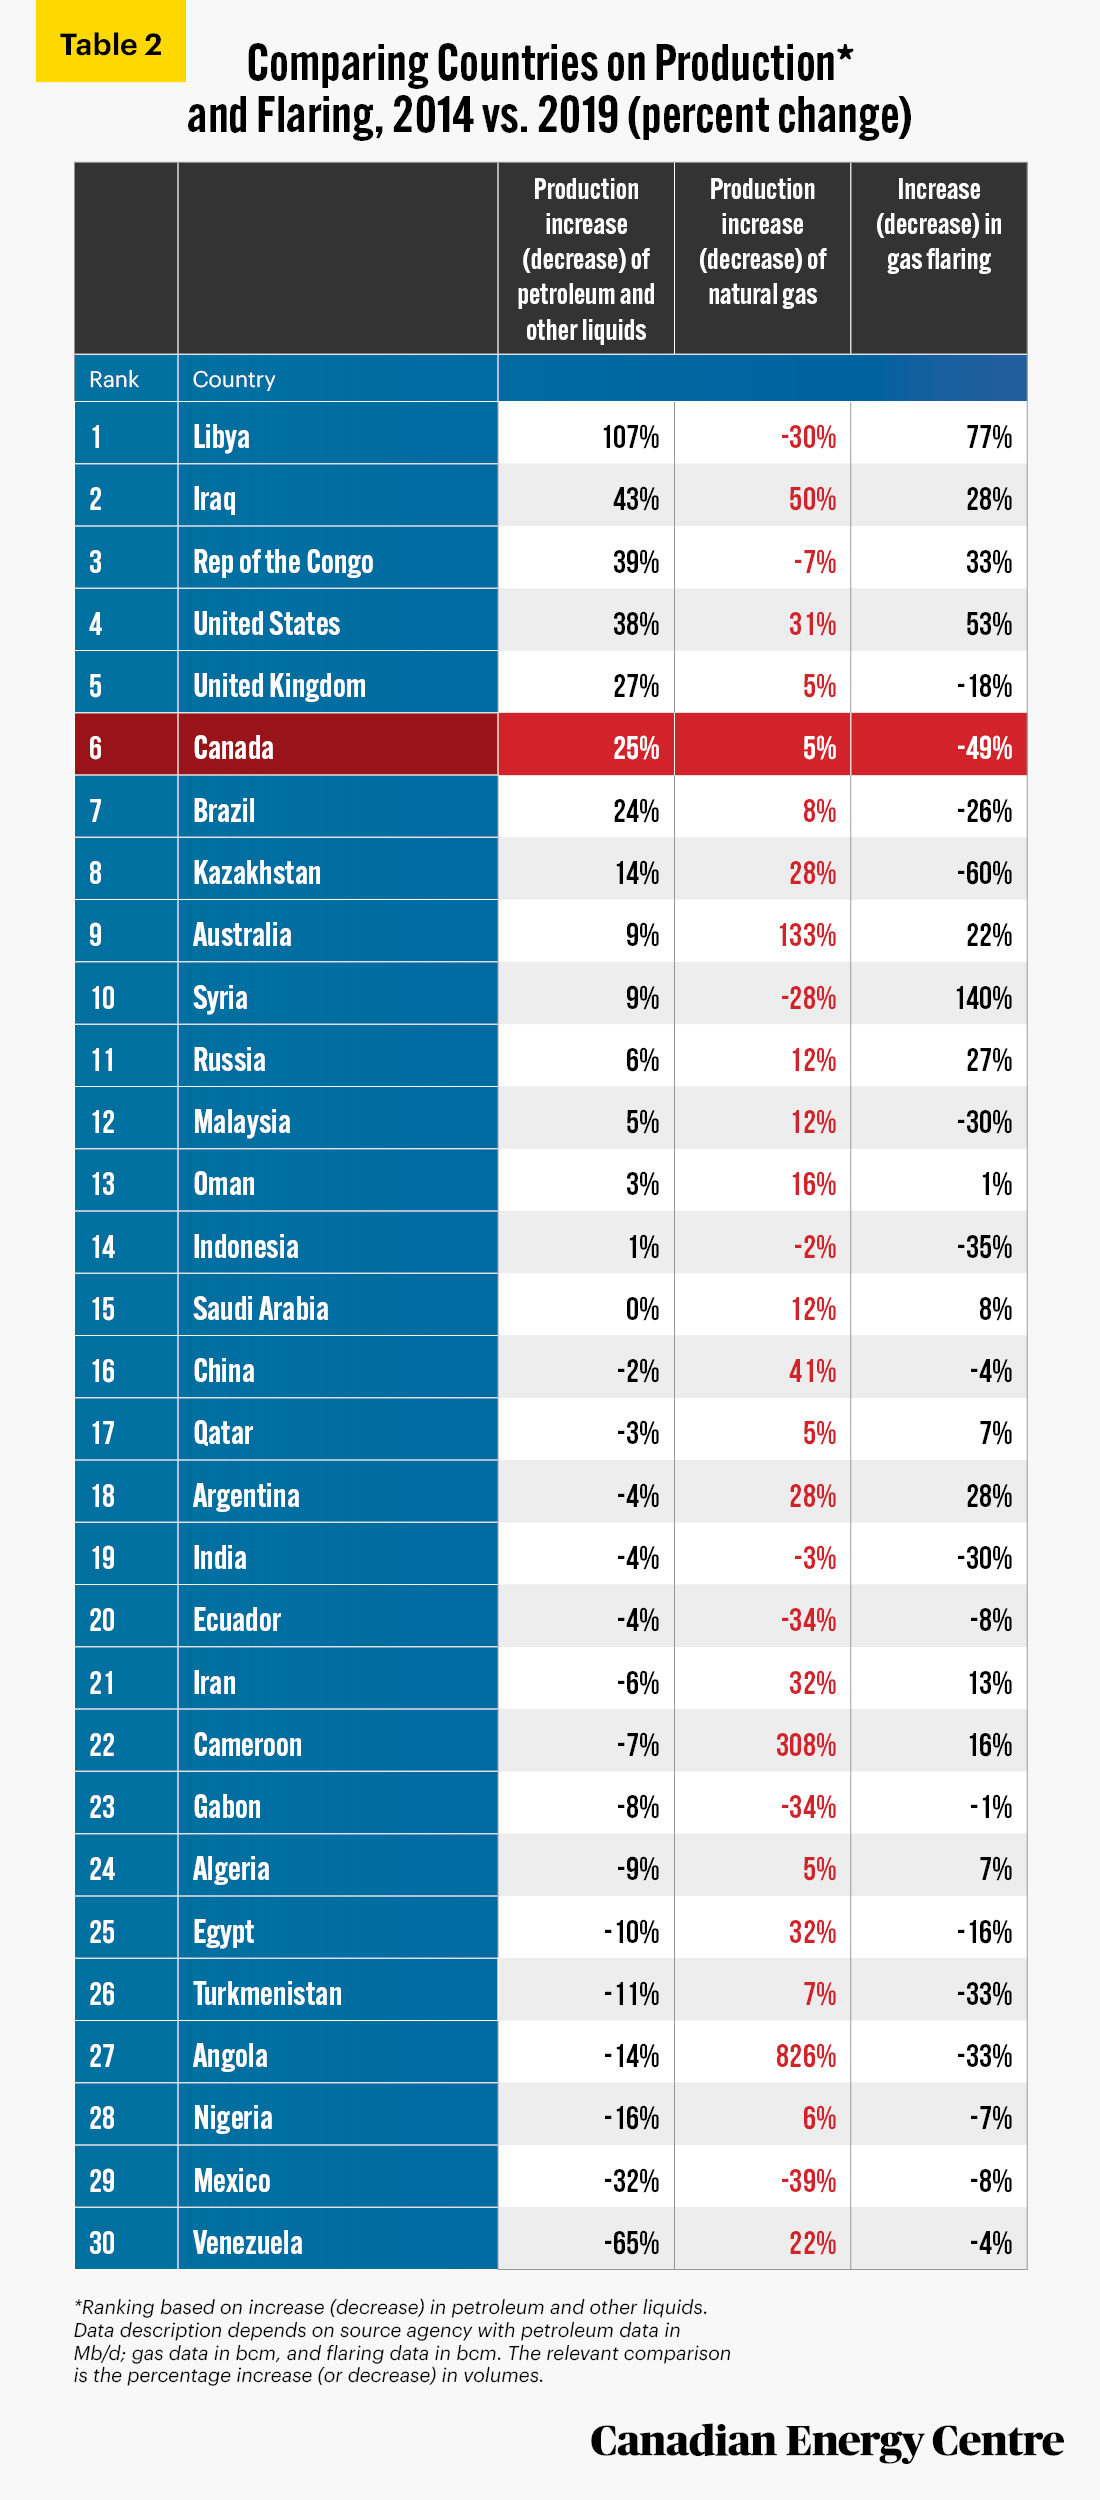
Sources: World Bank, US Energy Information Administration.
Tyranny Oil
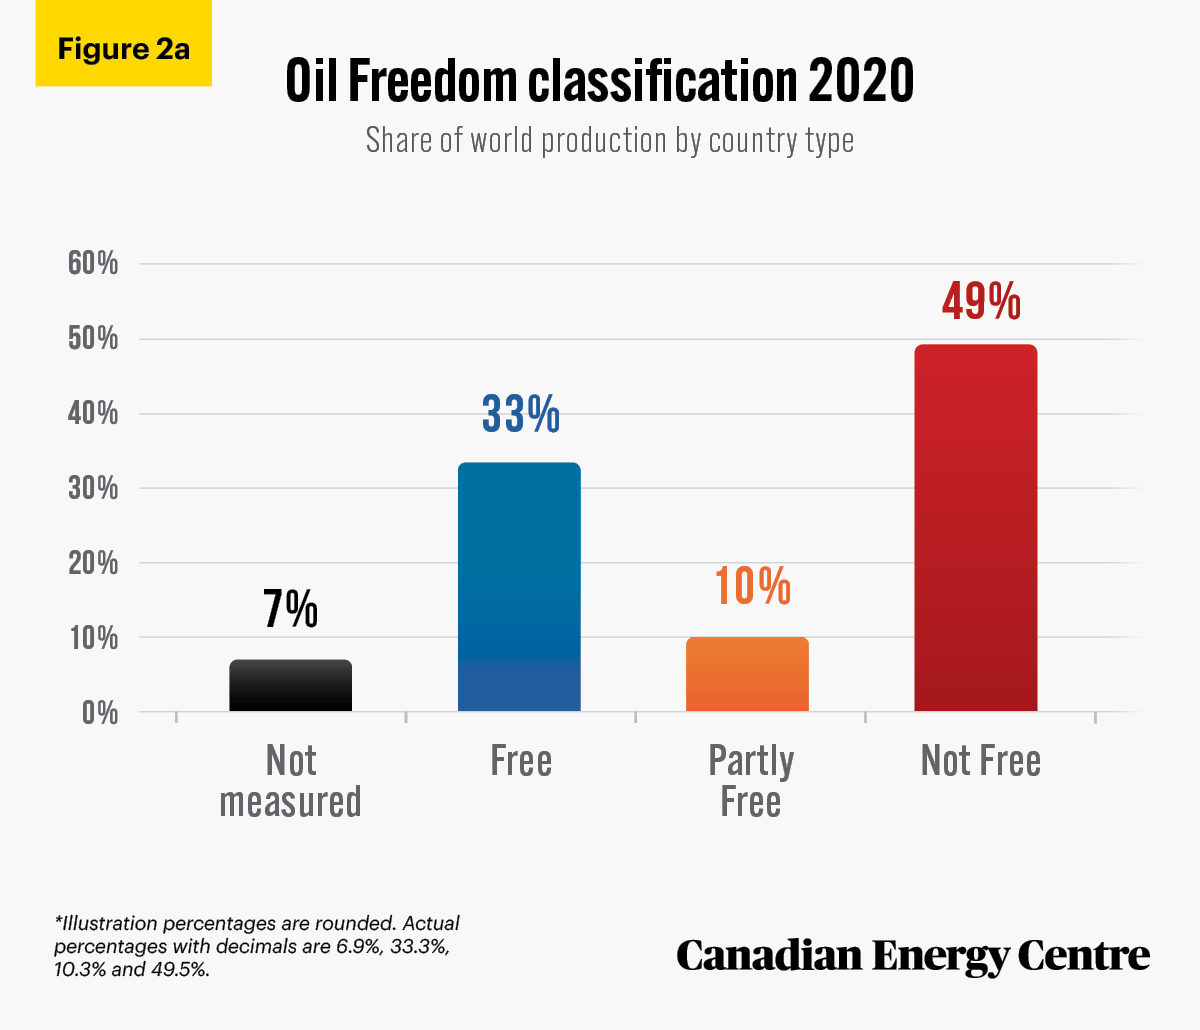
40.
In 2020, 49 per cent of the world’s oil production (an annual average of 46.6 million barrels per barrel) occurred in countries that Freedom House ranked as Not Free, compared with 33 per cent in Free countries and 10 per cent in Partly Free countries.
Sources: Freedom House (2021). Countries and Territory Ratings and Statuses, 1973-2021. U.S. Energy Information Administration (2021).
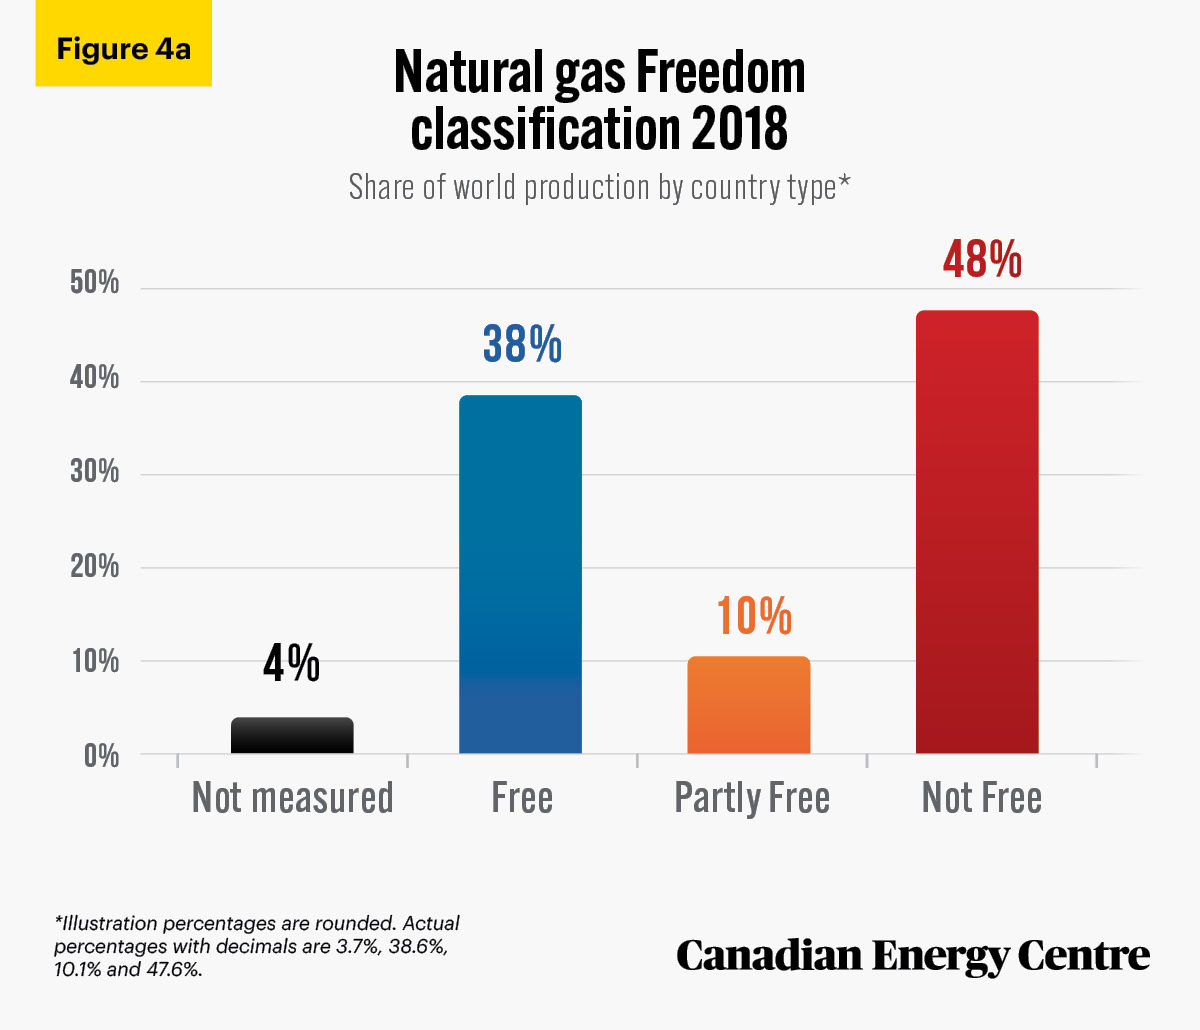
41.
In 2018, 48 per cent of the world’s natural gas production (an annual average of 56.6 billion cubic feet) occurred in countries that Freedom House ranked as Not Free, compared with 38 per cent in Free countries and 10 per cent in Partly Free countries.
Sources: Freedom House (2021). Countries and Territory Ratings and Statuses, 1973-2021. U.S. Energy Information Administration, International Statistics.
42.
By 2020, Not Free nations, including Saudi Arabia, Russia, China, the United Arab Emirates, Iran, Iraq, and others, produced 49 per cent of the world’s 94.2 million barrels of oil per day.
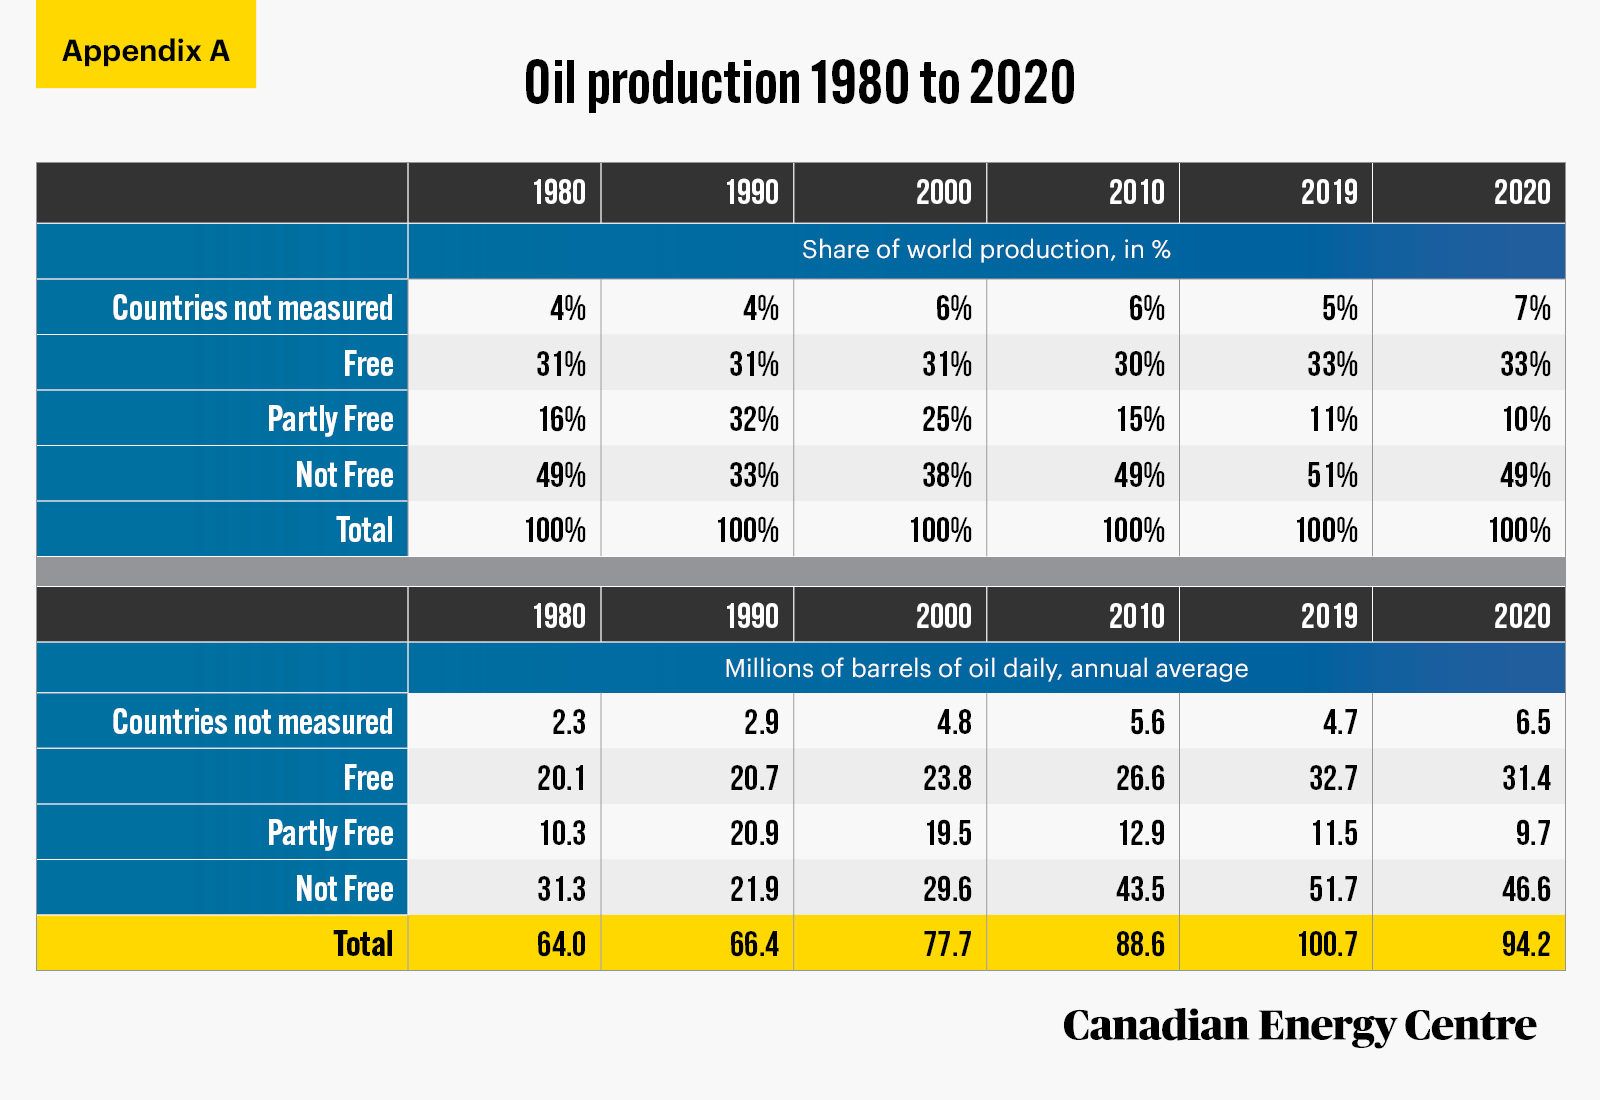
Sources: Freedom House (2021). Countries and Territory Ratings and Statuses, 1973-2021. U.S. Energy Information Administration (2021). Petroleum and other liquids production.
43.
Between 1980 and 2019, the proportion of the world’s natural gas production coming from Not Free nations increased from 36 per cent to 48 per cent, while the proportion from Partly Free nations increased from 5 per cent to 10 per cent.
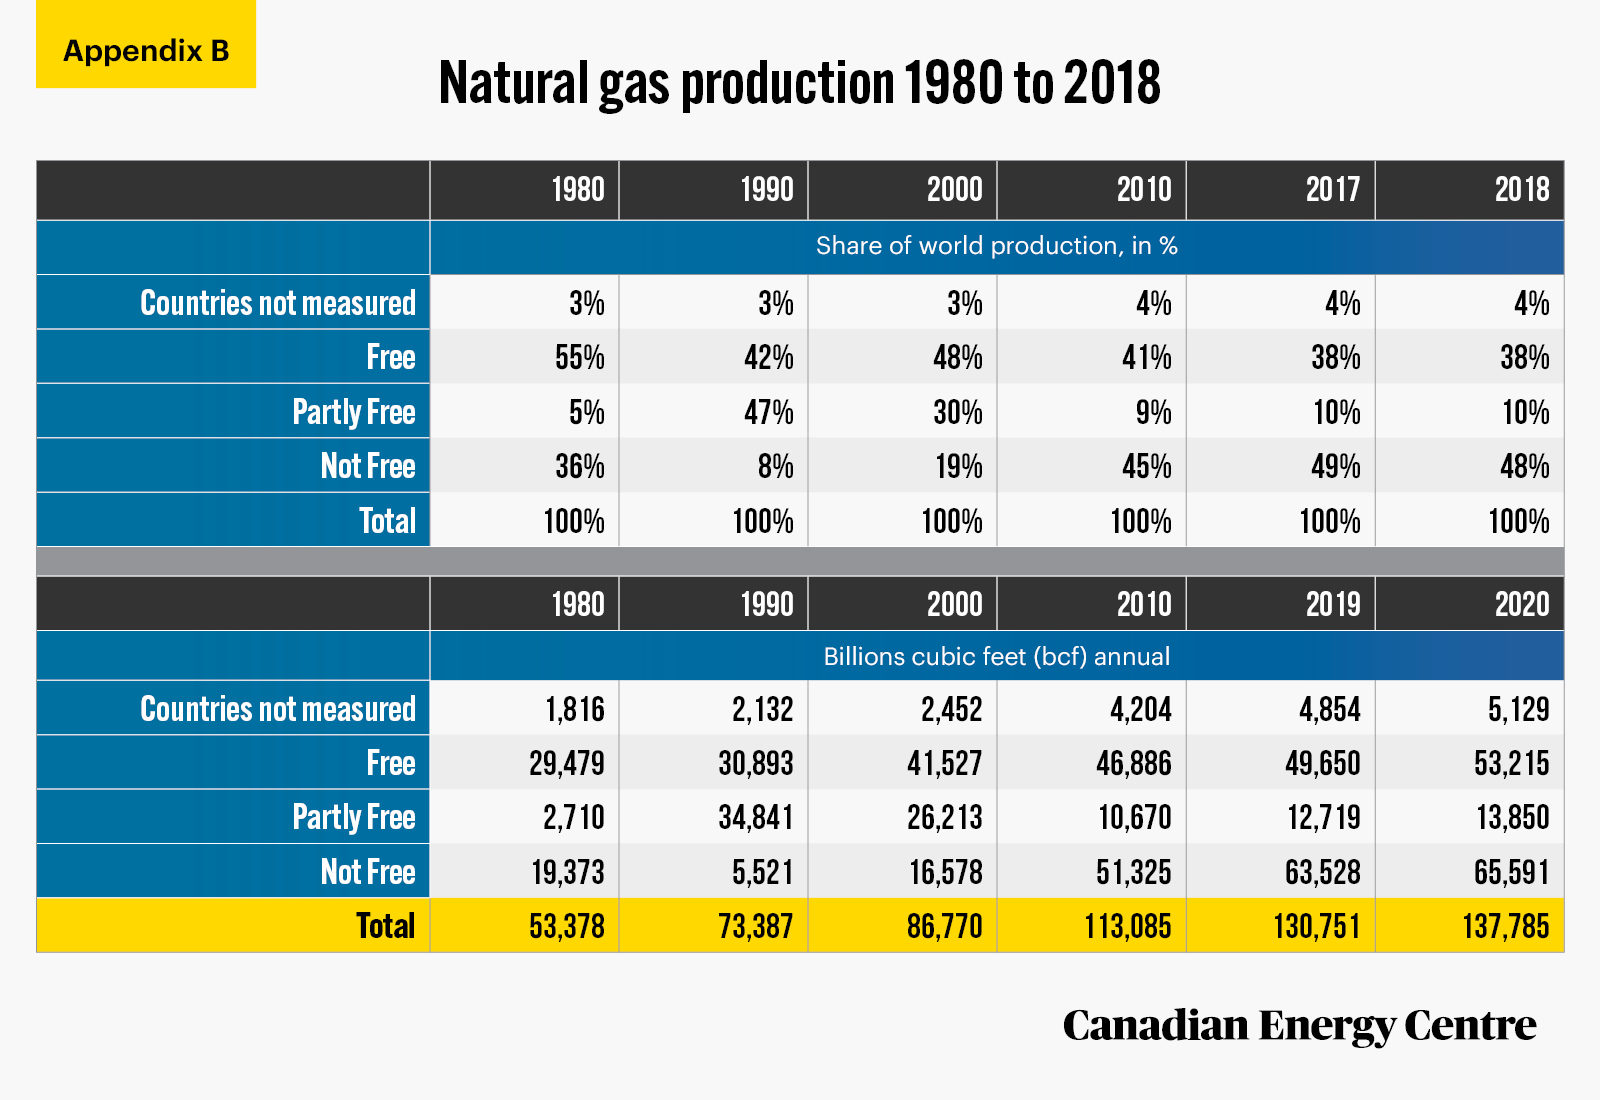
Sources: Freedom House (2021). Countries and Territory Ratings and Statuses, 1973-2021. U.S. Energy Information Administration, International Statistics.
Foreign Oil Imports
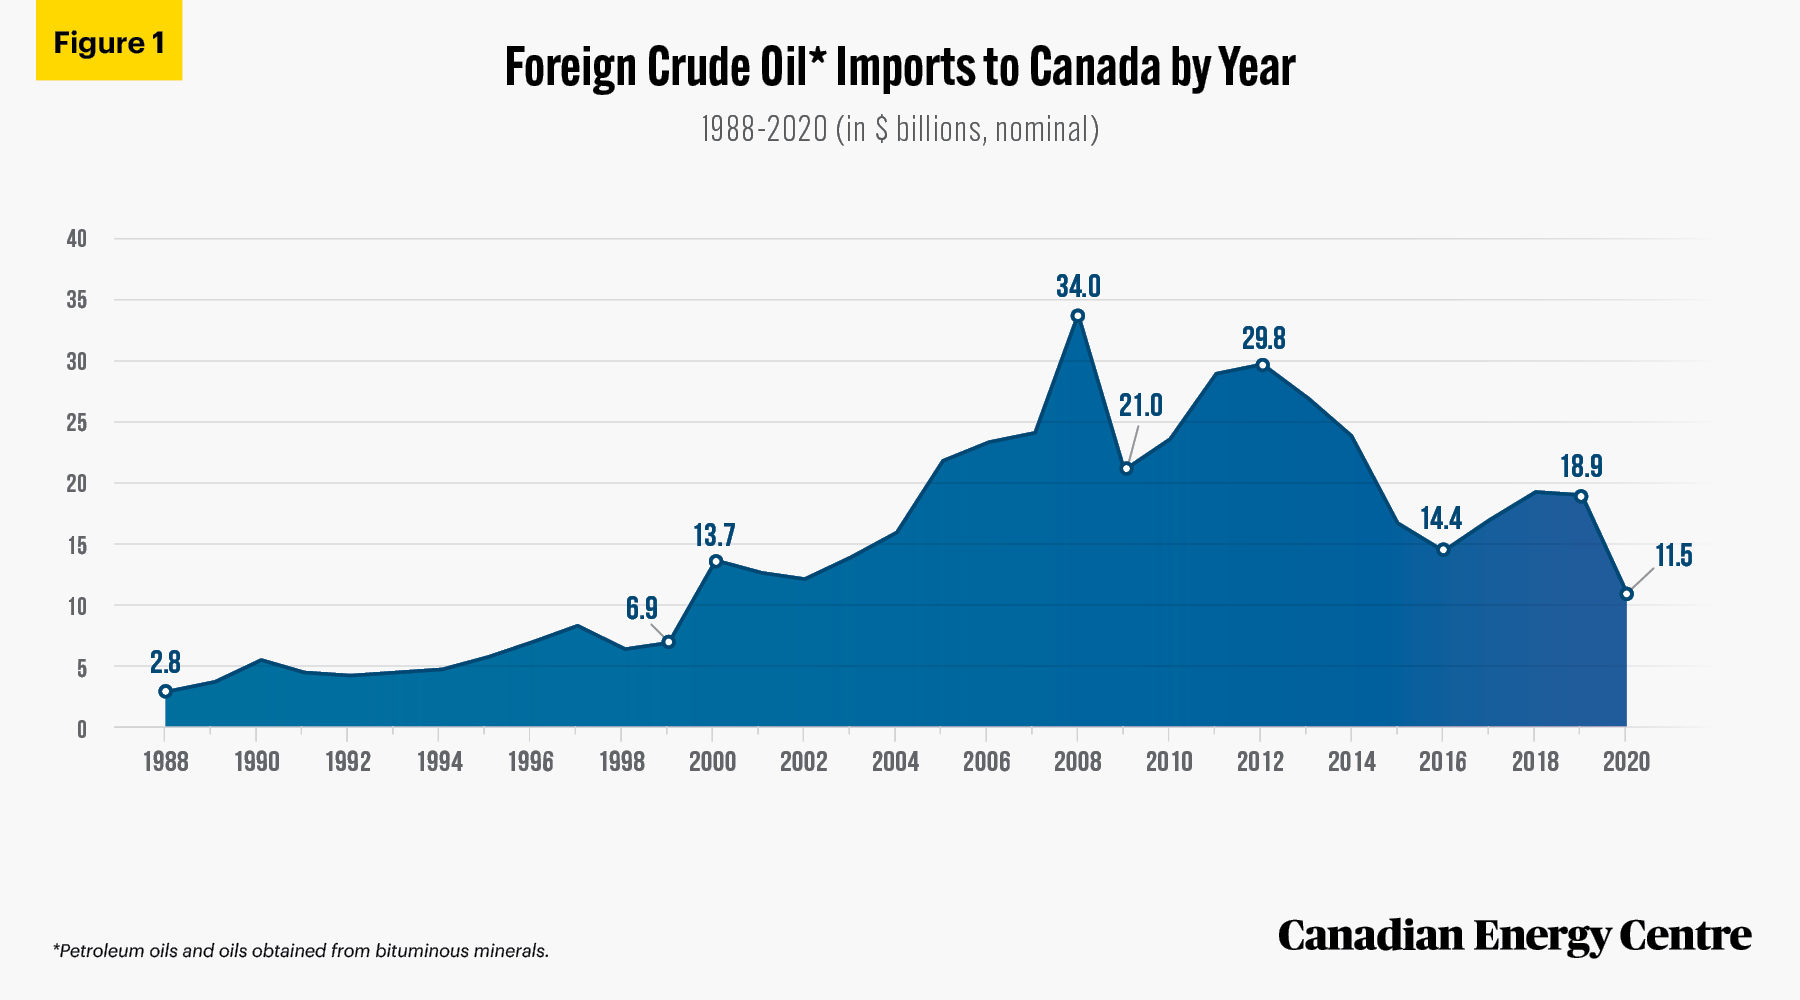
44.
Despite its vast oil and gas resources, Canada does import foreign oil. Between 1988 and 2020, Canada spent $488 billion ($604 billion in 2020 dollars) importing crude oil from such countries as Saudi Arabia, Iraq, Russia, Azerbaijan, Nigeria, Algeria, Angola, Venezuela, and Kazakhstan, as well as the United Kingdom, Norway and, more recently, the United States.
Source: Derived from Statistics Canada, Canadian International Merchandise Trade Database.
45.
Between 1988 and 2020, the five largest exporters of foreign crude oil to Canada were the United States ($94.6 billion), followed by Norway ($79.0 billion), the United Kingdom ($62.6 billion), Algeria ($58.4 billion), and Saudi Arabia ($44.4 billion).
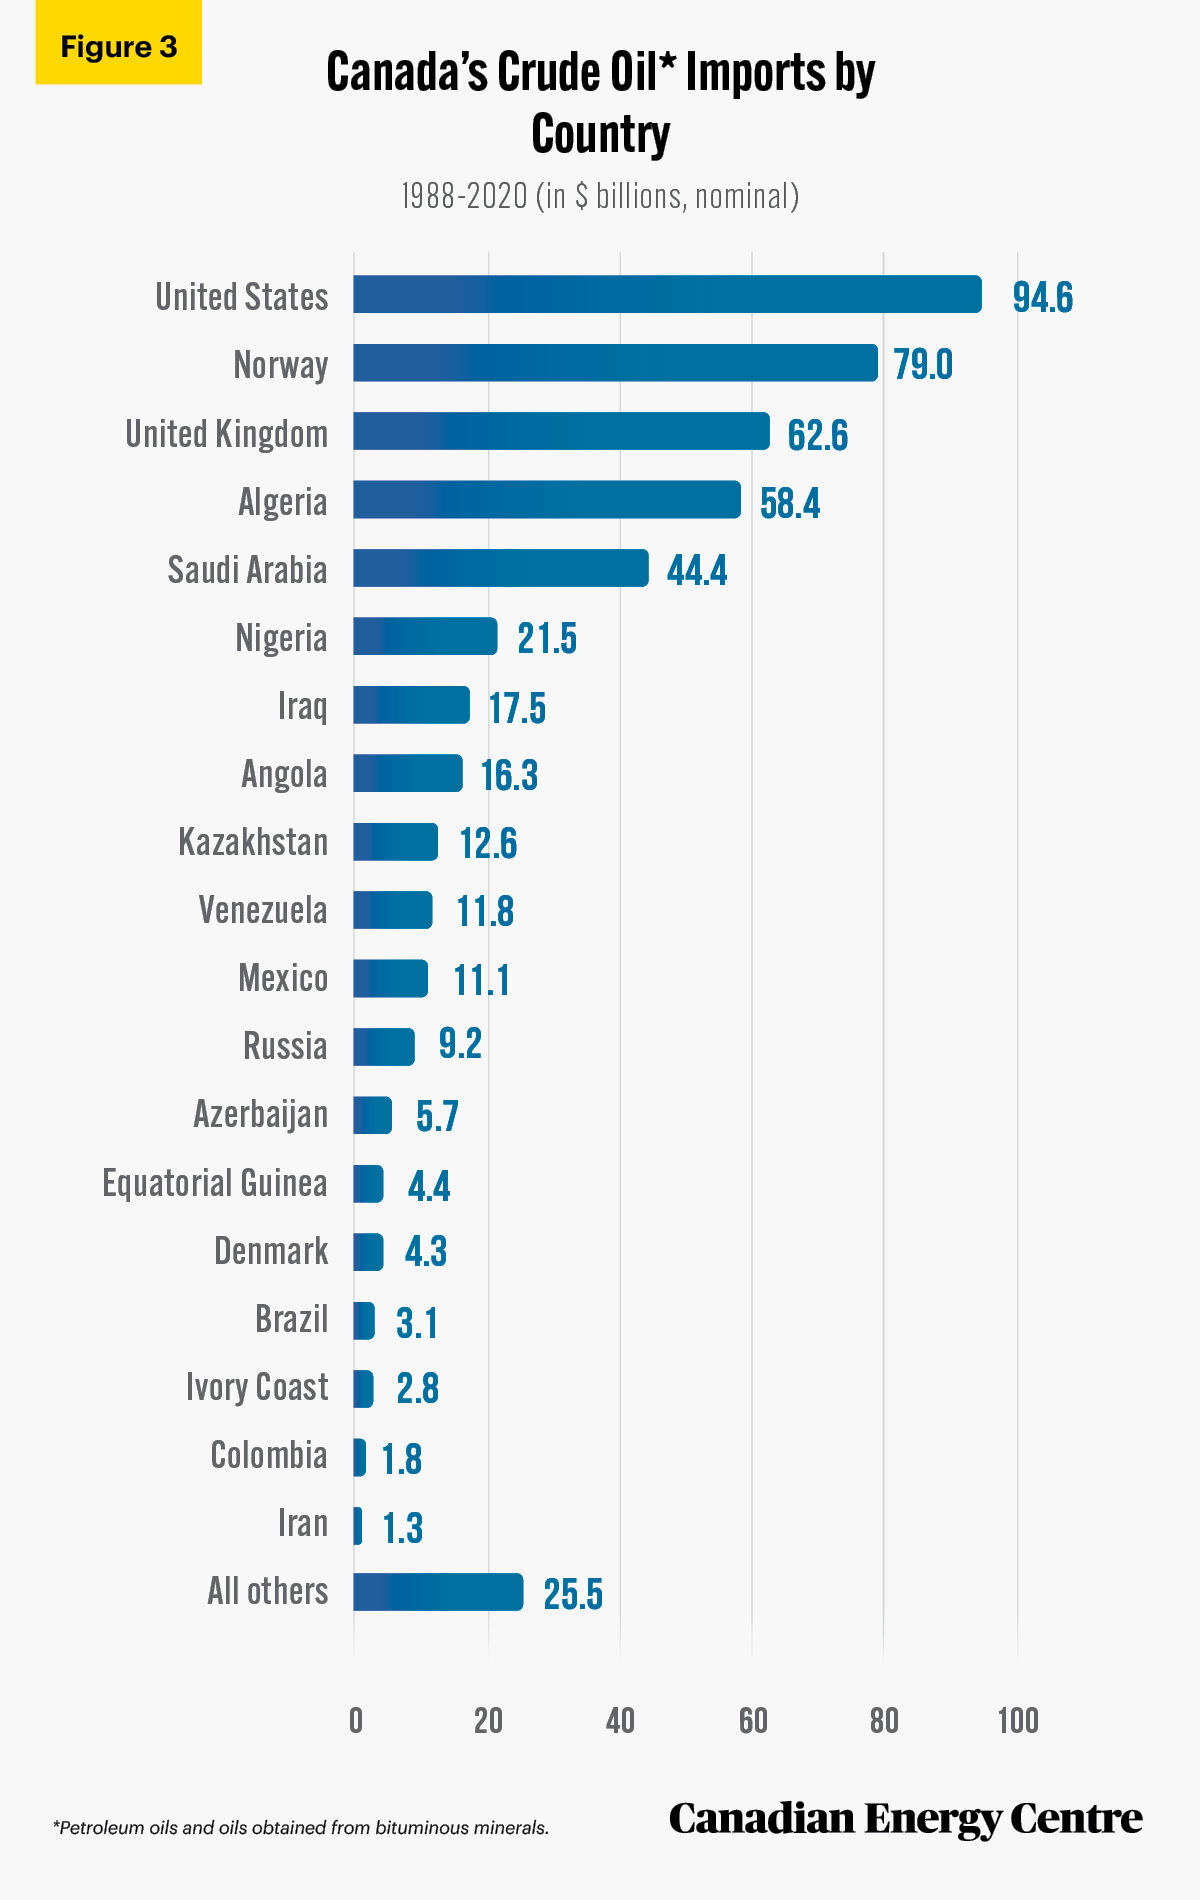
Source: Derived from Statistics Canada, Canadian International Merchandise Trade Database.
46.
Quebec imported $228.4 billion in foreign oil between 2000 and 2020, more than any other province.
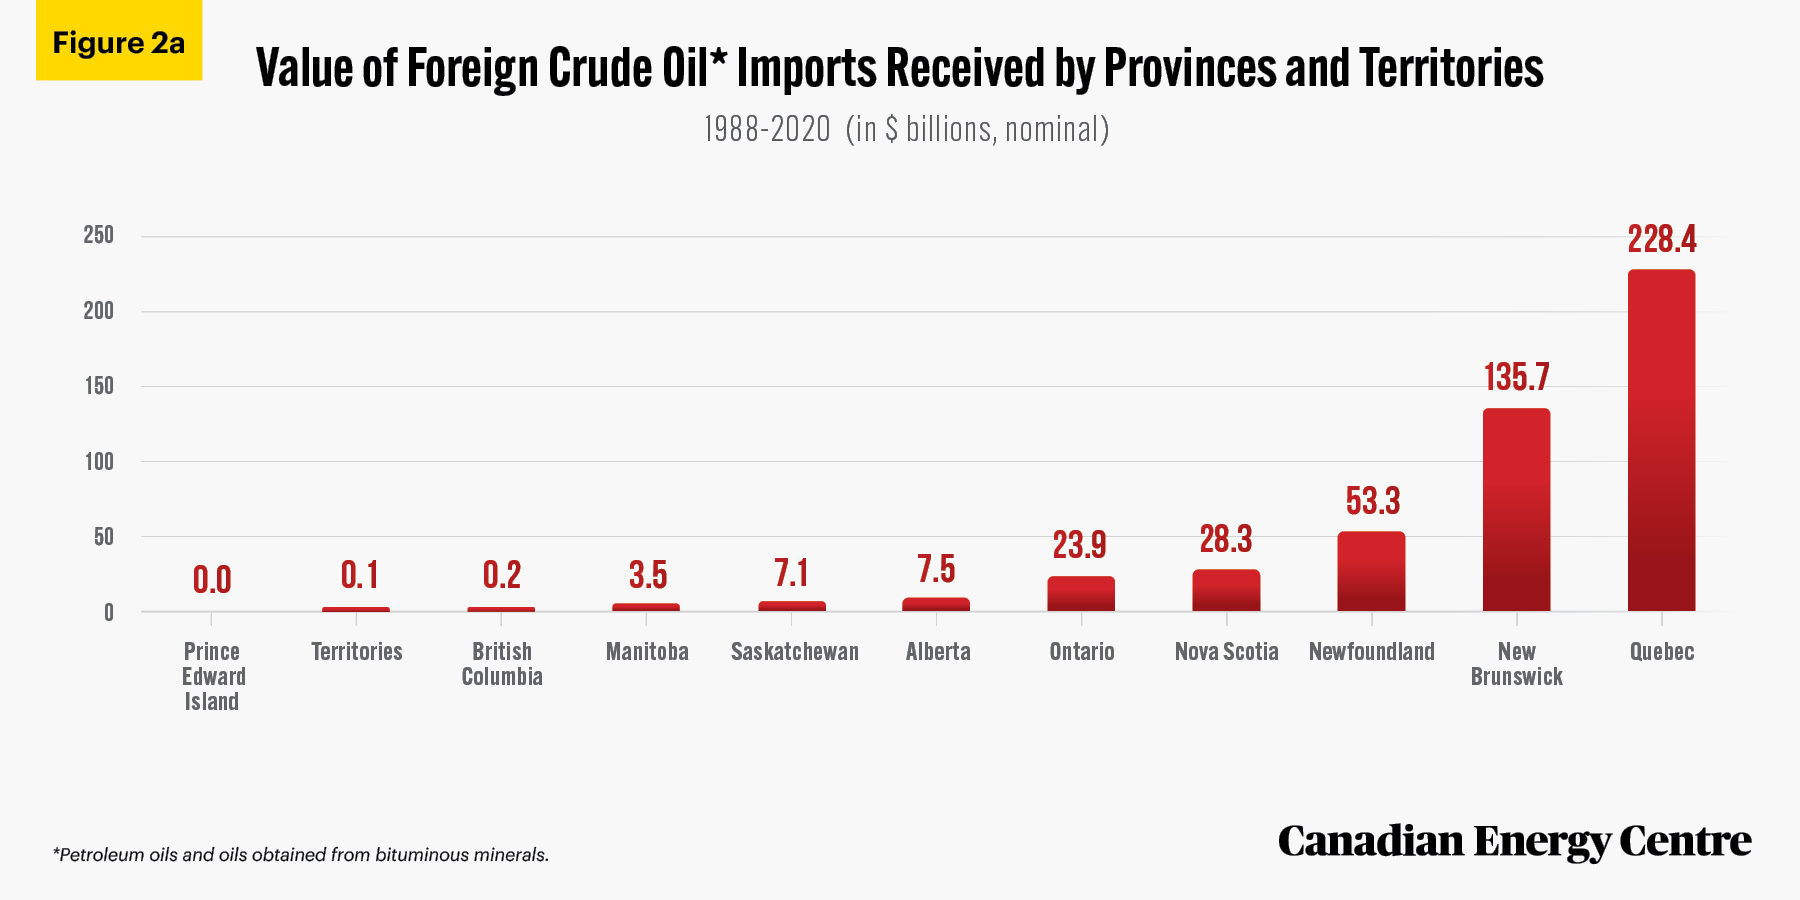
Source: Derived from Statistics Canada, Canadian International Merchandise Trade Database.
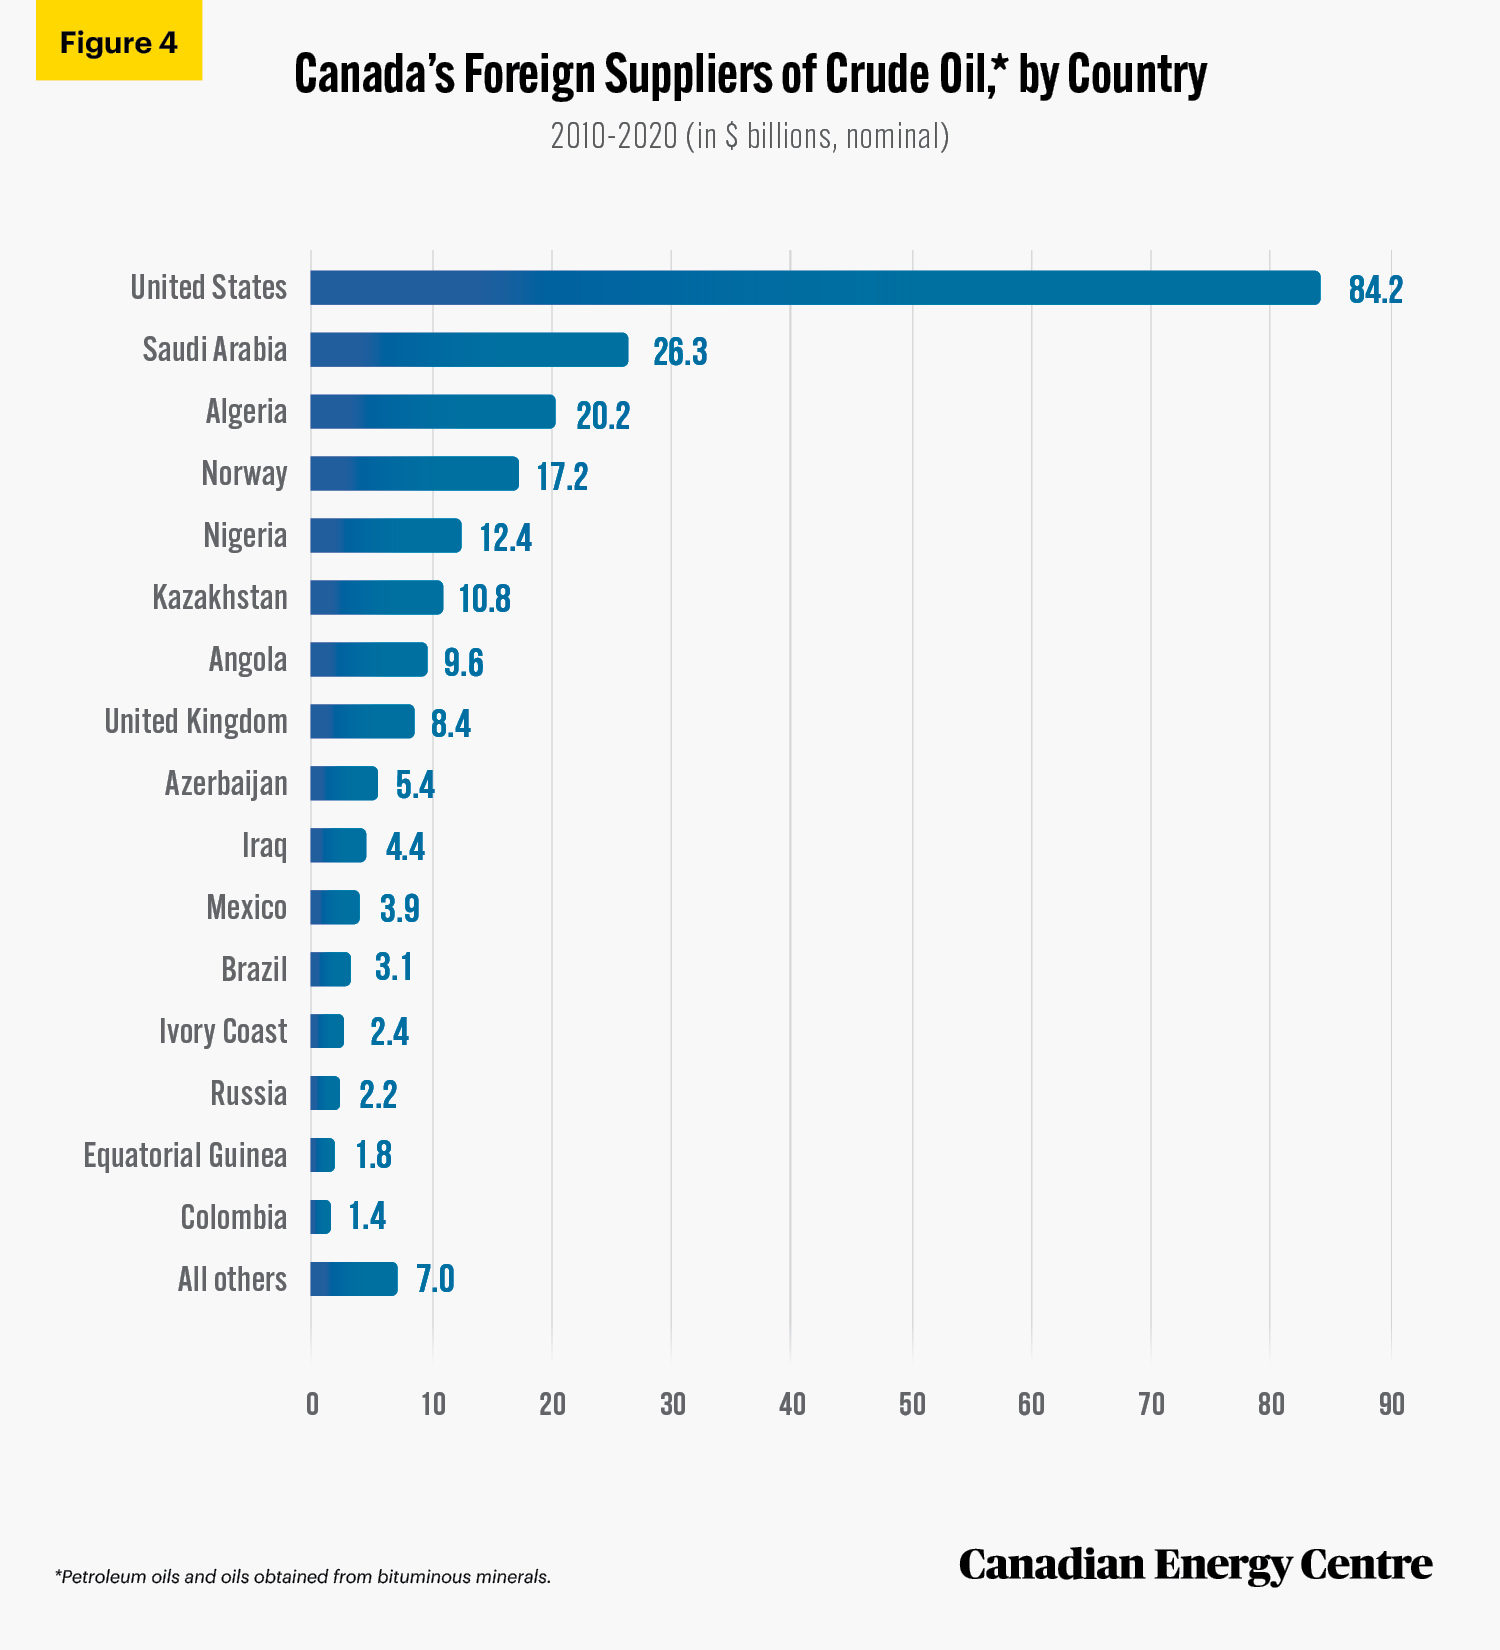
47.
Between 2010 and 2020, Canada’s oil imports were worth a total of $231.1 billion. U.S. oil imports accounted for nearly $84.2 billion, followed by imports from Saudi Arabia at $26.3 billion. That is over $110 billion in foreign oil imported to Canada from those two countries alone in that decade.
International Merchandise Trade Database.
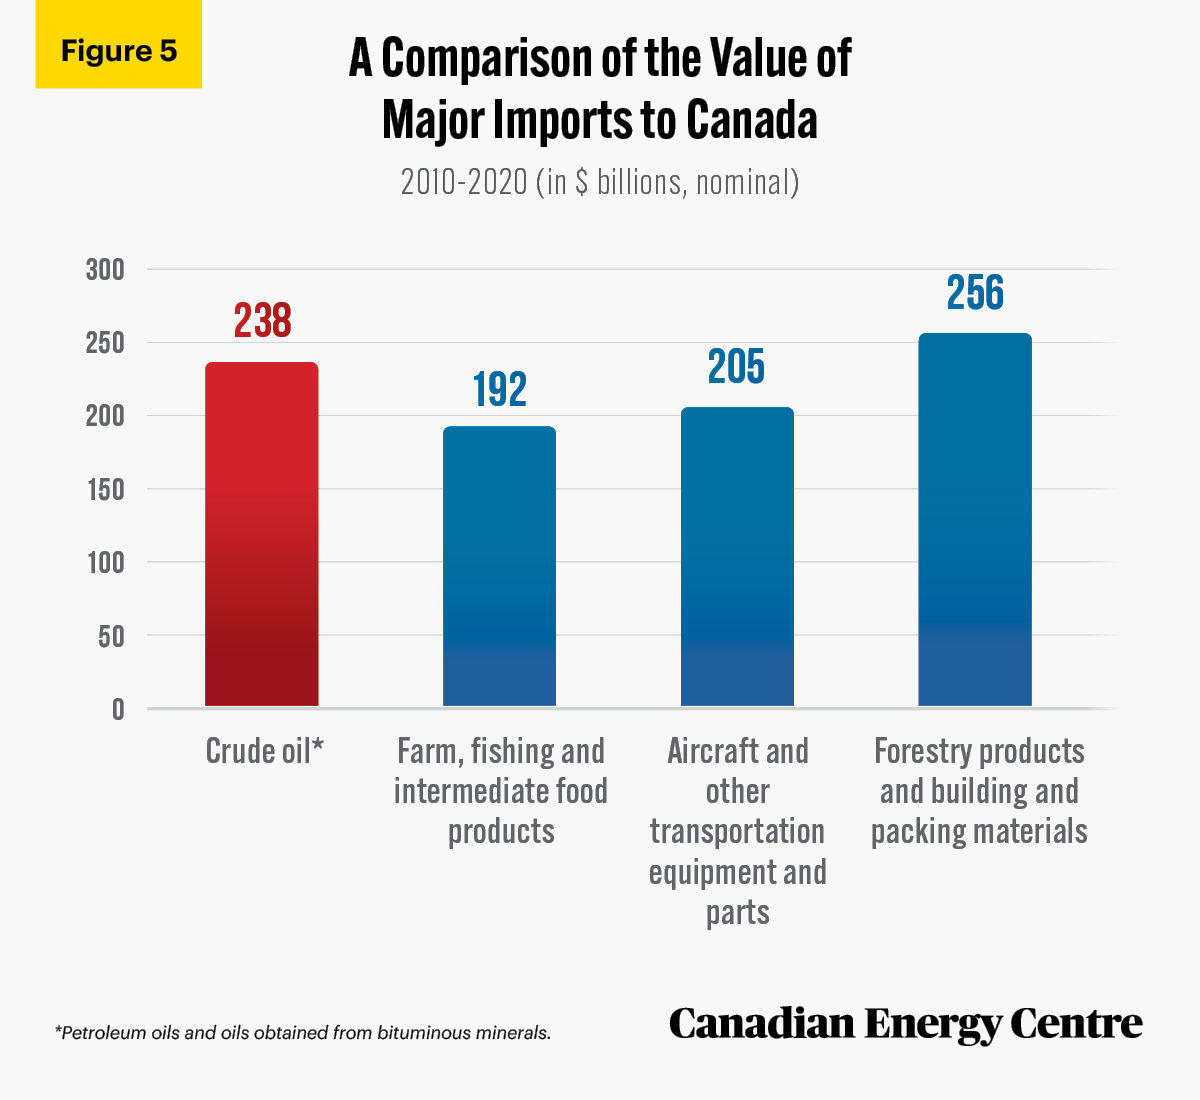
48.
Canada spent nearly $238 billion on crude oil imports between 2010 and 2020. This is:
- Higher than the almost $192 billion Canada spent on farm, fishing, and intermediate food products imports;
- Higher than the nearly $205 billion Canada spent on aircraft and other transportation equipment and parts imports; and
- Just below the $256 billion Canada spent on forestry products and building and packaging materials imports.
Source: Derived from Statistics Canada, Canadian International Merchandise Trade Database
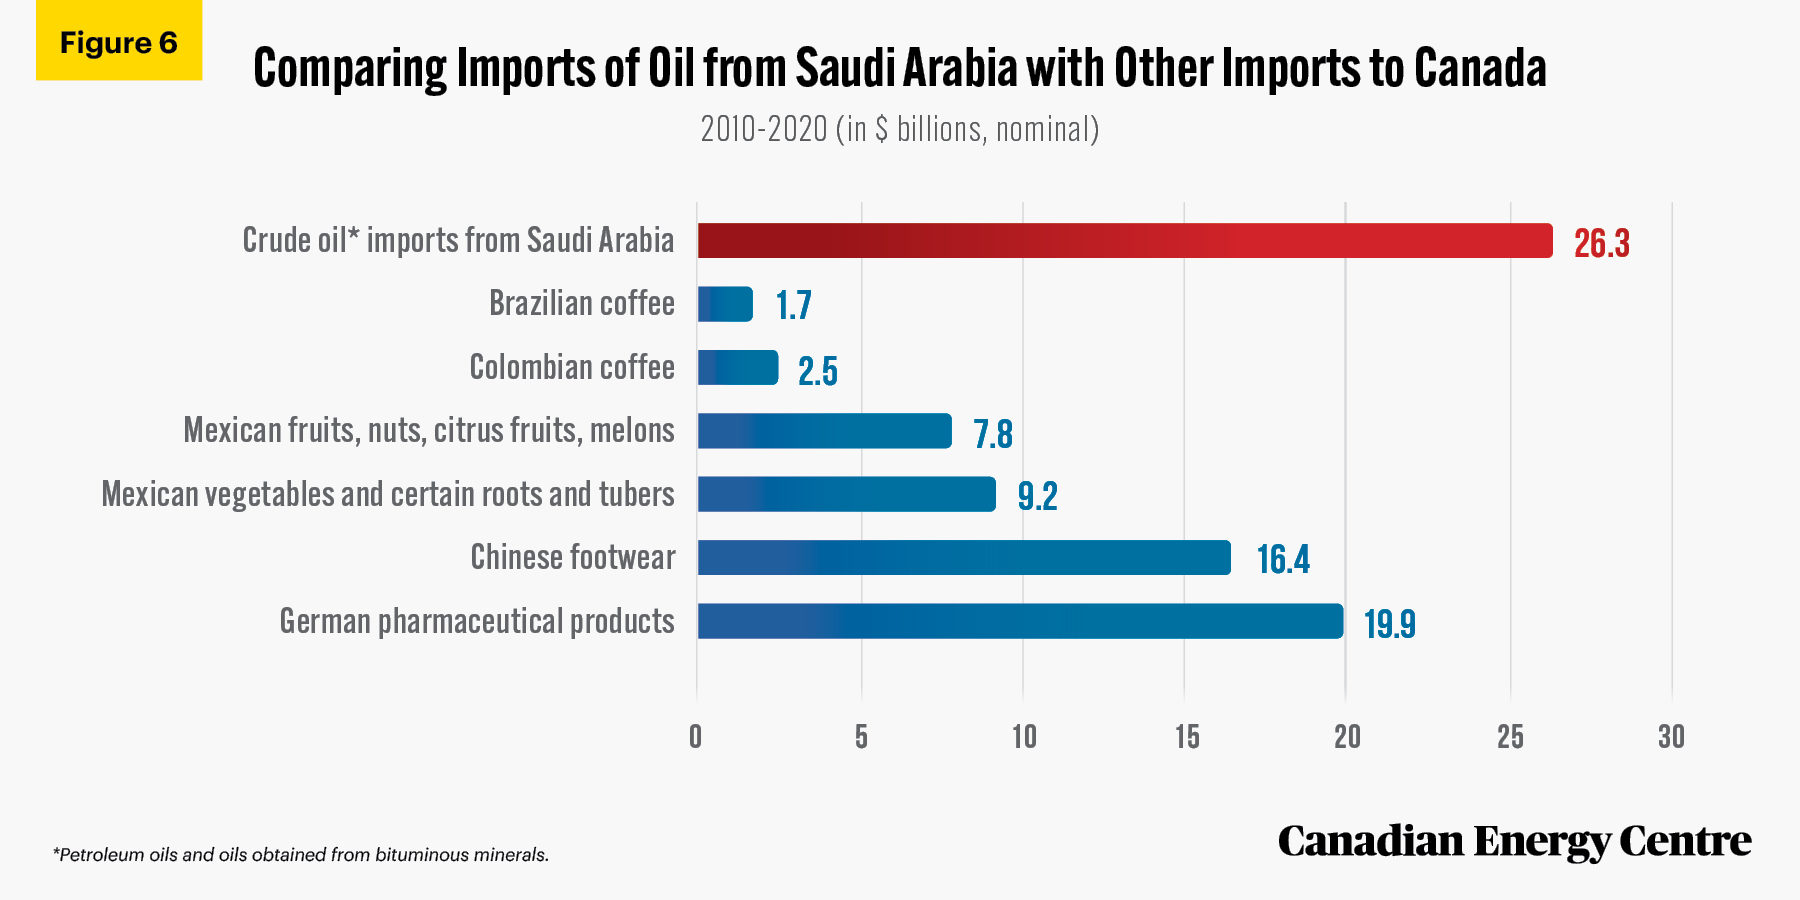
49.
Between 2010 and 2020, Canada spent over $26.3 billion on crude oil imported from Saudi Arabia. This $26.3 billion expenditure is larger than the:
- $1.7 billion Canada spent importing coffee from Brazil;
- $2.5 billion Canada spent importing coffee from Colombia;
- $7.8 billion Canada spent importing fruits, nuts, citrus fruits, and melons from Mexico;
- $9.2 billion Canada spent importing edible vegetables and certain roots and tubers from Mexico;
- $16.4 billion Canada spent importing footwear from China; and
- $19.9 billion Canada spent importing pharmaceutical products from Germany.
Source: Derived from Statistics Canada, Canadian International Merchandise Trade Database
50.
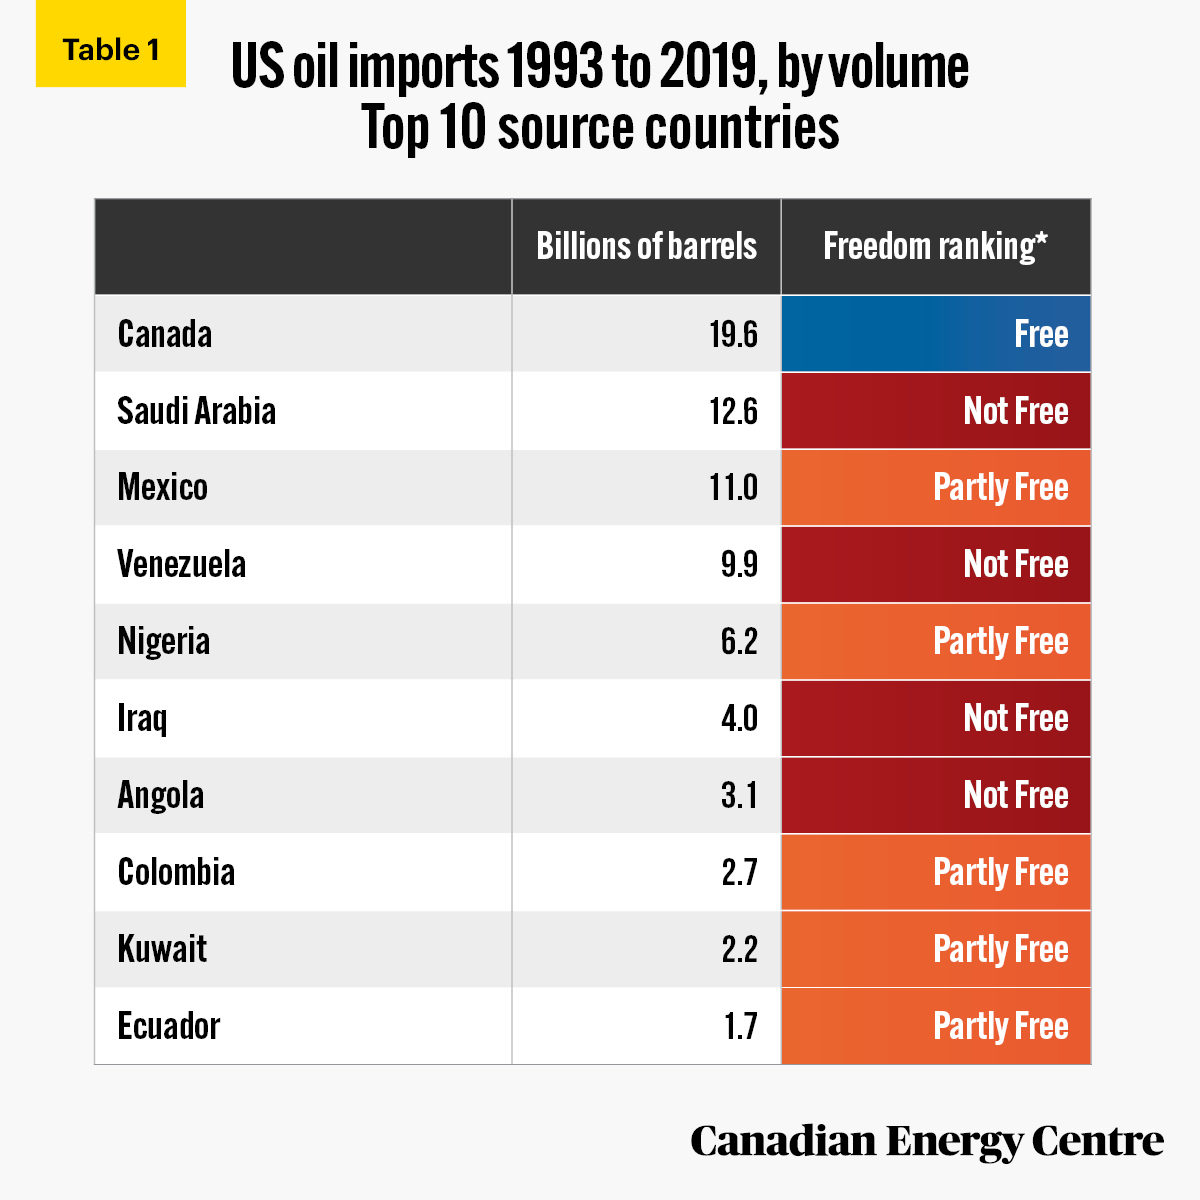
In nearly three decades (1993-2019), the U.S. has imported over 84 billion barrels of foreign crude oil, an average of over 3.1 billion barrels per year.
51.
U.S. foreign crude oil imports between 1993 and 2019 were highest from Canada (19.6 billion barrels or 23.3 per cent of the total), followed by Saudi Arabia (12.6 billion barrels or 15 per-cent), and Mexico (11 billion barrels or 13.1 per cent).
52.
Of all U.S. foreign crude oil imports, 29.3 per cent came from countries designated as Free, with 29.2 per cent from Partly Free countries and 41.5 per cent from Not Free countries.
Sources: US Energy Information Administration and Freedom House.
53.
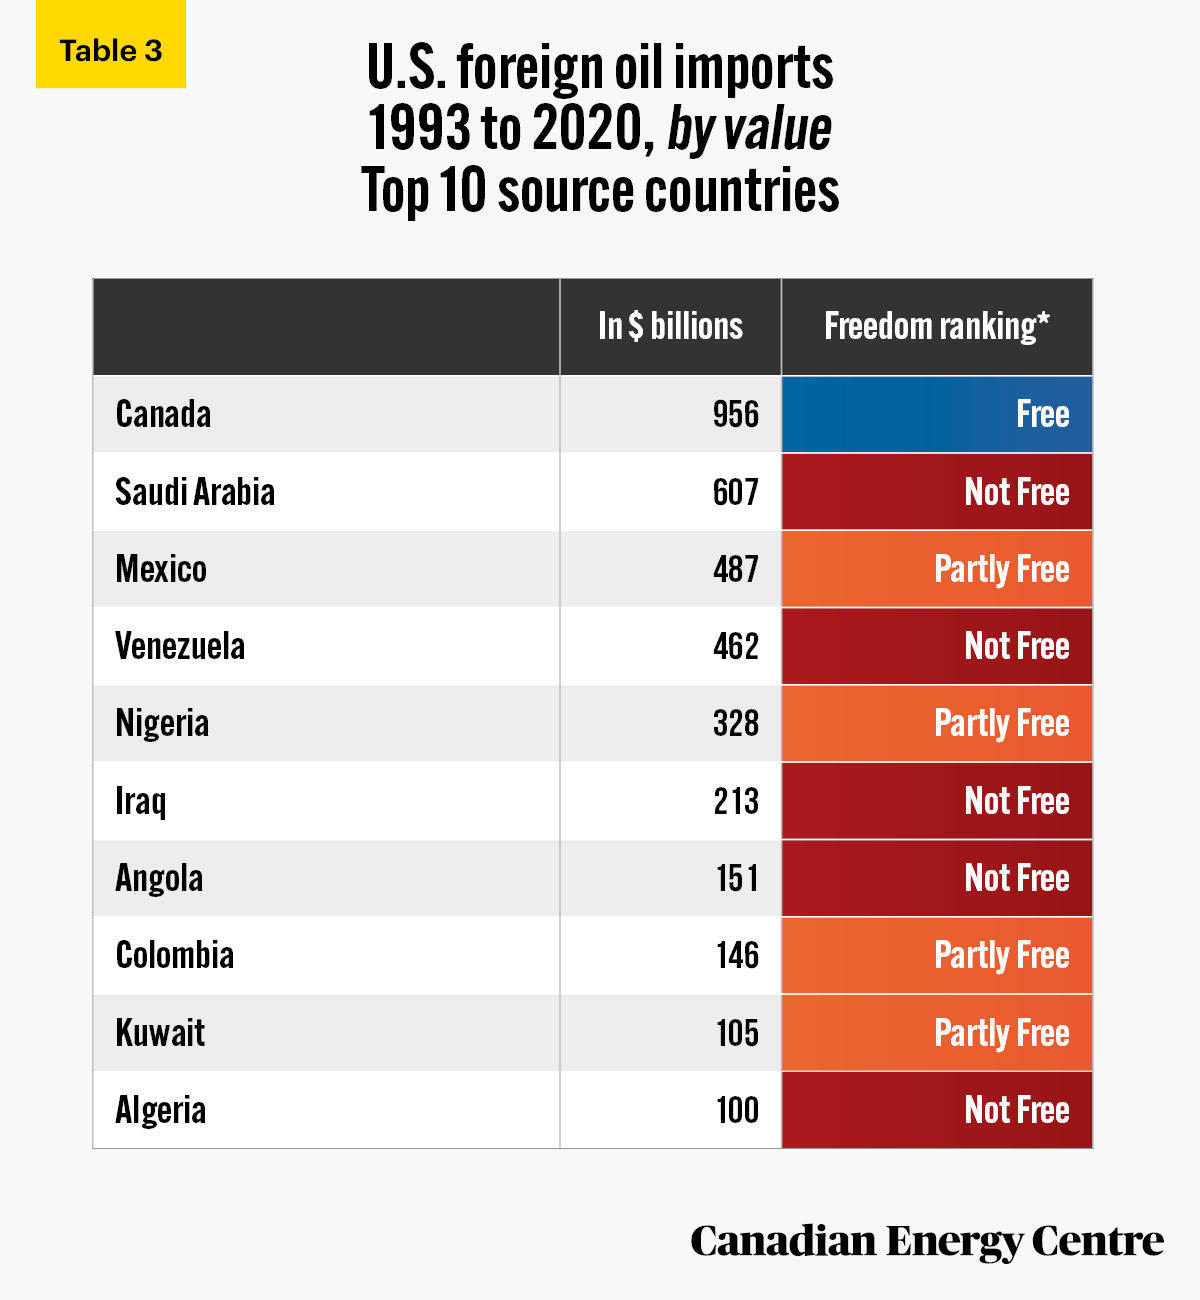
In almost three decades (1993-2020), the U.S. has imported nearly $4.2 trillion of foreign crude oil, an average of over $148 billion per year.
54.
U.S. foreign crude oil imports between 1993 and 2020 were highest from Canada ($956 billion or 23 per cent of the total), followed by Saudi Arabia ($607 billion or 14.6 per cent), and Mexico ($487 billion or 11.7 per cent).
Sources: US Energy Information Administration and Freedom House
55.
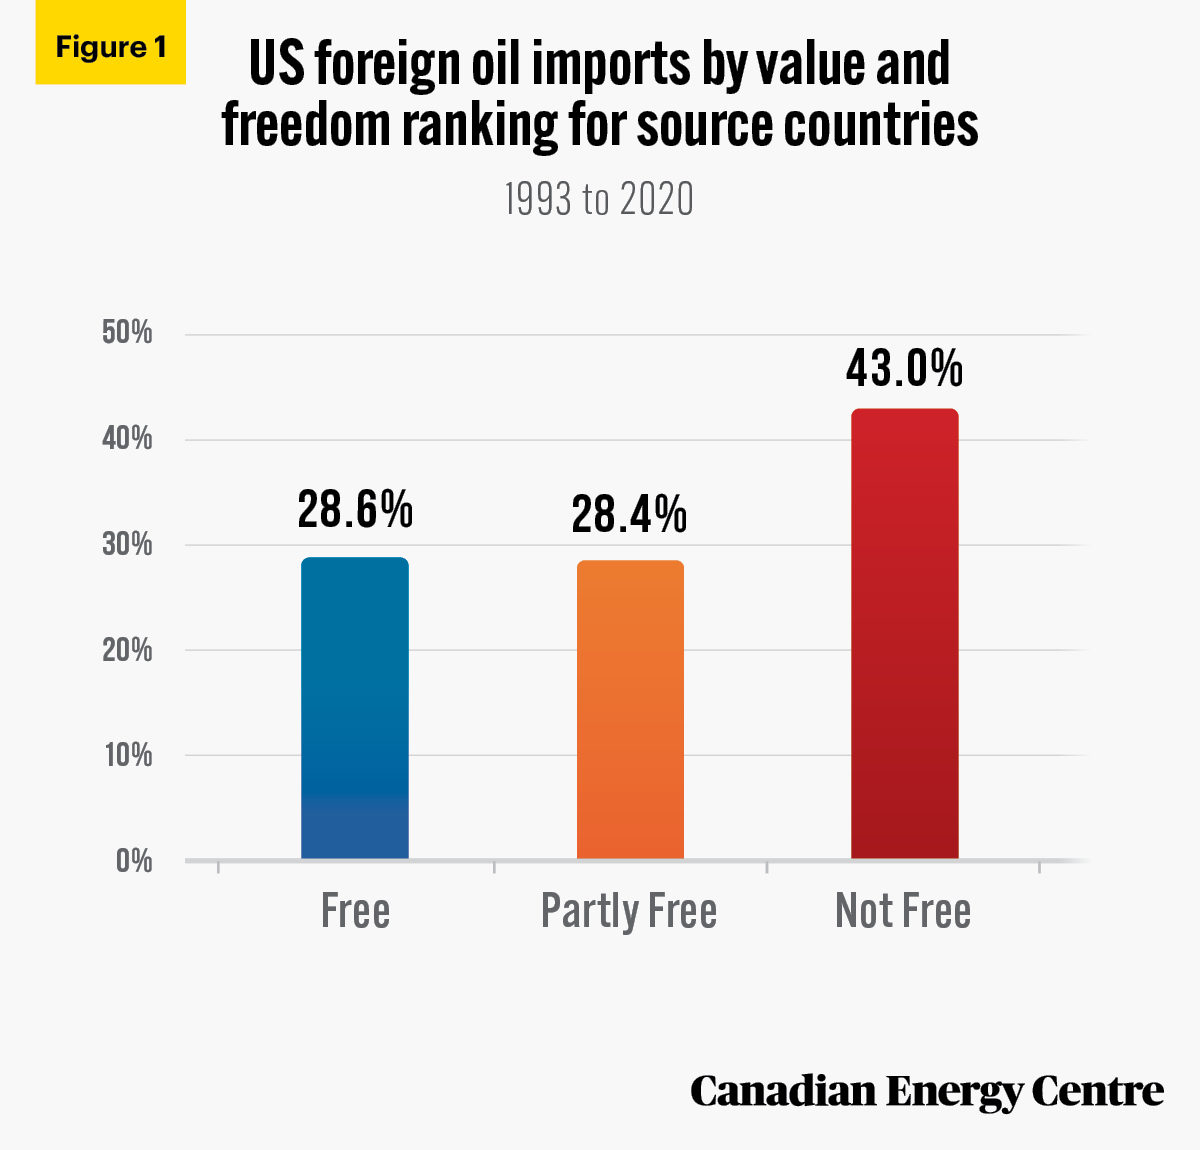
U.S. foreign crude oil imports from Not Free countries were nearly $1.8 trillion or 43 per cent of total U.S. foreign crude oil imports between 1993 and 2020.
Sources: US Census Bureau and Freedom House.
56.
Just under $1.2 trillion of U.S. foreign oil came from Partly Free countries (28.4 per cent) with just over $1.2 trillion (28.6 per cent) from Free countries.
Sources: US Census Bureau and Freedom House.
57.
In the past 15 years (2005-2019), the EU has imported 61.5 billion barrels of foreign crude oil, an average of over 4 billion barrels a year, which is worth over €4.6 trillion on an extra- and intra-EU basis, or nearly CAD$6.9 trillion.
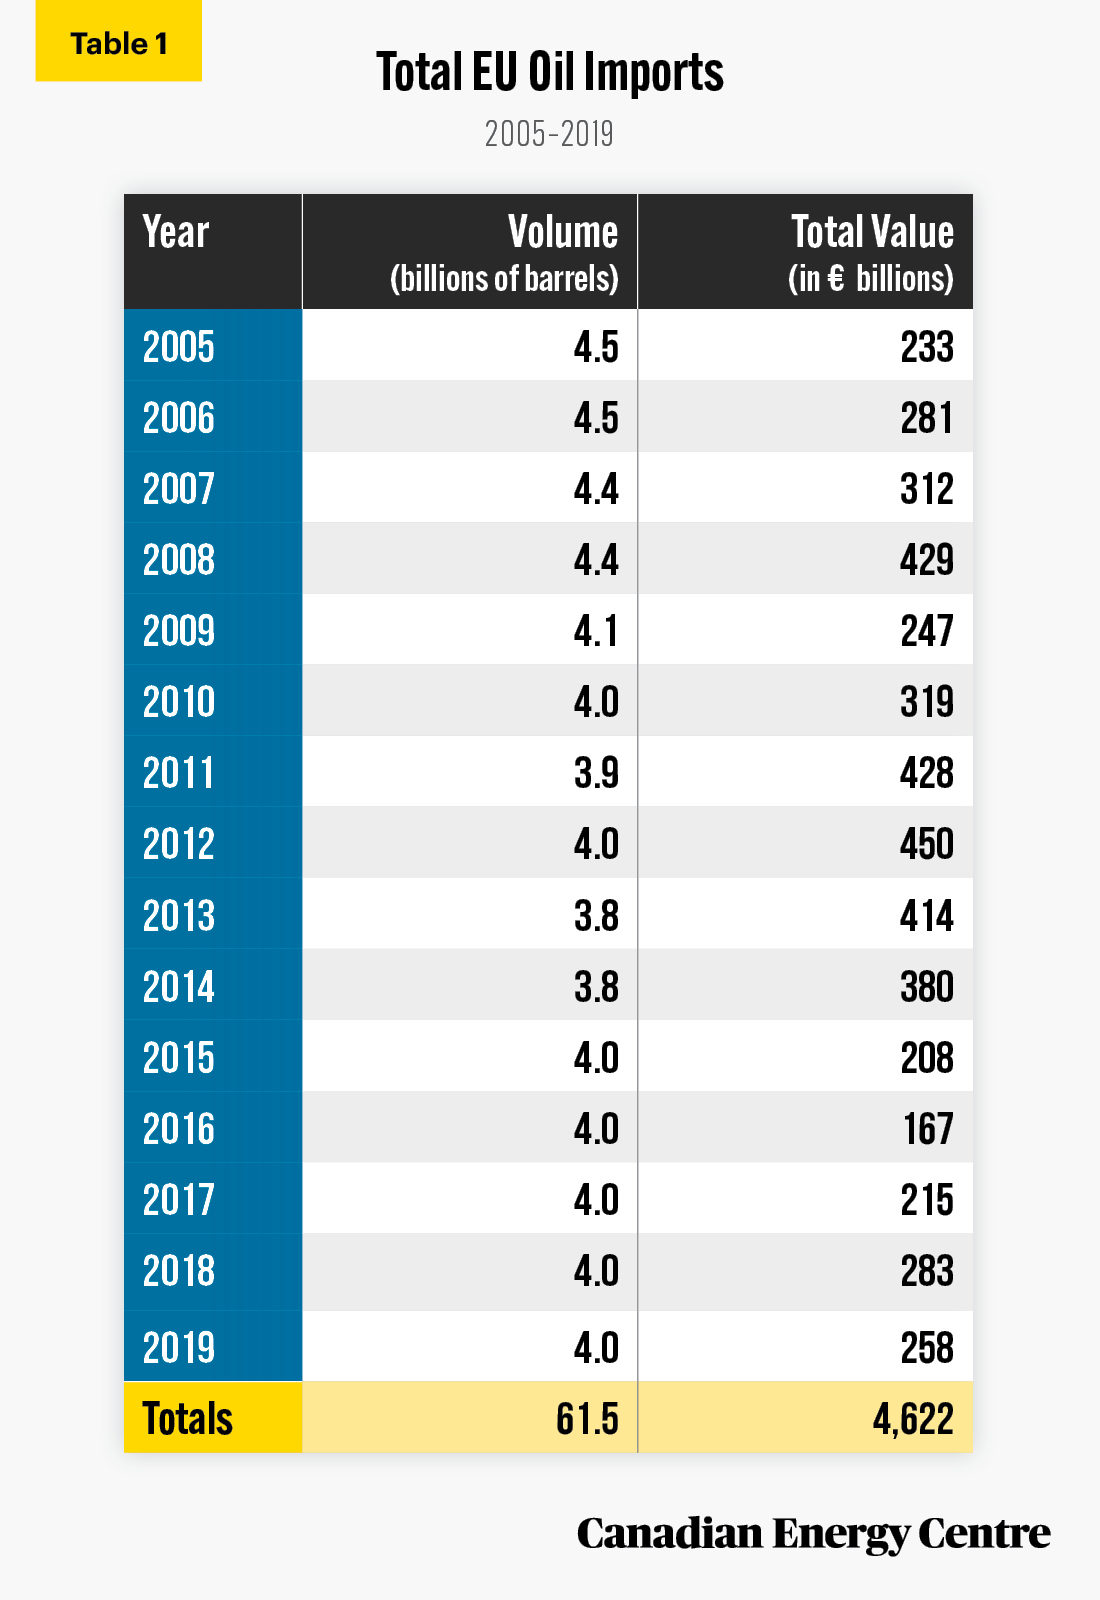
Source: European Commission, 2021.
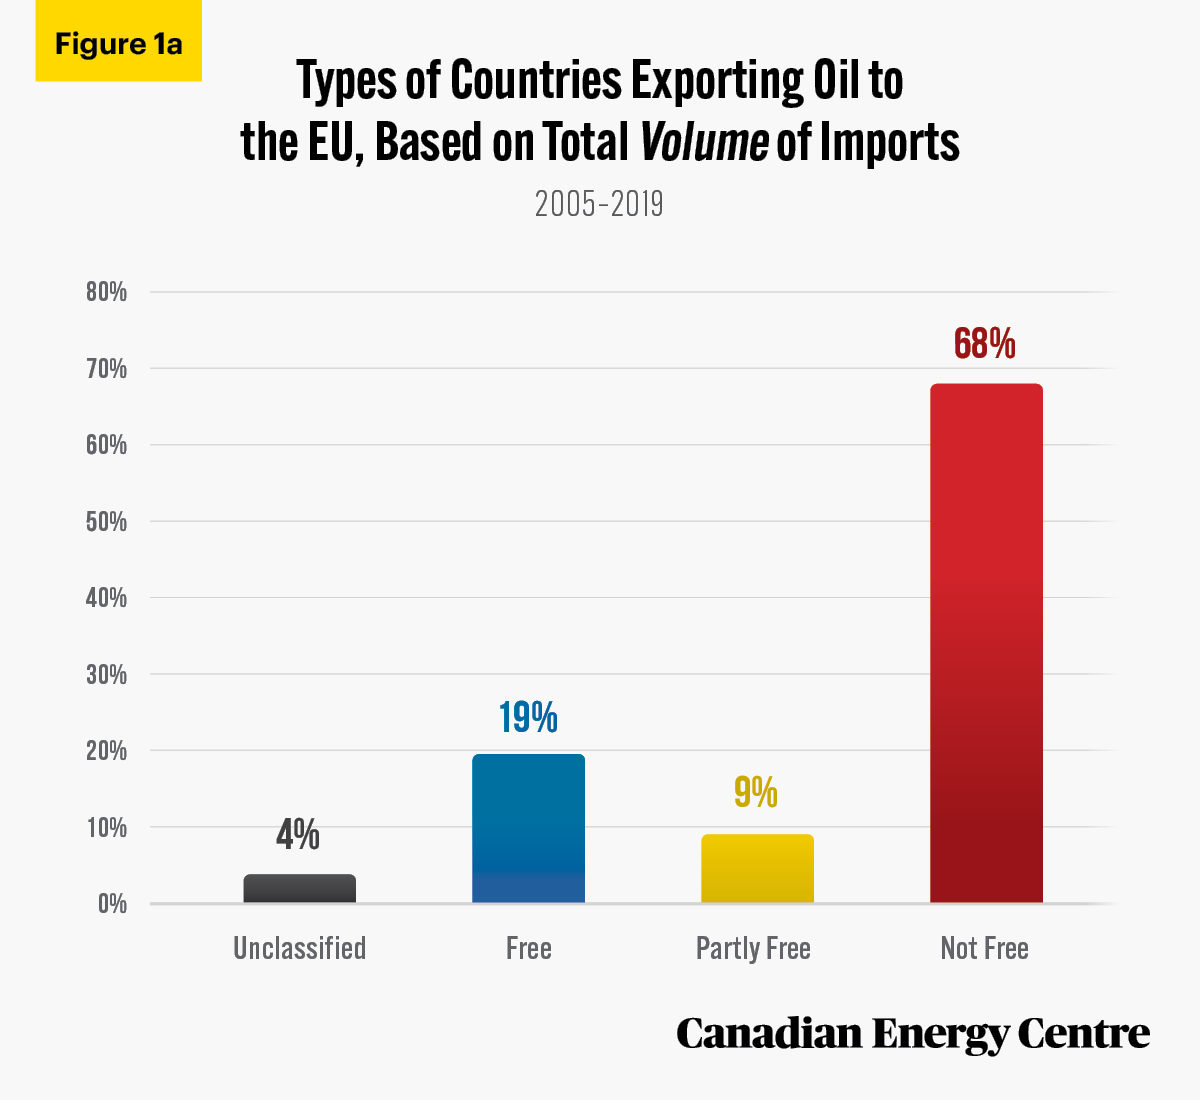
58.
Over 41.3 billion barrels, or 68 per cent of the oil imported into the EU, has been imported from Not Free countries, with an additional 5.3 billion barrels, or 9 per cent, coming from Partly Free countries. Meanwhile, 11.8 billion barrels, or 19 per cent, was sourced from Free countries.
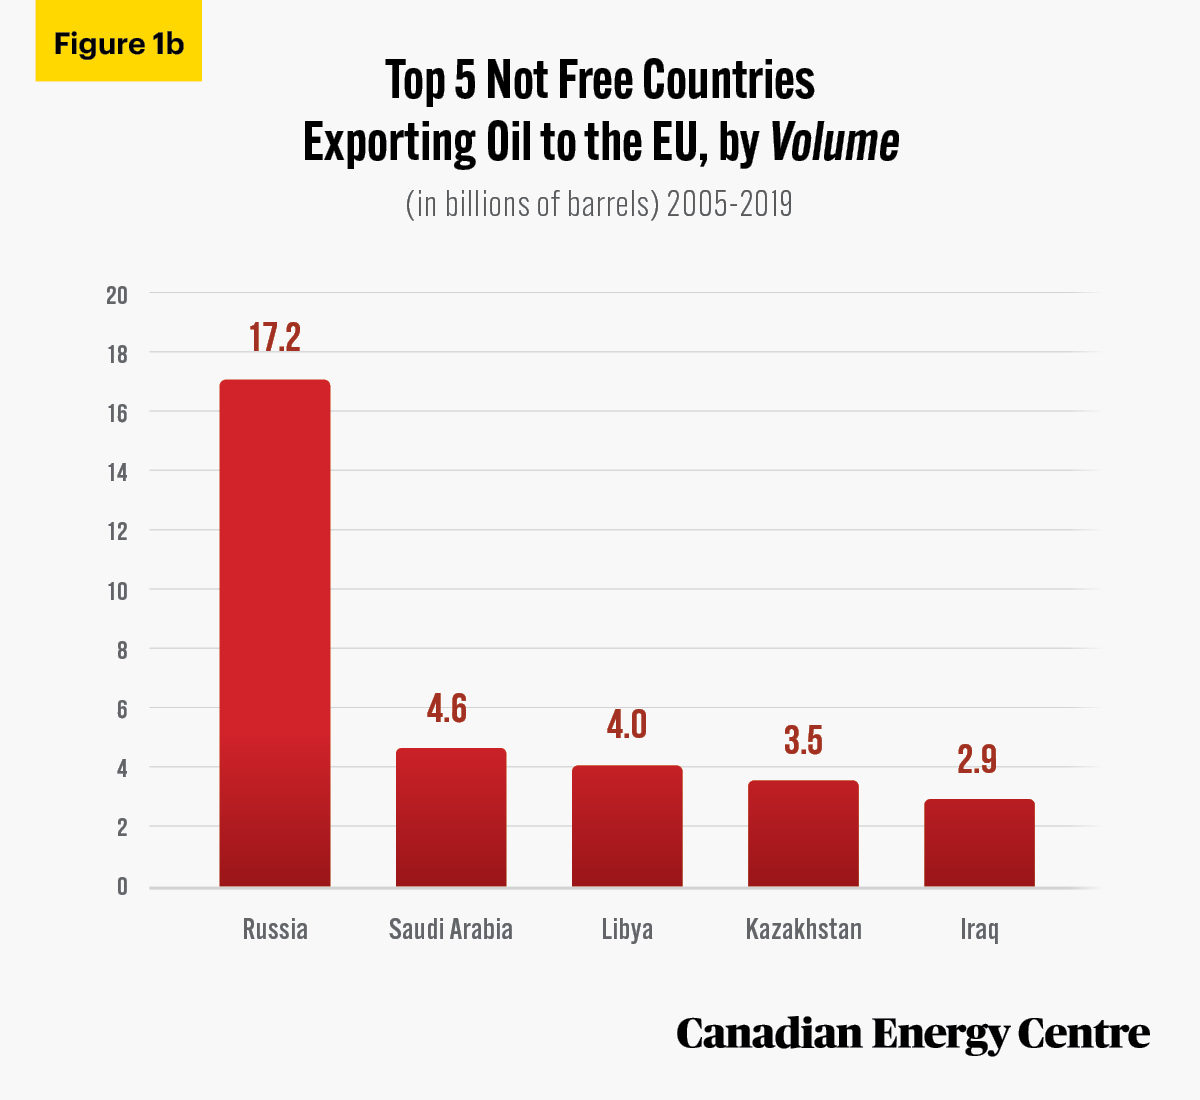
59.
Of the more than 41.3 billion barrels of oil that the EU imported from Not Free countries between 2005 and 2019:
a. Over 17.2 billion barrels, or about 42 per cent, came from Russia;
b. Nearly 4.6 billion barrels, or 11 per cent, came from Saudi Arabia;
c. Nearly 4 billion barrels, or 9.6 per cent, came from Libya;
d. Over 3.5 billion barrels, or 8.5 per cent, came from Kazakhstan; and
e. Nearly 2.9 billion barrels, or 6.9 per cent, came from Iraq.
60.
Between 2005 and 2019, the EU imported over €4.6 trillion worth of foreign crude oil, an average of €308 billion worth each year. That’s nearly CAD$6.9 trillion in total, or an annual average of CAD$458 billion in crude oil imports.
Source: European Commission, 2021.
61.
Nearly €3.1 trillion worth (about CAD$4.6 trillion), or 67 per cent, was imported from Not Free countries, with an additional €411 billion or 9 per cent coming from Partly Free countries. The EU sourced €901 billion, or nearly 20 per cent, from Free countries.
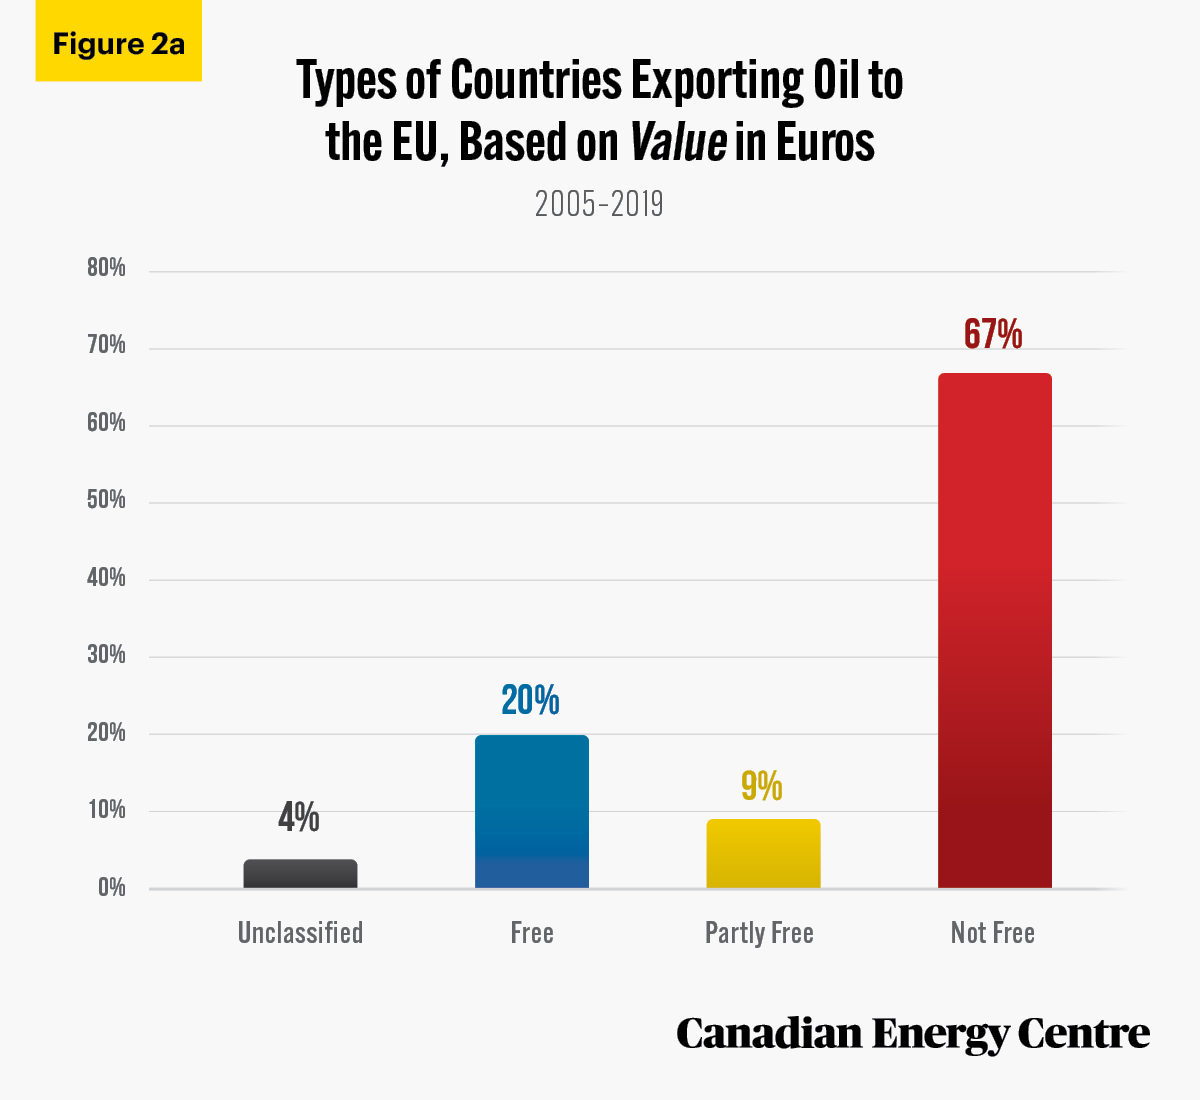
Source: European Commission, 2021.
62.
Of the nearly €3.1 trillion in oil that the EU imported from Not Free countries between 2005 and 2019, the top five sources were as follows:
a. Nearly €1.3 trillion, or about 42 per cent, came from Russia;
b. Nearly €343 billion, or just over 11 per cent, came from Saudi Arabia;
c. Over €305 billion, or 9.9 per cent, came from Libya;
d. Nearly €267 billion, or 8.7 per cent, came from Kazakhstan; and
e. Nearly €192 billion, or 6.2 per cent, came from Iraq;
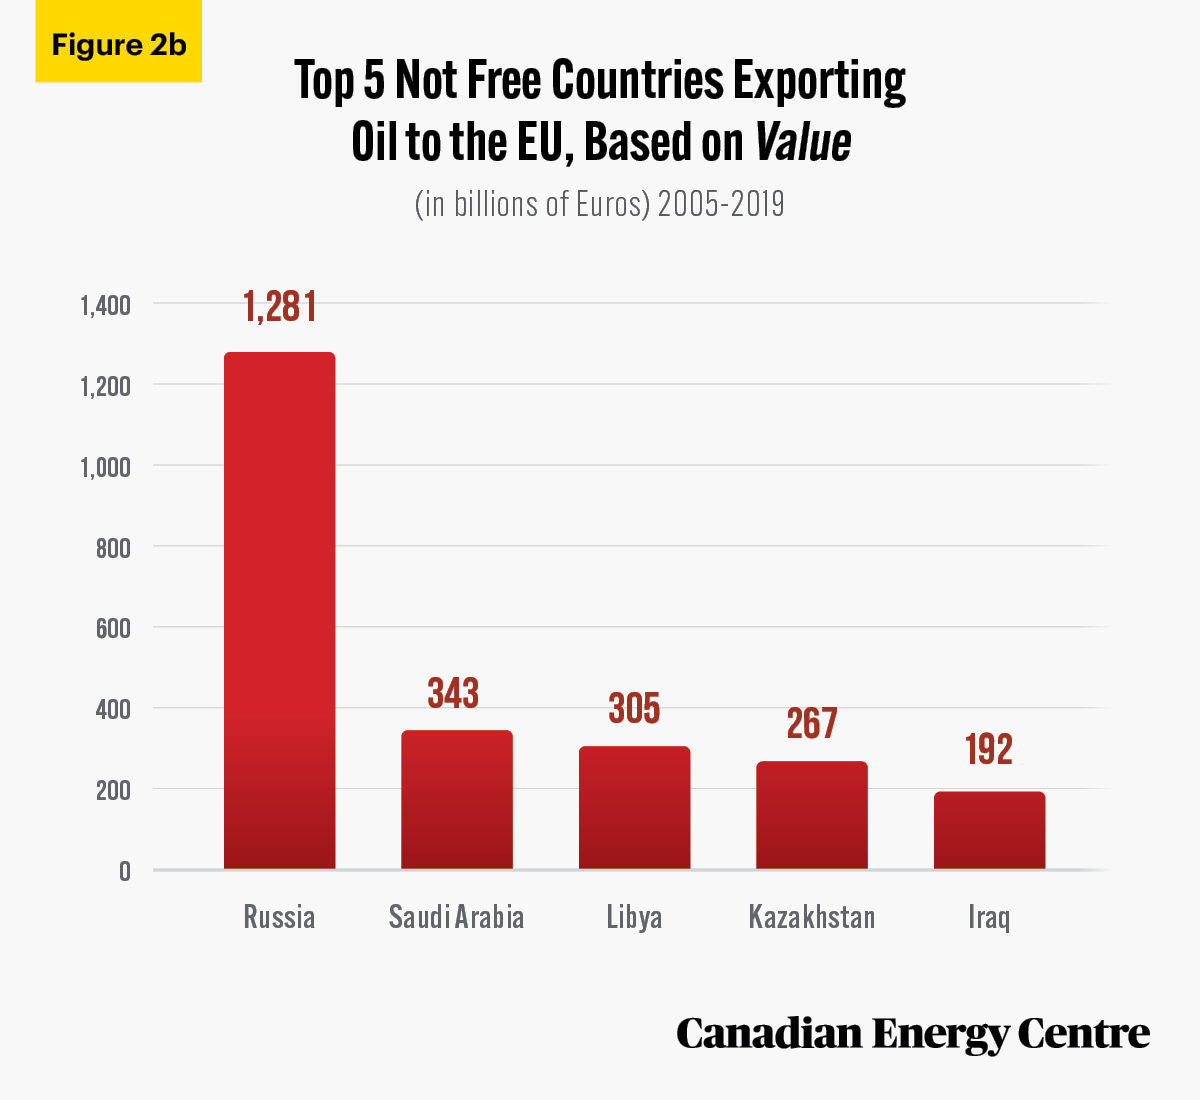
Source: European Commission, 2021.
63.
In the past 15 years, the EU has imported €838.3 billion in natural gas from foreign sources, an average of nearly €56 billion per year.
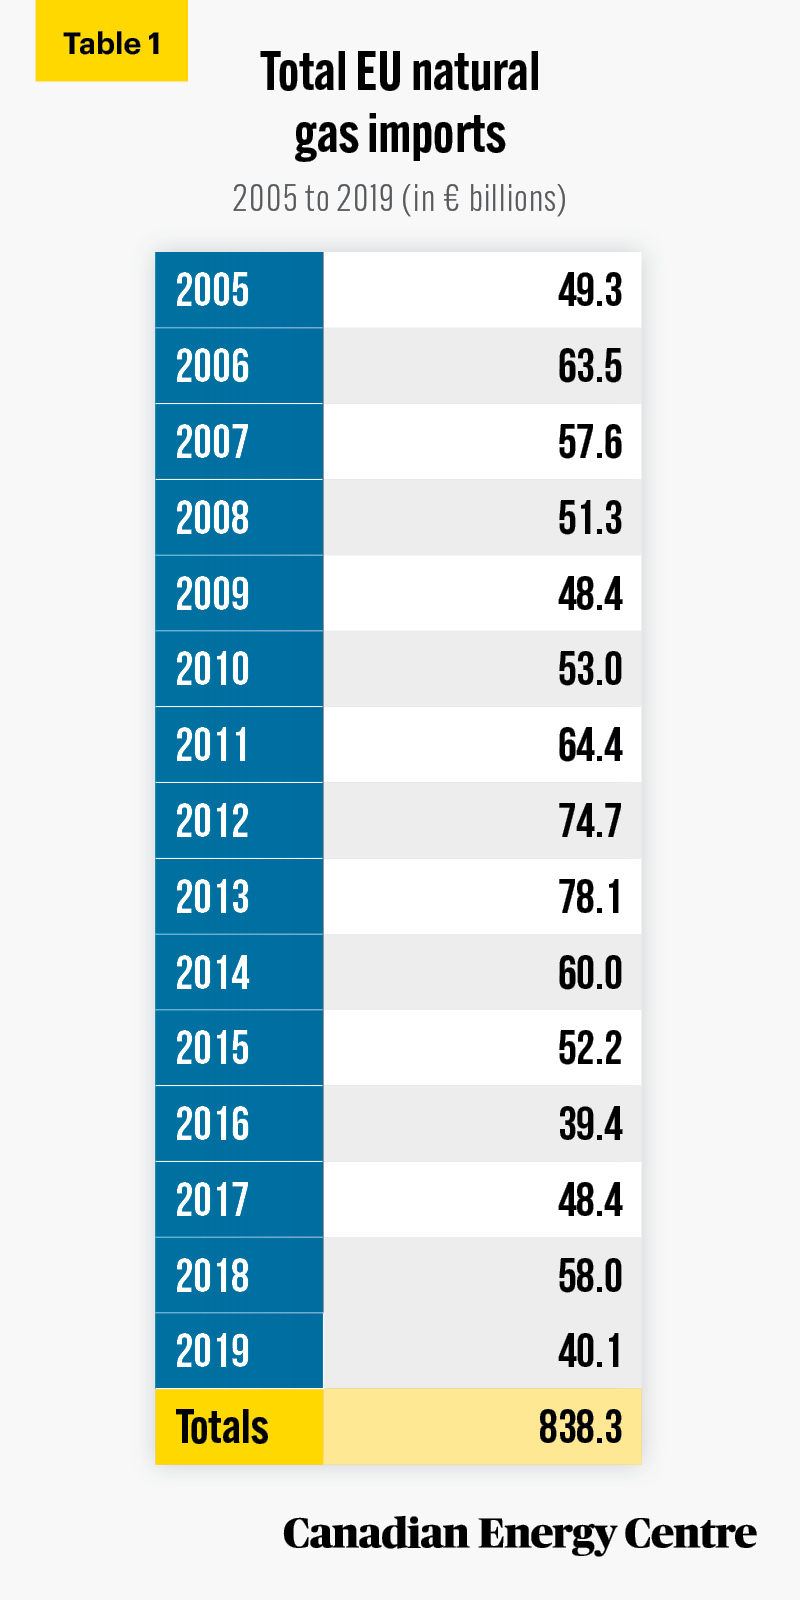
Source: Eurostat, 2021.
64.
Natural gas valued at over €286 billion, or 34.1 per cent, has been imported by the EU from Not Free countries, €519 billion or 62 per cent from Free countries, with an additional €2 billion, or 0.2 per cent, from Partly Free countries.
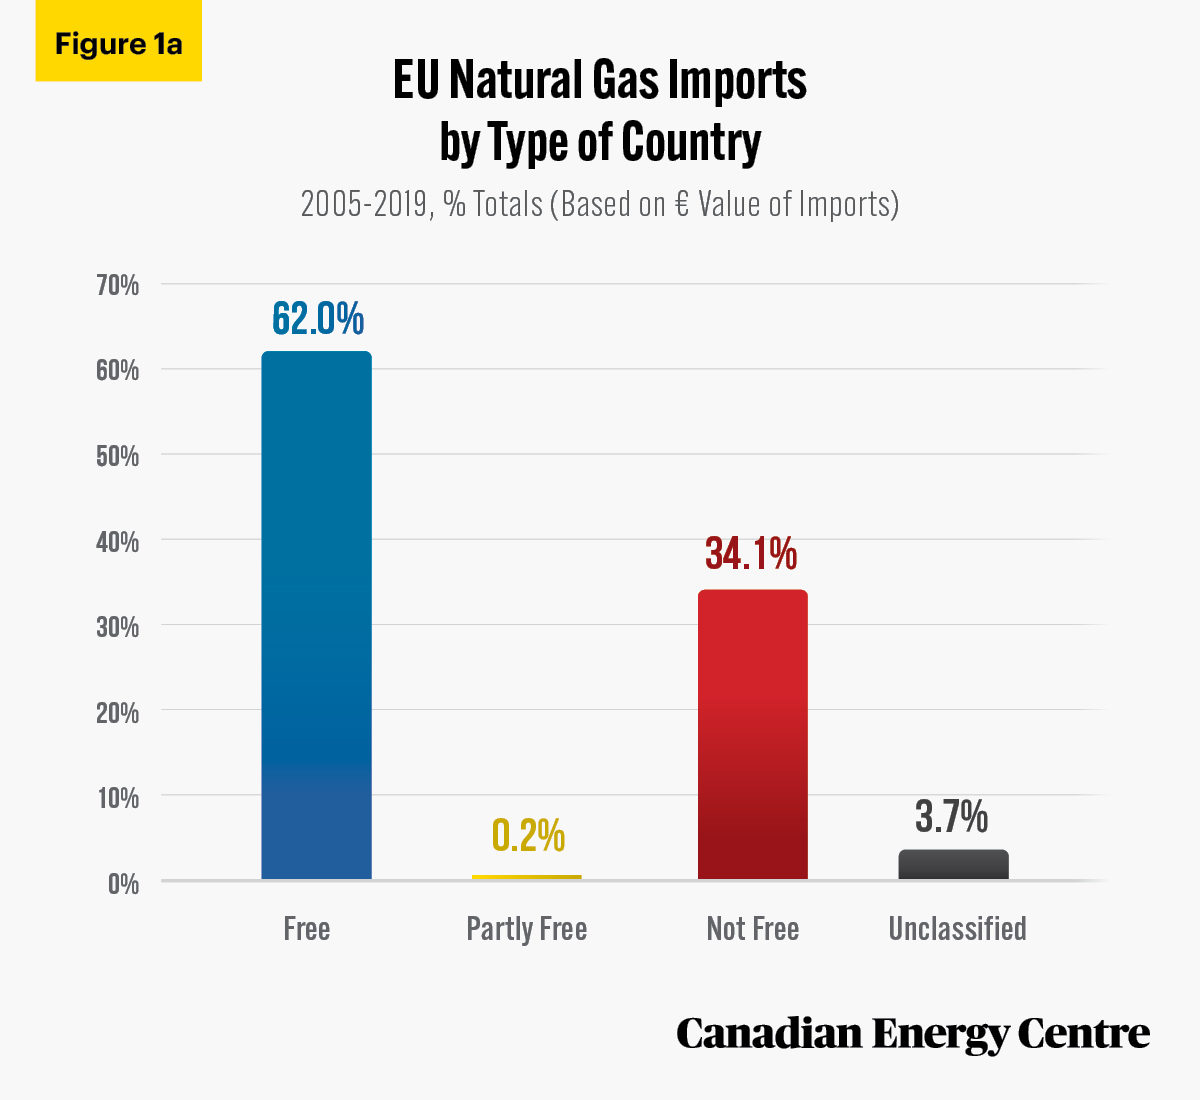
Sources: Eurostat, 2021, and Freedom House, 2020.
65.
Of the over €286 billion worth of natural gas imported by the EU from Not Free countries between 2005 and 2019:
a. Almost €165.3 billion worth, or about 58 per cent, came from Russia;
b. over €89.1 billion worth, or 31.1 per cent, came from Algeria; and
c. nearly €17.5 billion worth, or 6.1 per cent, came from Libya.
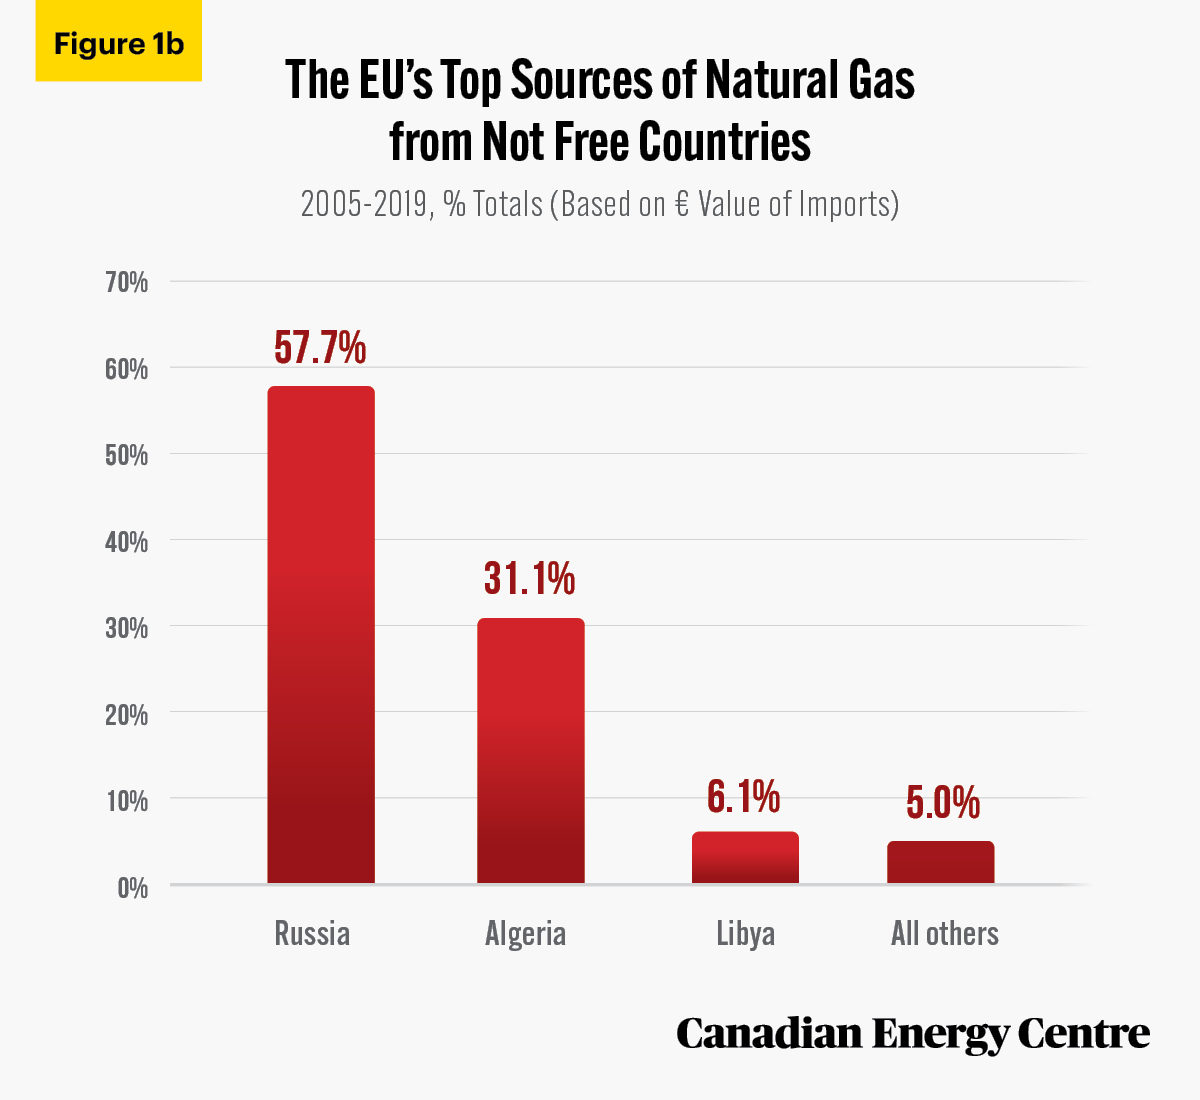
Sources: Eurostat, 2021, and Freedom House, 2020.
Oil and Gas and Renewable Subsidies
66.
Between 2010 and 2013, the IEA estimates that fossil fuel subsidies worldwide increased from US$445.3 billion to US$530.3 billion, before steadily declining to US$317.6 billion in 2019. Iran led the way at US$86.1 billion, followed by China at US$30.5 billion, Saudi Arabia at US$28.7 billion, Russia at US$24.1 billion, India at US$21.8 billion, Indonesia at US$19.2 billion, and Egypt at US$15.8 billion.
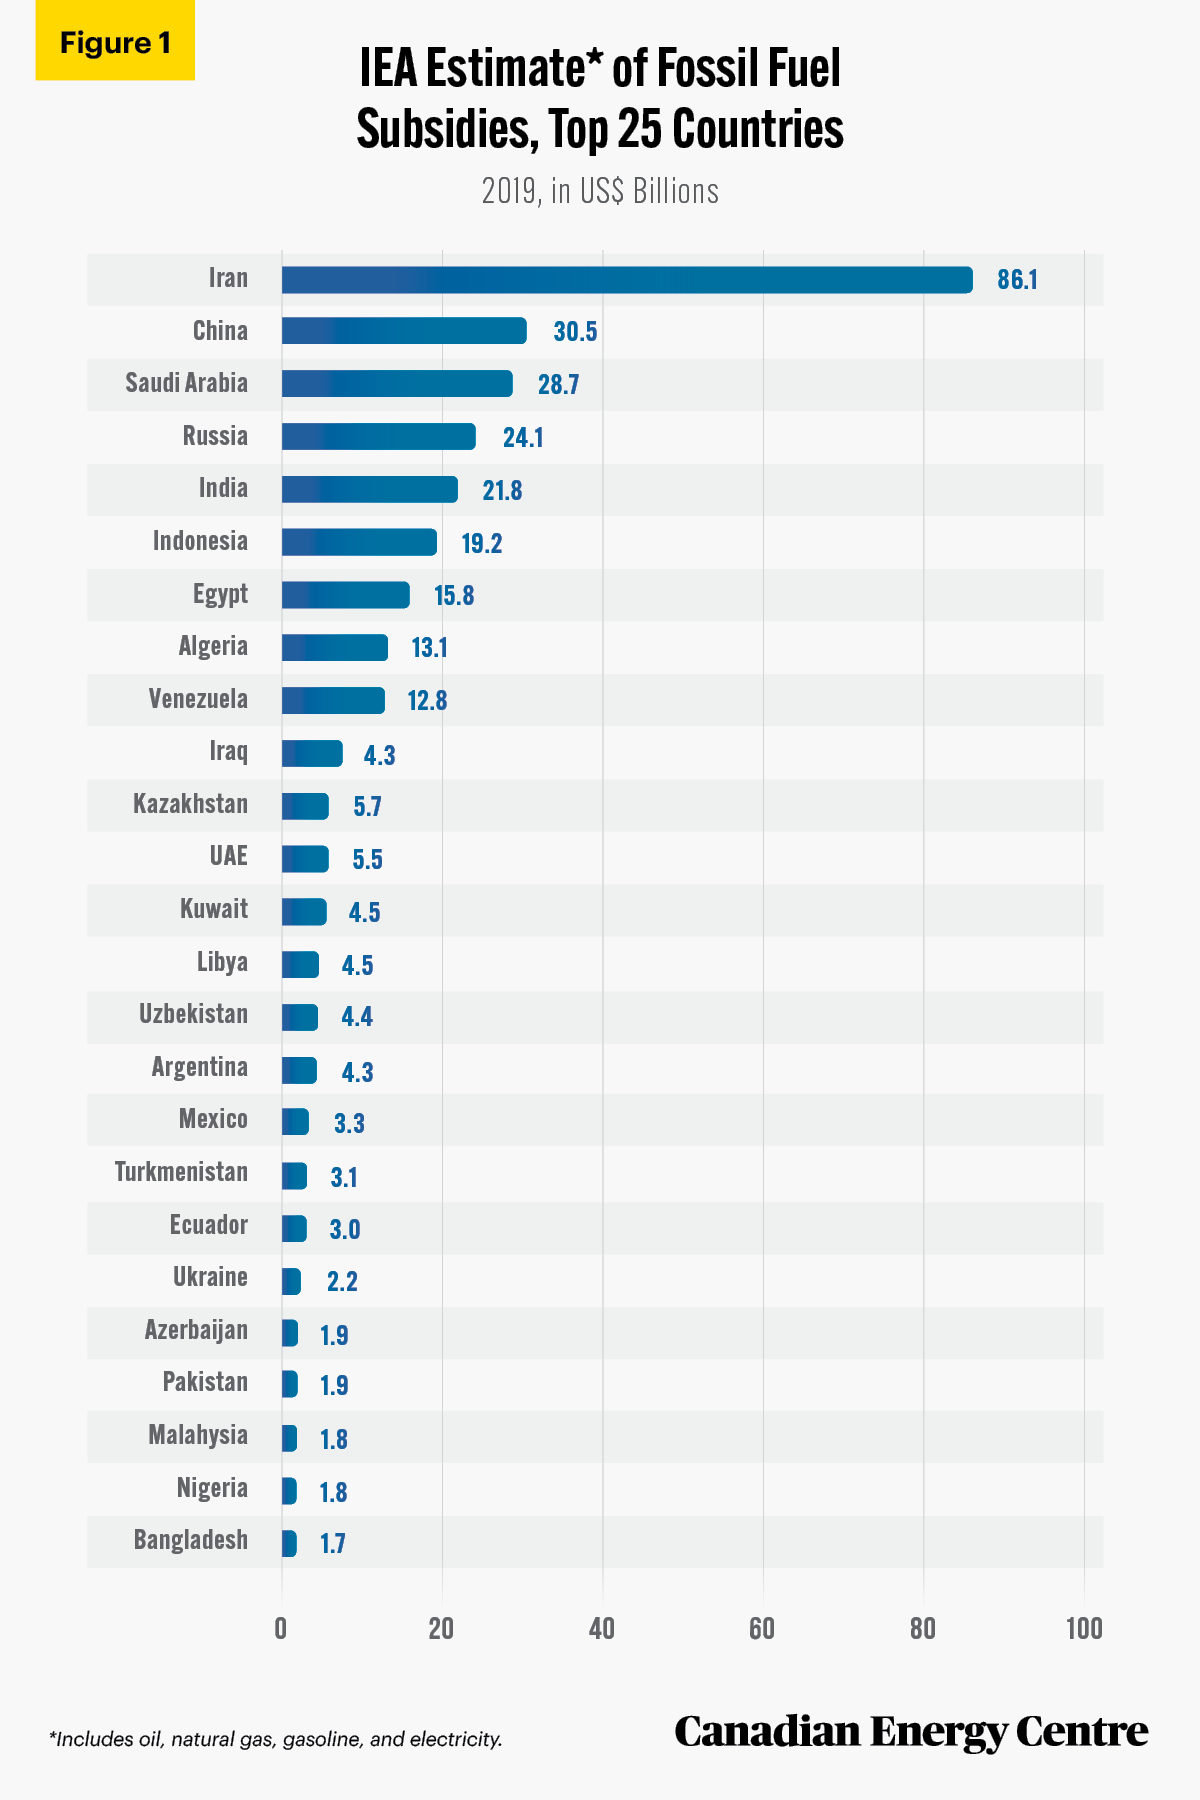
Source: International Energy Agency, Fossil Fuel Subsidies Database, 2020.
67.
According to the International Renewable Energy Agency (IRENA), as fossil fuel subsidies fall and the deployment of renewable energy accelerates, the total subsidies for renewables will grow. Looking towards 2050, as the demand for fossil fuel declines, direct subsidies for those fuels are expected to fall from US$447 billion in 2017 to US$165 billion in 2030 and to US$139 billion in 2050.
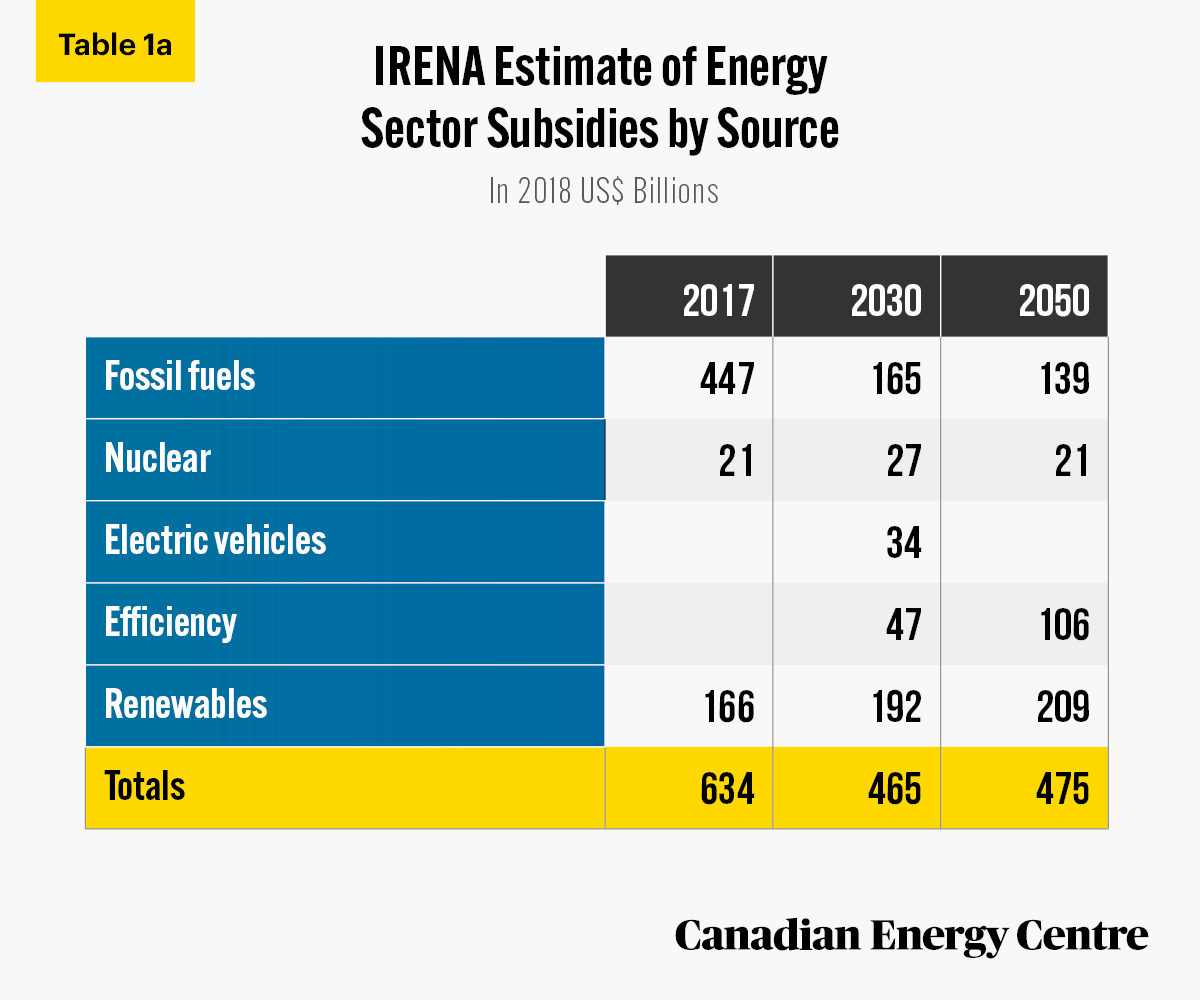
Source: IRENA, 2020a.
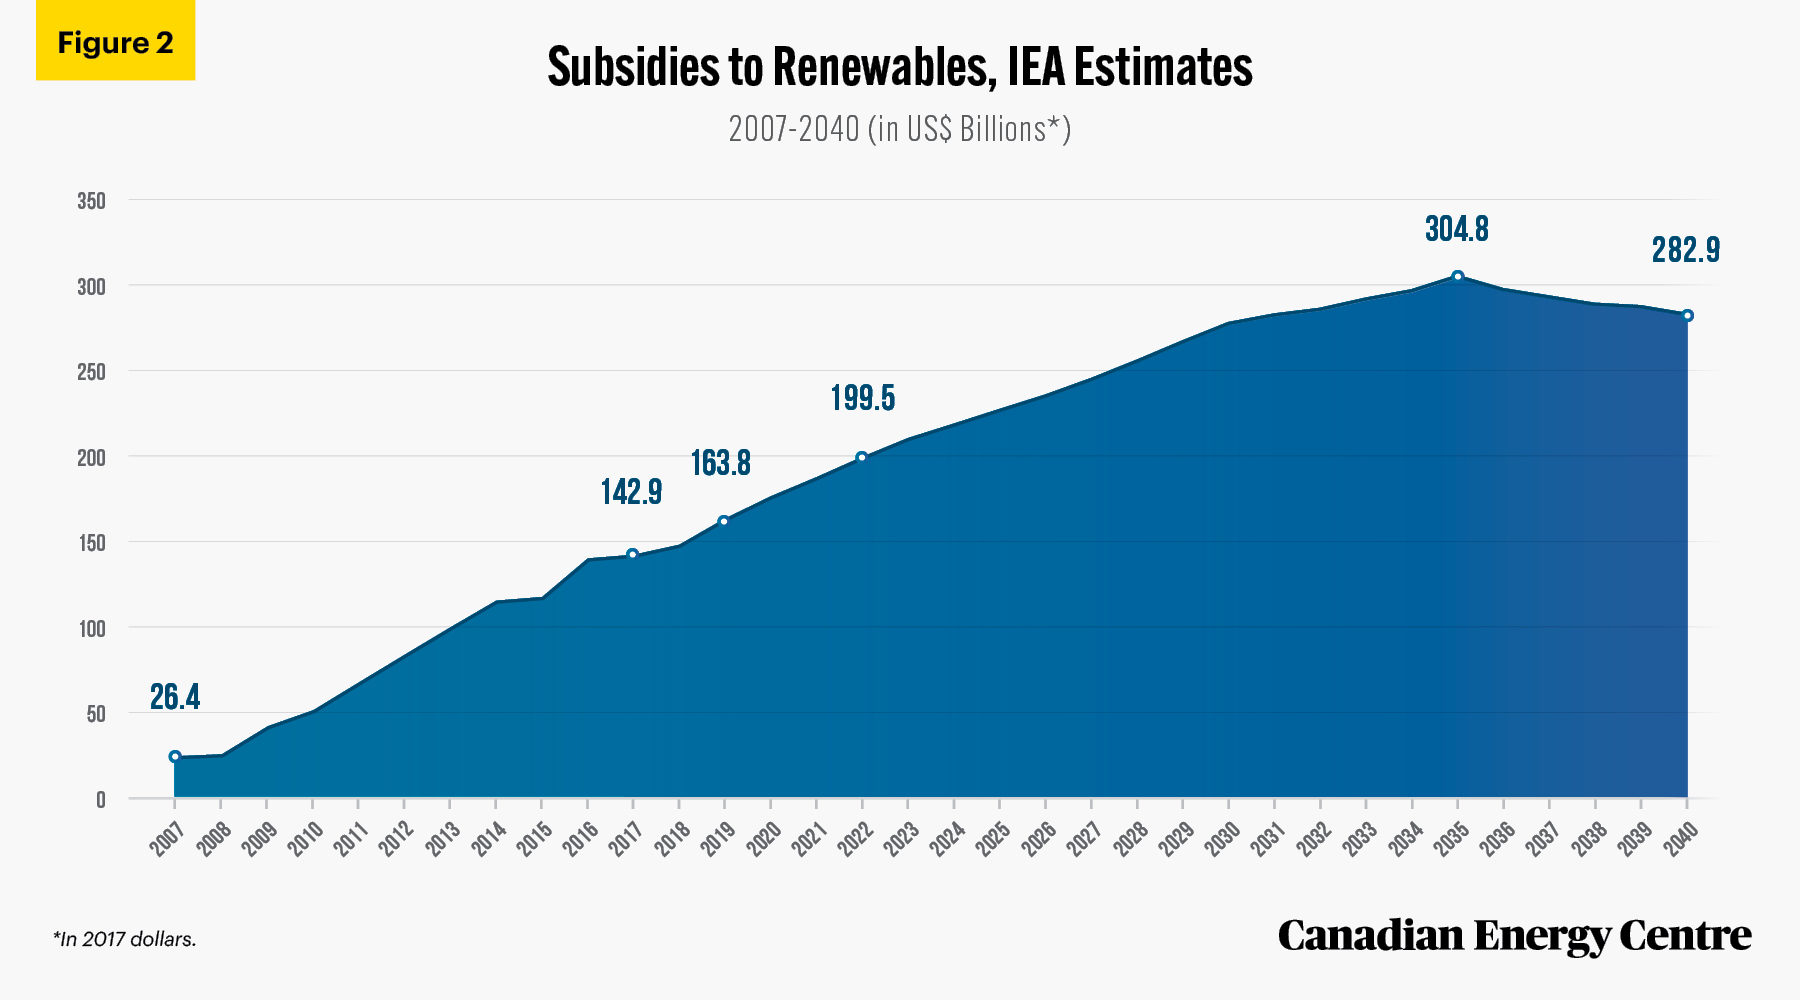
68.
In 2018, the IEA examined the trends and calculated renewable subsidies out to 2040 under its New Policies Scenario (NPS). NPS reflects the impact of existing policy frameworks and announced policy intentions. Under the NPS, global support provided to renewable-based electricity will peak at just under US$305 billion in 2035 and then decline to about US$283 billion by 2040. Of the total cumulative support from 2017 to 2040, more than 75 per cent is earmarked for solar PV and wind power, and more than 15 per cent for bioenergy. Cumulative support for renewables between 2020 and 2040 is estimated at over US$5.4 trillion.
Source: IEA, World Energy Outlook, 2018.
Impact of Carbon Taxes on Vehicle Fuel Costs in Canada
69.
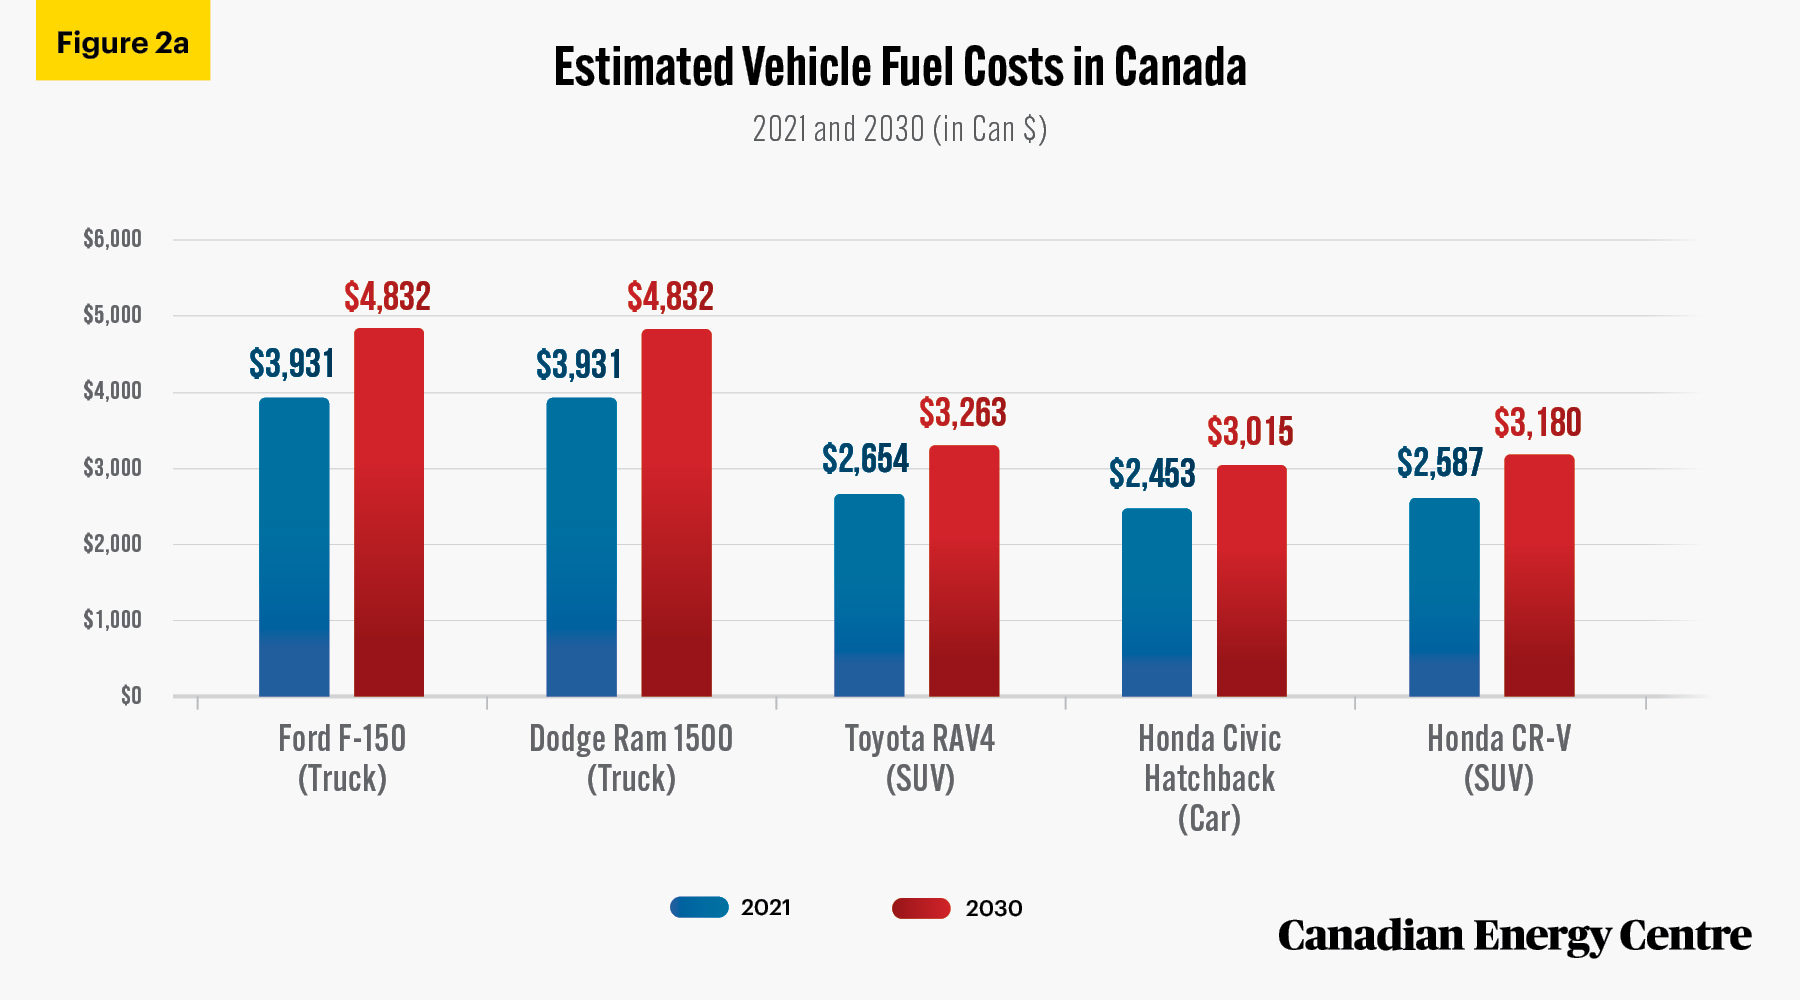
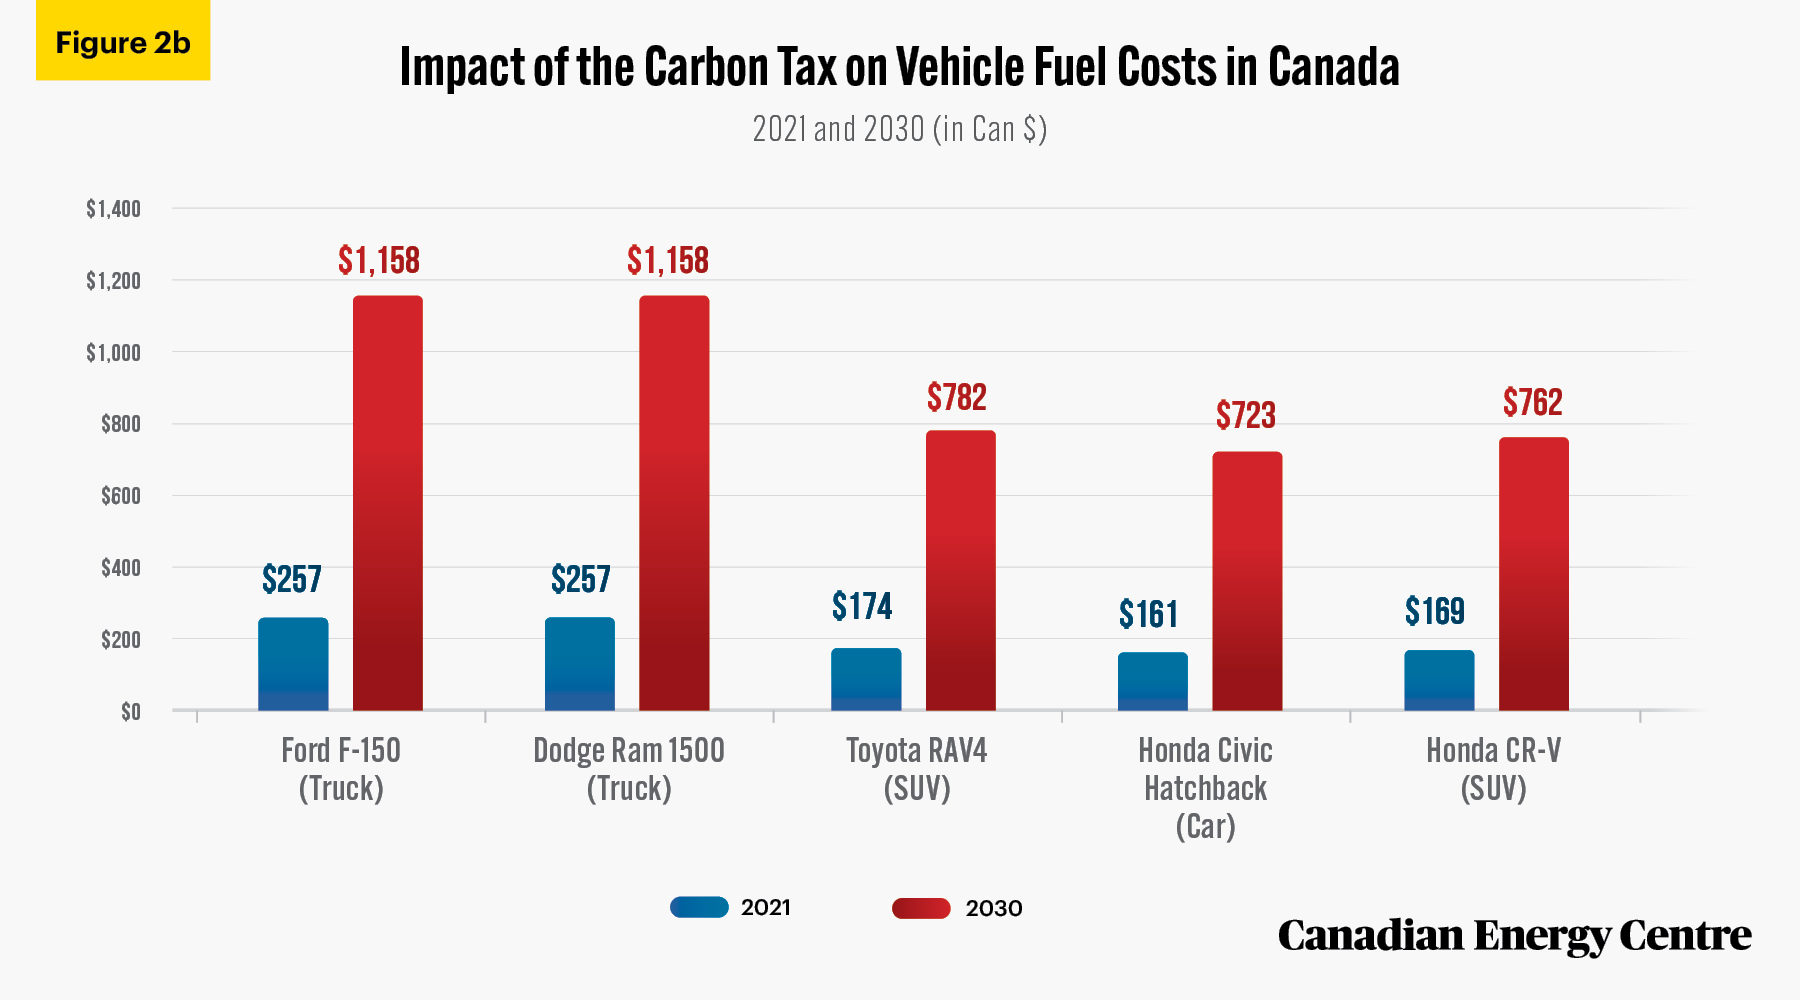
Between 2021 and 2030, gasoline costs associated with the federal carbon tax are expected to rise from 8.8 cents per litre to 39.6 cents per litre, an increase of 350 per cent over those nine years This will have significant impact on the estimated annual fuel costs for the top five vehicles sold in Canada, based on 2019 sales. In 2030, the carbon tax portion will comprise between $723 and $1,158, or about 24 per cent, of the total fill-up costs, assuming that the remaining components of the gasoline cost structure stay the same:
- Ford 150: $4,832 in annual fuel costs, with the federal carbon tax comprising $1,158 of that cost, an increase of $901, or 350 per cent, from 2021.
- Dodge Ram 1500: $4,832 in annual fuel costs, with the federal carbon tax comprising $1,158 of that cost, an increase of $901, or 350 per cent, from 2021.
- Toyota RAV4: $3,263 in annual fuel costs, with the federal carbon tax comprising $782 of that cost, an increase of $608, or 350 per cent, from 2021.
- Honda Civic: $3,015 in annual fuel costs, with the federal carbon tax comprising $723 of that cost, an increase of $562, or 350 per cent, from 2021.
- Honda CR-V: $3,180 in annual fuel costs, with the federal carbon tax comprising $762 of that cost, an increase of $593, or 350 per cent, from 2021.
Source: Authors’ calculations from Canada Revenue Agency, 2021.
Source: Authors’ calculations from Canada Revenue Agency, 2021.
Energy Poverty in the EU
70.
In United Kingdom and Ireland, electricity prices soared by 51 per cent and 48 per cent, respectively while household median income rose by just 14 per cent and 11 per cent. The split between significantly higher power bills and an almost status-quo reality on median household incomes helps explain why some European (or United Kingdom) households have found it increasingly difficult to pay their utility bills.
71.
In Spain, electricity prices soared by 68 per cent between 2008 and 2020 with median household income rising by just eight per cent (by 2019).
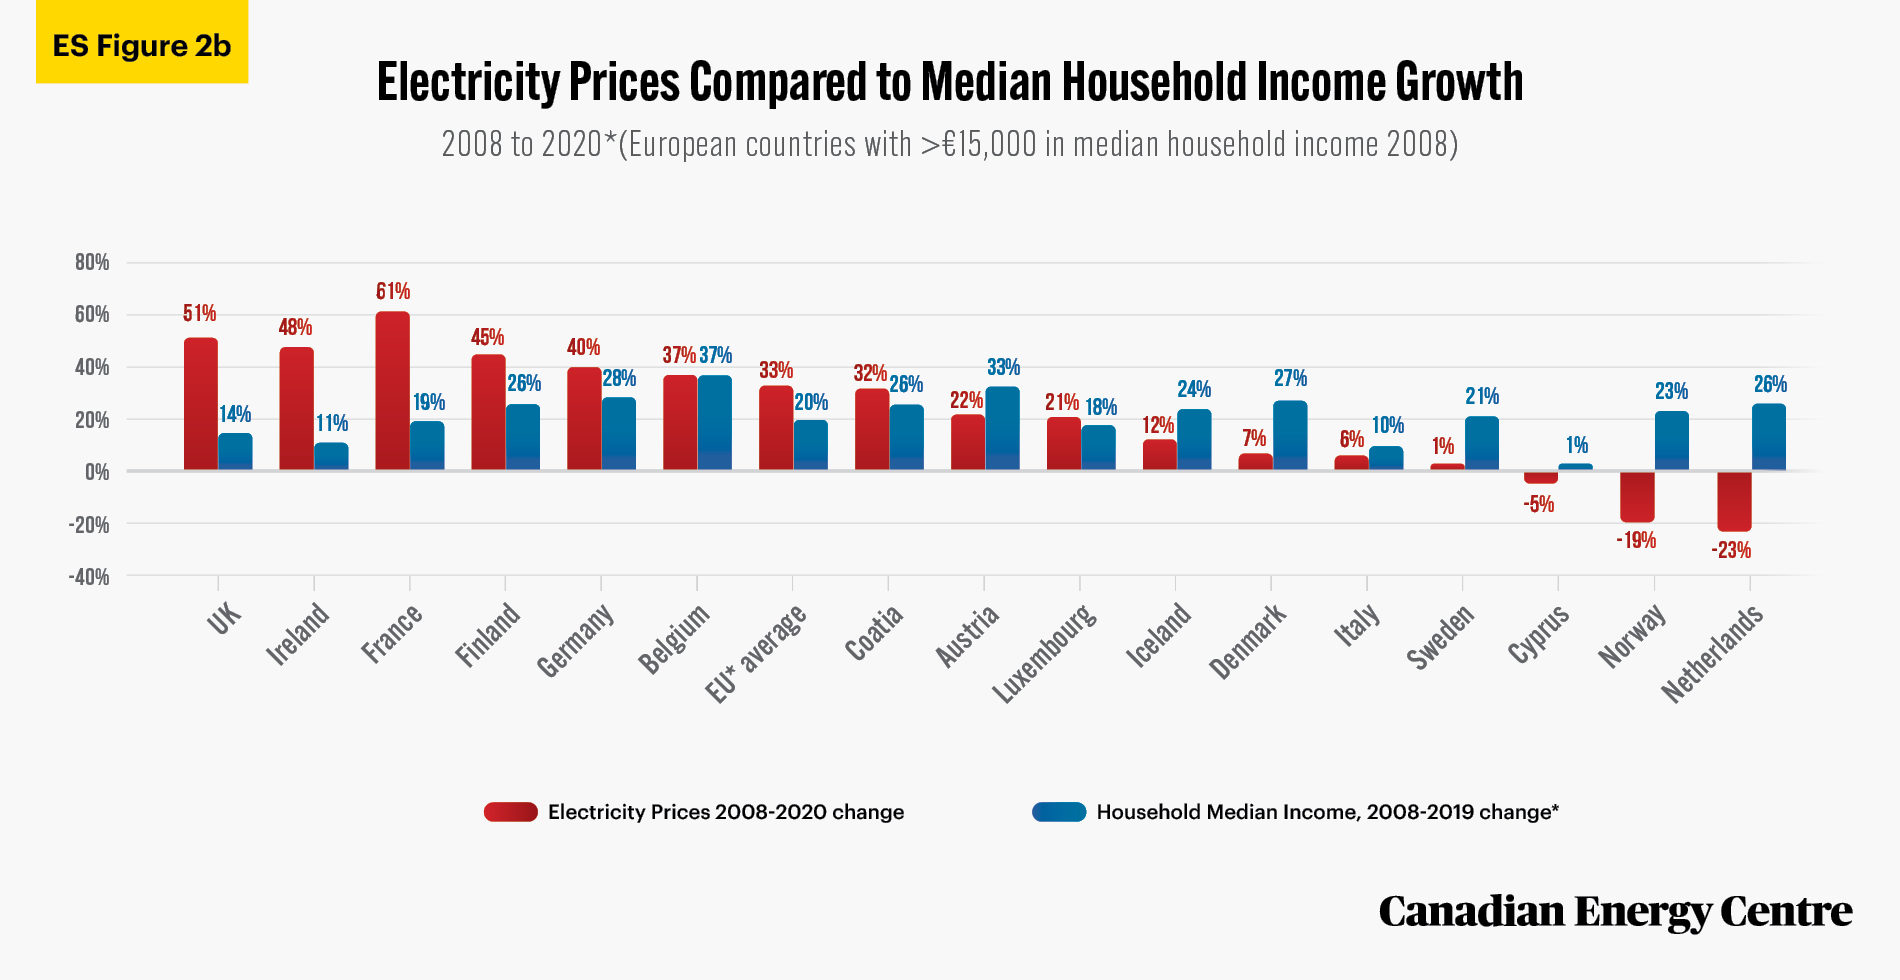
Source: Authors’ calculation from Eurostat database.
72.
According to the European Commission: An average household in the EU27 paid €25 /MWh in renewable taxes in 2019. This figure equals 29 per cent of the taxes and levies component and 12 per cent of the total average EU price. The average amount of renewable taxes paid by households in the EU27 rose by 153 per cent since 2010.
Source: Eurostat Database (2021).
CEC Research Briefs
Canadian Energy Centre (CEC) Research Briefs are contextual explanations of data as they relate to Canadian energy. They are statistical analyses released periodically to provide context on energy issues for investors, policymakers, and the public. The source of profiled data depends on the specific issue. This research brief is a compilation of previous Fact Sheets and Research Briefs released by the Centre in 2020. Sources can be accessed in the previously-released reports.
About the authors
This CEC Research Brief was compiled by Lennie Kaplan, former Chief Research Analyst and current Executive Director of Research; Ven Venkatachalam, former Senior Research Analyst and current Chief Research Analyst; and Mark Milke, former Executive Director of Research.
Creative Commons Copyright
Research and data from the Canadian Energy Centre (CEC) is available for public usage under creative commons copyright terms with attribution to the CEC. Attribution and specific restrictions on usage including non-commercial use only and no changes to material should follow guidelines enunciated by Creative Commons here: Attribution-NonCommercial-NoDerivs CC BY-NC-ND.
Photo Credits
Davide Colonna, Shubham Sharan, Marco Tjokro, JF Martin, Ethan Cull, TruckPR, Jared Murray, Ken Steele, NASA, Sebastiaan Stam, Pietro De Grandi, Leonard von Bibra, Natalya Letunova, Raimond Klavins, Erik Mclean, Chris Bair,
“PacLease – LNG rental trucks 3” by TruckPR is licensed under CC BY-NC-ND 2.0