
To sign up to receive the latest Canadian Energy Centre research to your inbox email: [email protected]
Download the PDF here
Download the charts here
Overview
Canada’s oil and gas industry has a positive impact on many sectors of the Canadian economy, not only in Alberta but across the country. In this CEC Fact Sheet, we examine the direct and indirect impact that the oil and gas sector has on Ontario’s economy.¹ Given that the largest proportion of oil and gas activity in Canada occurs in Alberta, we also profile the impact of purchases from Alberta on specific Ontario sectors.
Impact of the oil and gas sector on Ontario
Using customized data from Statistics Canada² (see Table 1), in 2018³ the oil and gas sector:
- Was responsible for adding $8.1 billion in nominal GDP to Ontario’s economy;
- Generated $16.2 billion in outputs for the Ontario economy;
- Supported over 71,500 direct and indirect jobs in Ontario’s economy; and
- Paid over $3.1 billion in wages and salaries to workers in Ontario.
1. The direct impact is measured in terms of GDP, output, and jobs within the oil and gas sector. The indirect impact is measured in terms of GDP, output, and jobs through the oil and gas sector supply chain, including other key sectors of Ontario’s economy. See the end of this Fact Sheet for entities included in the definition of the oil and gas sector.
2. For a discussion of Statistics Canada’s use of input/output models and equilibrium models, see the addendum in Fact Sheet #17.
3. The latest year for which there are available data.
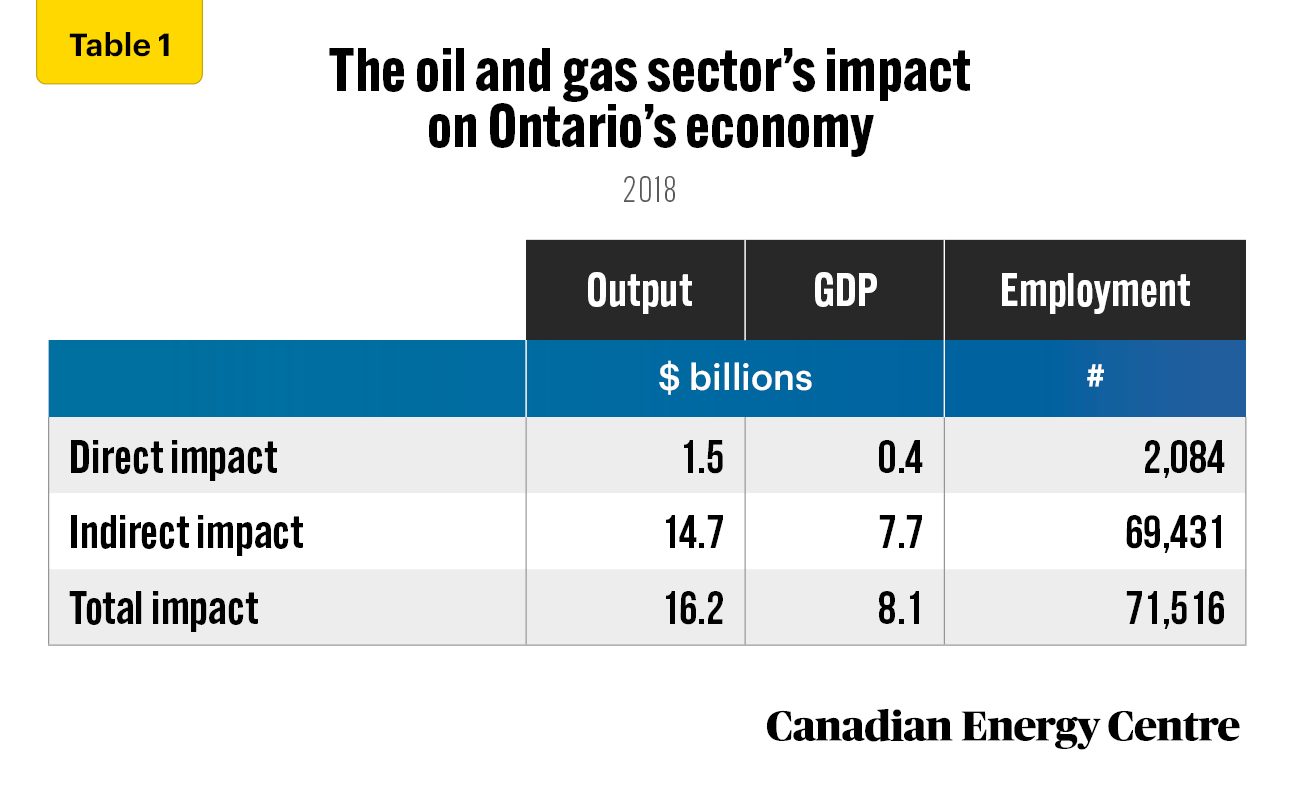
Source: Derived from Statistics Canada, Supply and Use Tables, custom tabulation.
Alberta: Ontario’s second-biggest destination for interprovincial trade
Alberta is second only to Quebec as a critical market for Ontario’s interprovincial exports (see Table 2). Ontario’s trade with Alberta was worth $34.2 billion in 2018, or 24.1 per cent of all Ontario interprovincial trade, second only to Quebec at $46.6 billion or 32.9 per cent.
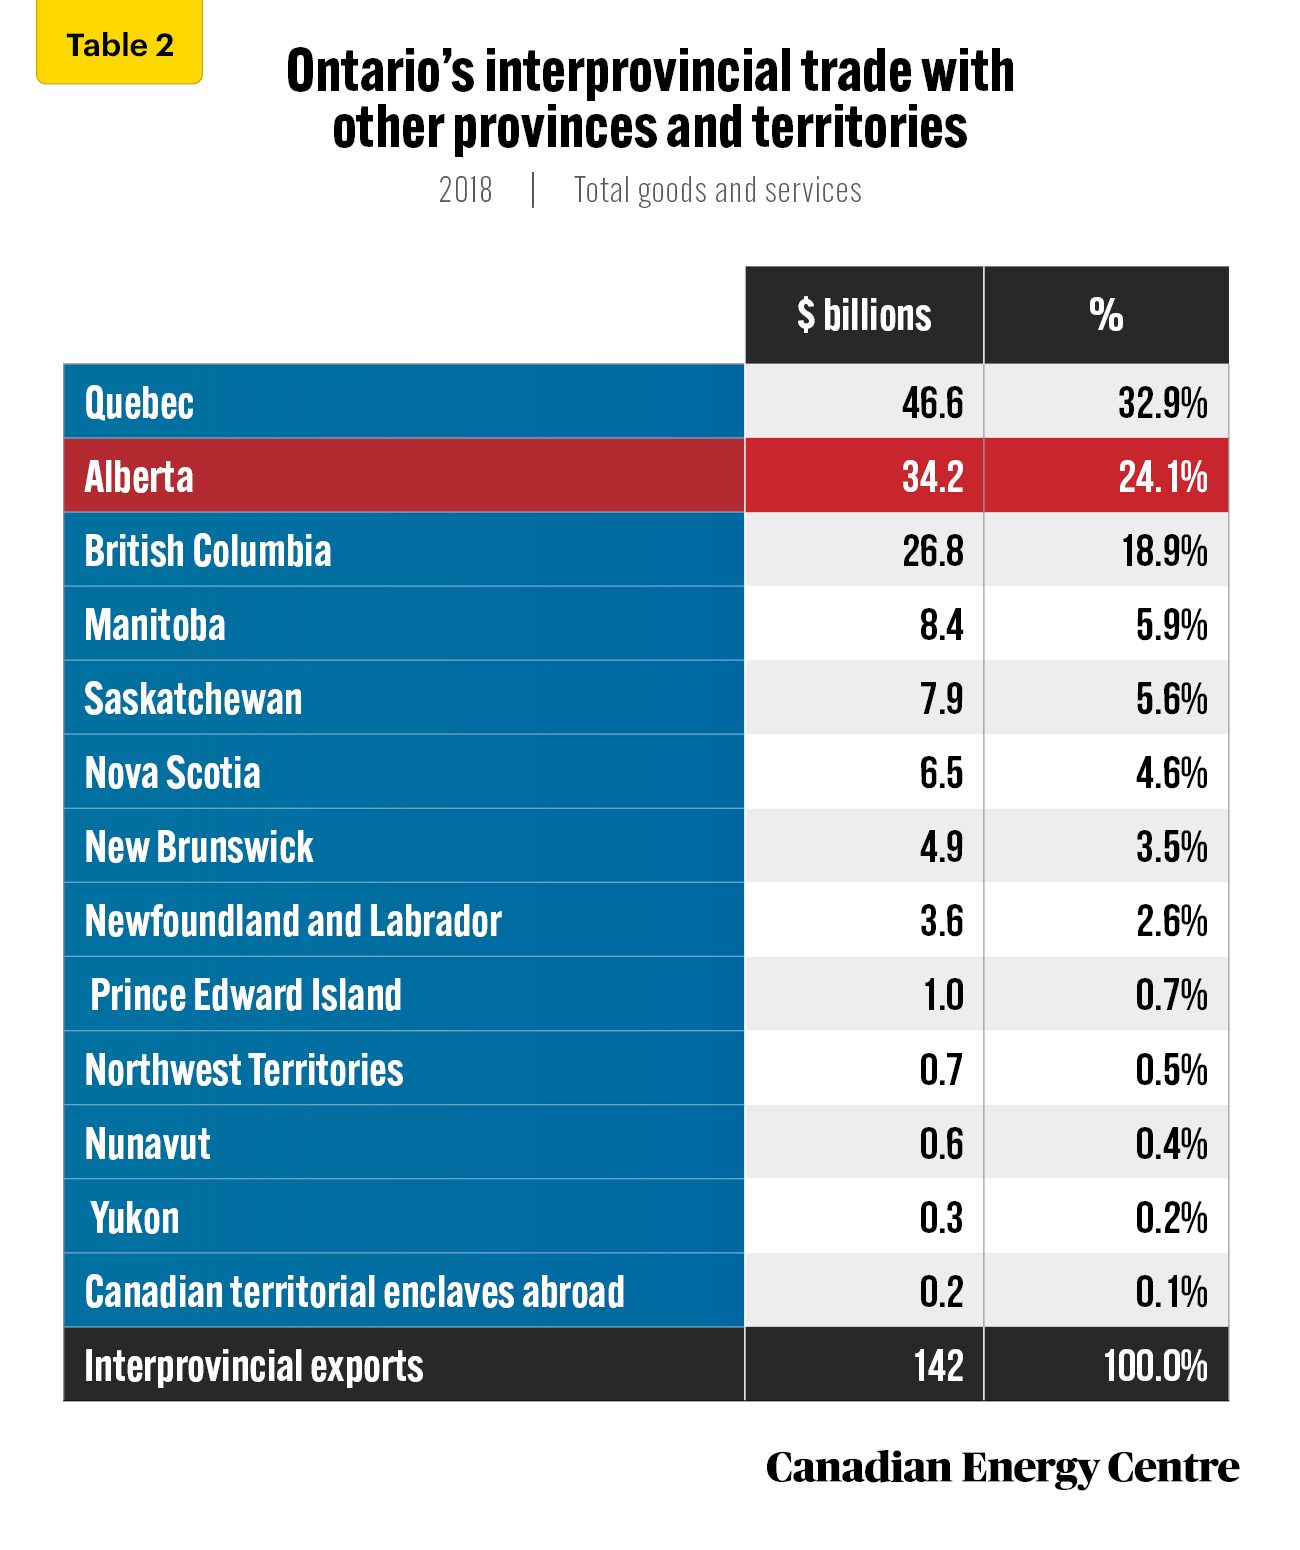
Source: Statistics Canada, Table 12-10-0088-01
Analyzing Alberta’s purchasing impact on Ontario manufacturers: $7.5 billion or almost 21% of Ontario’s manufacturing exports to all provinces
In 2018, purchases from Ontario’s manufacturing sector by Alberta businesses (21 per cent of total Ontario manufacturing exports), were significantly higher than Alberta’s proportion of Canada’s population at 11.6 per cent (see Figure 1).
In dollar terms, Albertans made substantial purchases from Ontario in 2018, from $22 million in computers and electronics to over $2.1 billion in food and non-alcoholic beverages. As a proportion of Ontario’s manufacturing sub-sectors, Alberta’s purchases ranged from 4.8 per cent for wood, pulp, and paper, to 26 per cent for furniture, to 27 per cent for refined petroleum products. Alberta-based consumers, businesses, and governments made an average of 20.8 per cent of purchases from all sectors in Ontario.
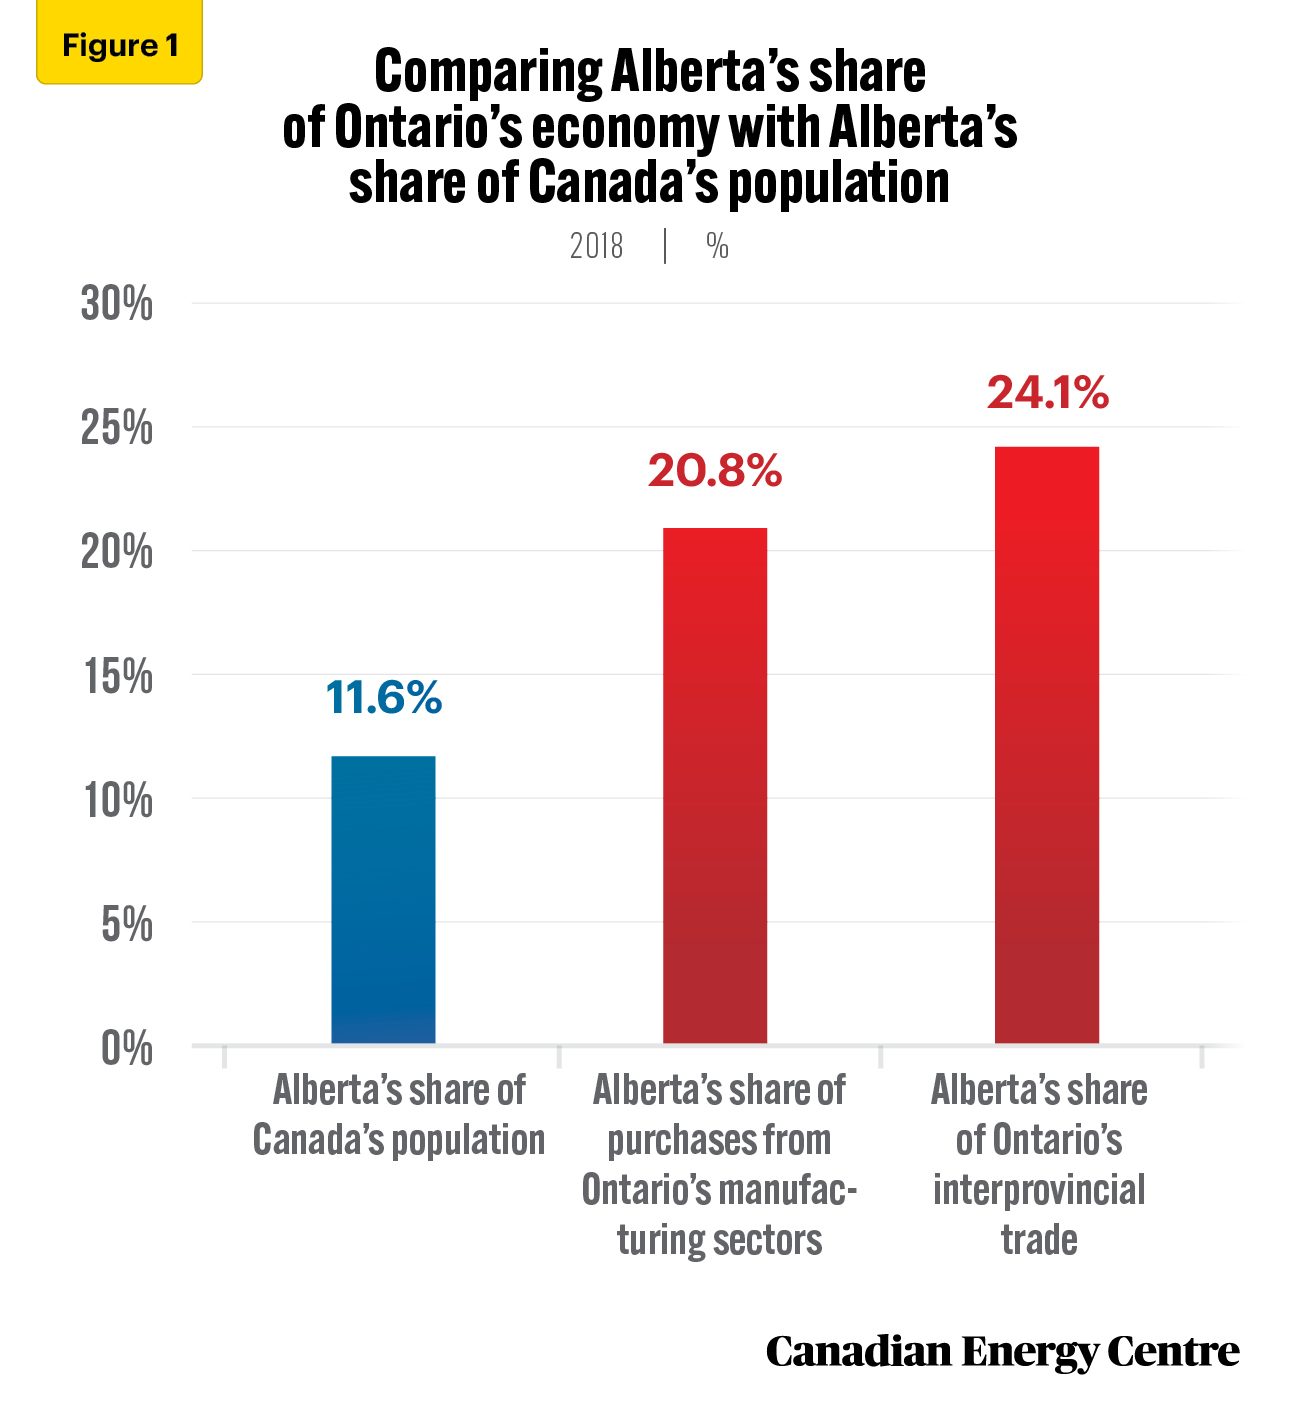
Sources: Statistics Canada, Table 12-10-0088-01; Table 17-10-0005-01.
Alberta’s share of Ontario’s interprovincial trade: $32.5 billion or nearly 24%
In 2018, Alberta’s share of Ontario’s interprovincial trade (beyond just manufacturing) was worth $34.2 billion or 24.1 per cent of all exports from Ontario that year (see Figure 1 and Addendum 1). The value of Alberta’s purchases to Ontario ranged from $100 million in the mining, quarrying, and oil and gas extraction sector (3.9 per cent of that sector’s value in Ontario) to nearly $8.4 billion in finance and insurance (over 31 per cent of that sector’s value in Ontario).
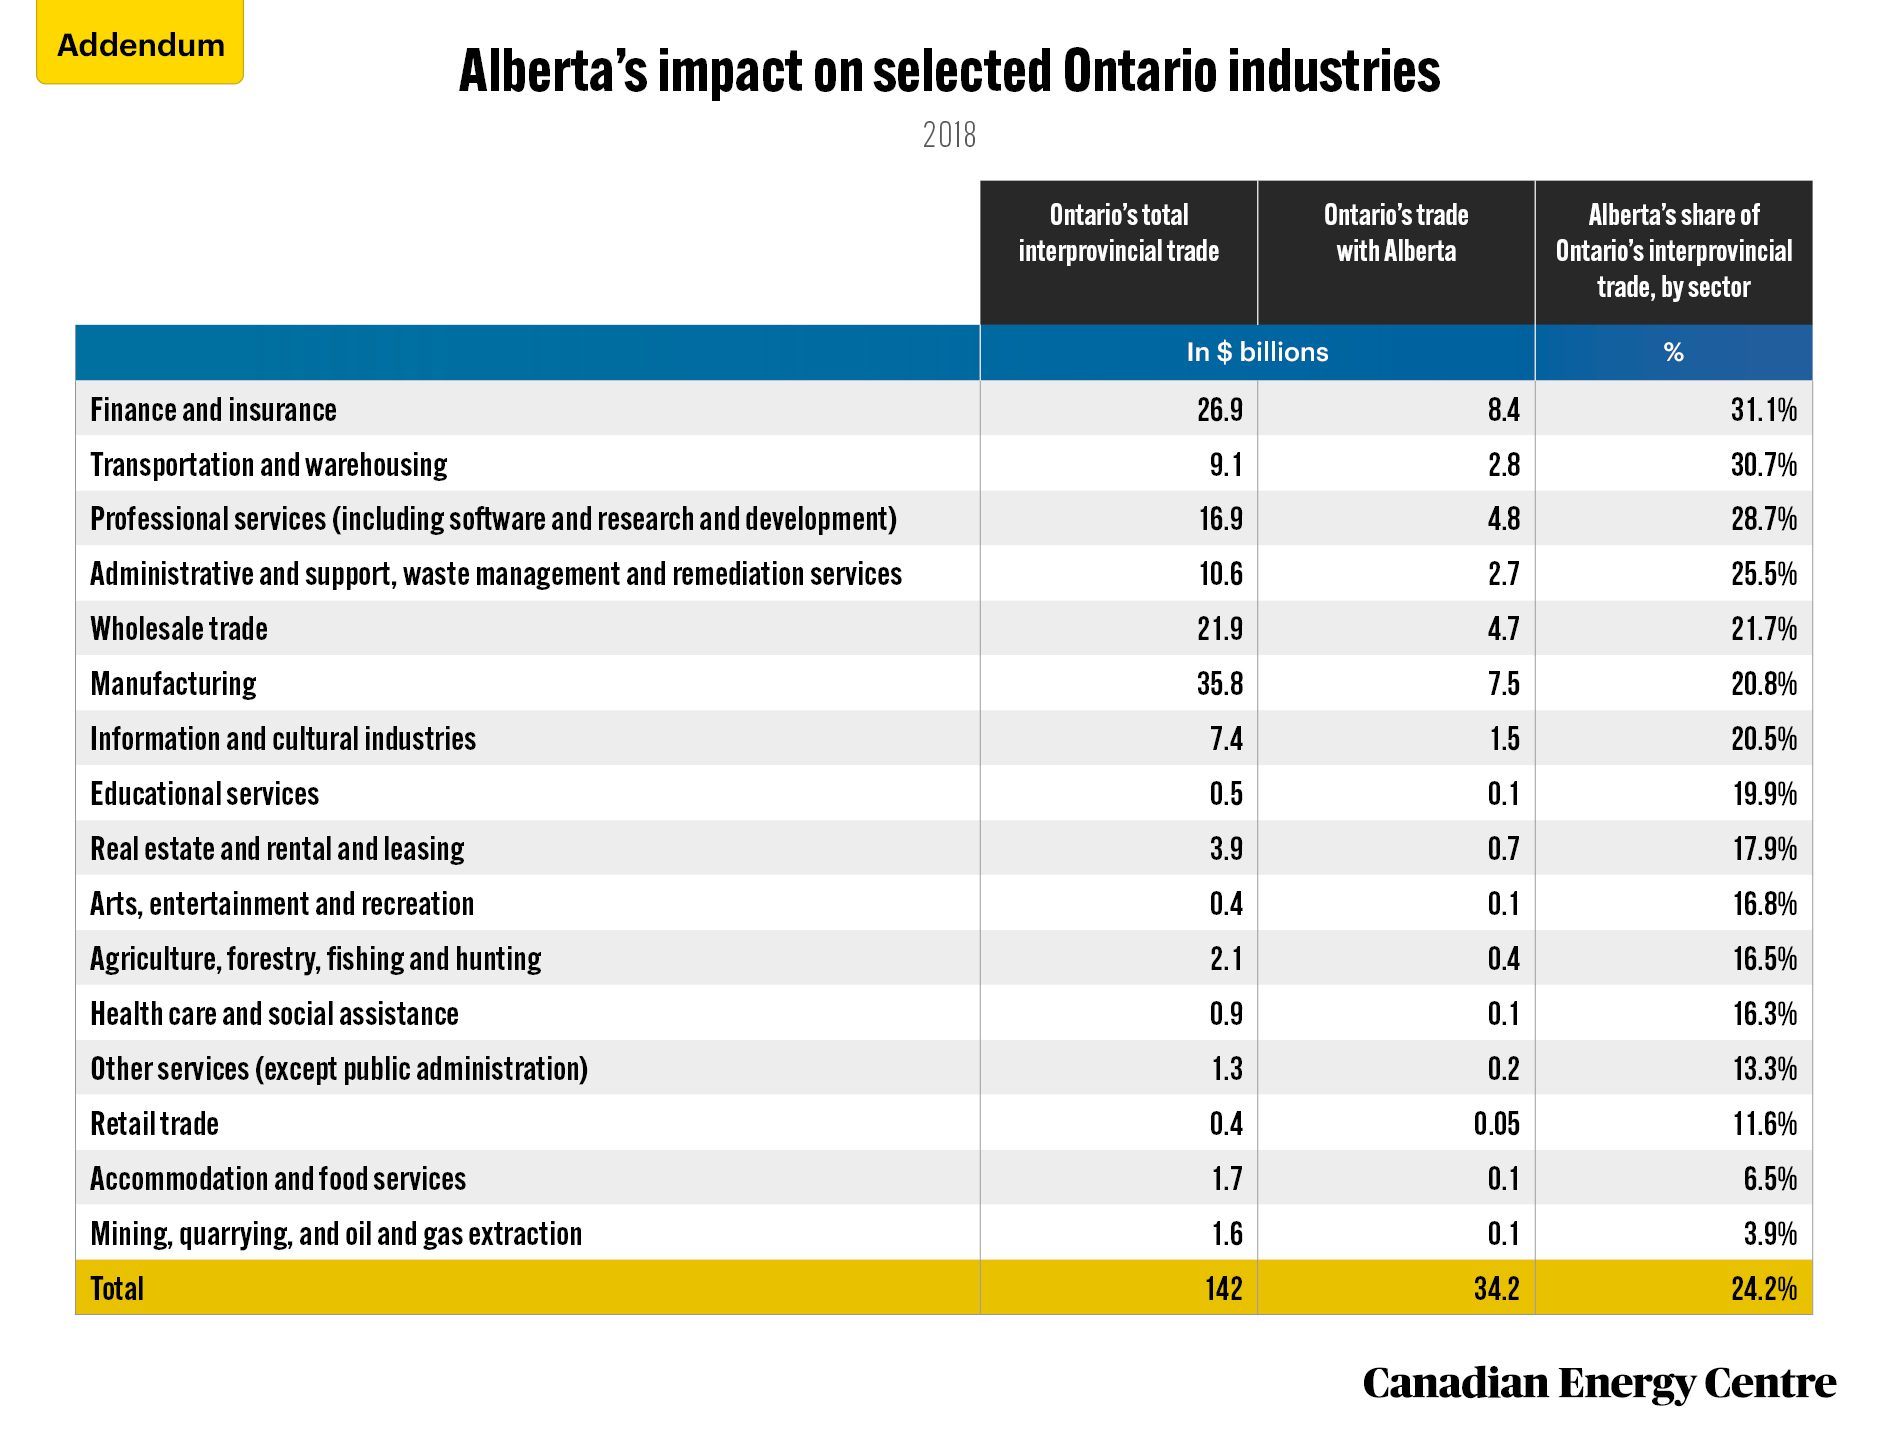
Source: Authors’ calculations from Statistics Canada, Table 12-10-0088-01.
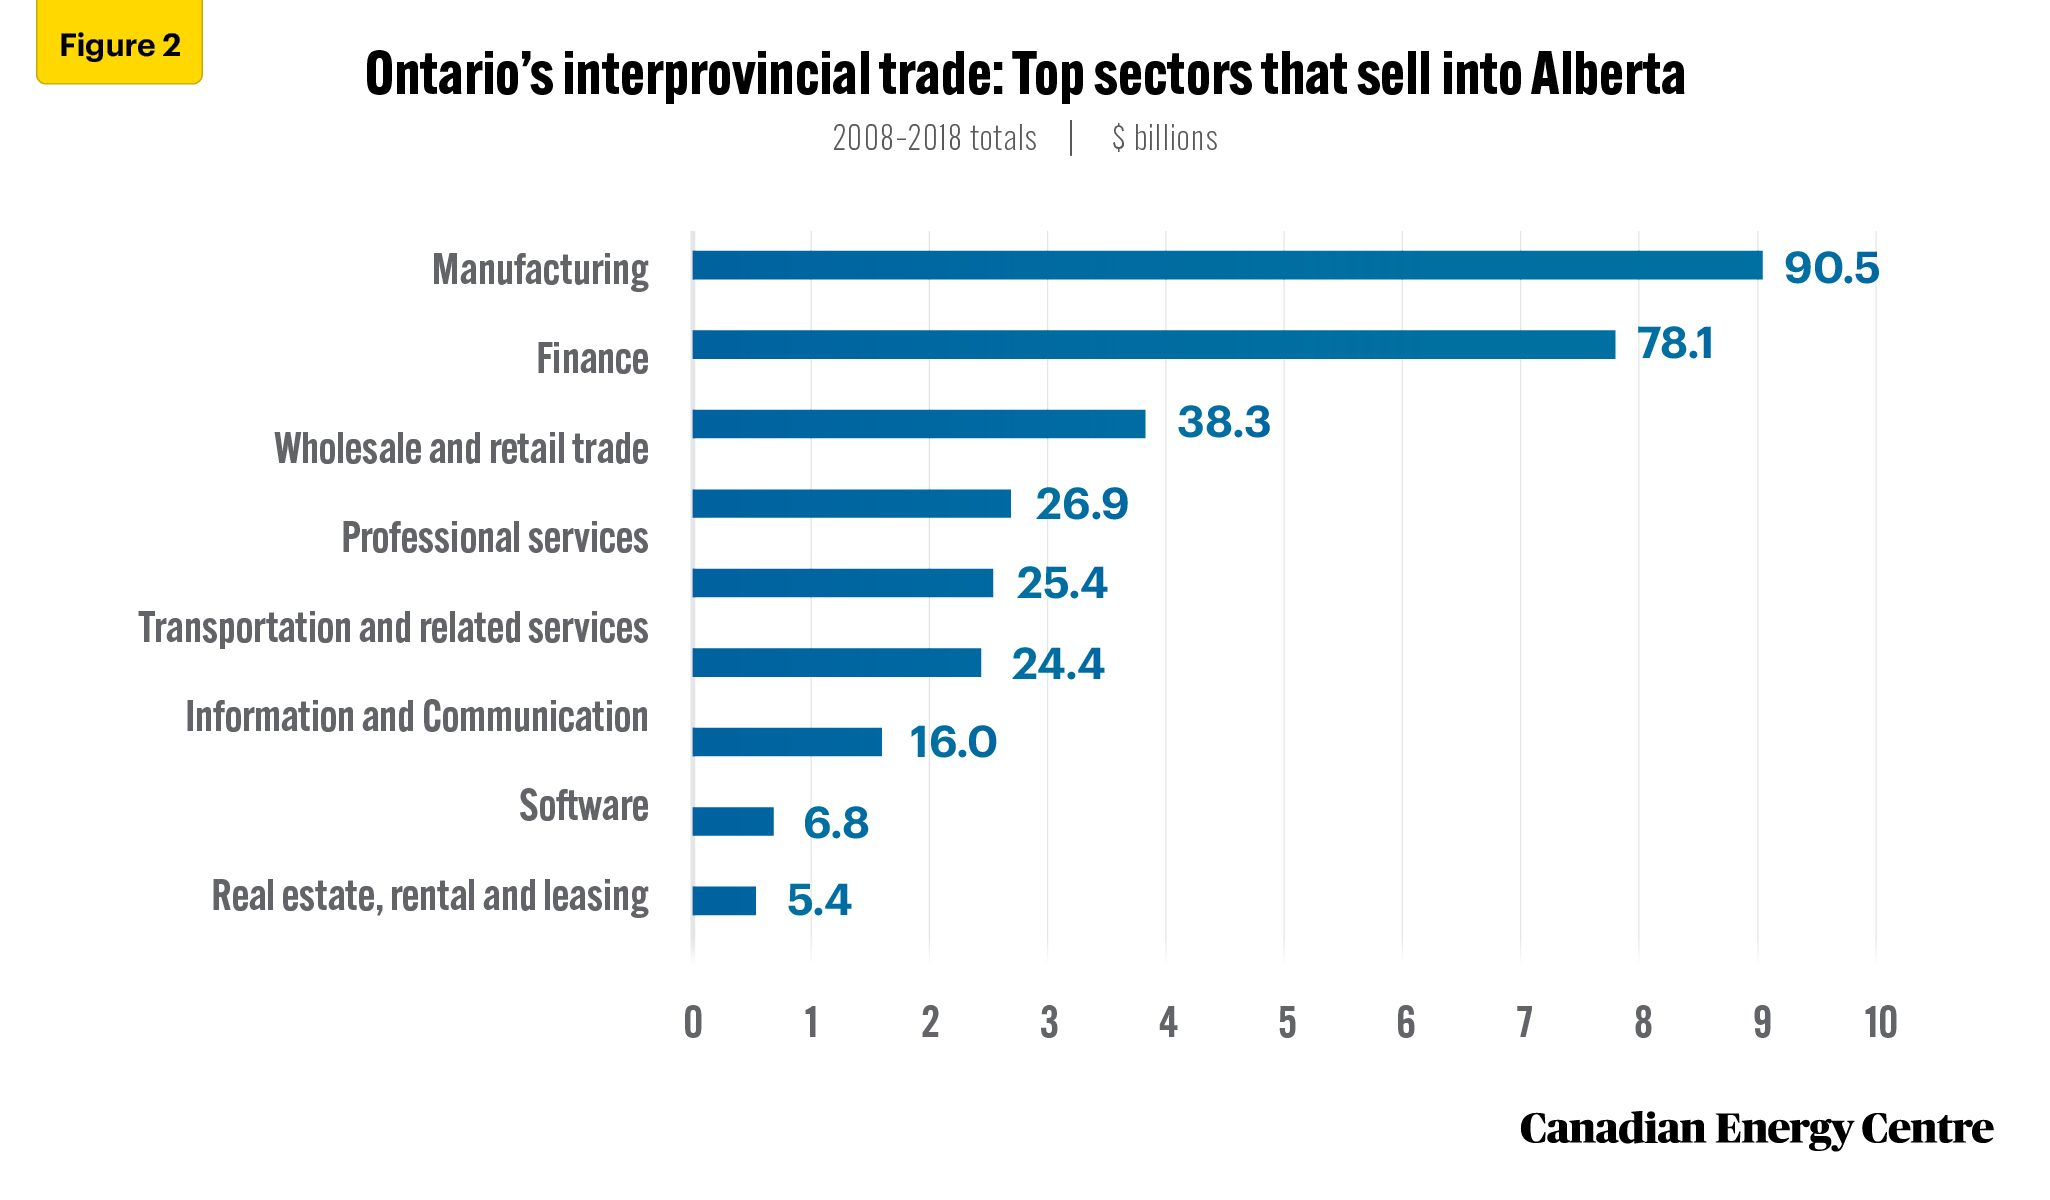
2008-2018 total: $326.8 billion worth of goods and services from Ontario
Ontario has benefited from the growth in Alberta’s oil and gas sector and the purchase of goods and services from Ontario by Alberta-based residents, businesses, and governments. Between 2008 and 2018 inclusive, Alberta imported $326.8 billion worth of goods and services from Ontario. Among other sectors, this includes:
- More than $90.5 billion from the manufacturing sector⁴;
- $78.1 billion from the finance and insurance industry;
- $26.9 billion from the professional services sector; and
- $6.8 billion from the software industry.
Ontario’s top 5 sectors sold $259.2 billion worth of goods and services into Alberta between 2008 and 2018 inclusive (see Figure 2).
4. See Definition list at the end of this publication for the list of products and services included.
Sources: Authors’ calculations from Statistics Canada, Table 12-10-0088-01.
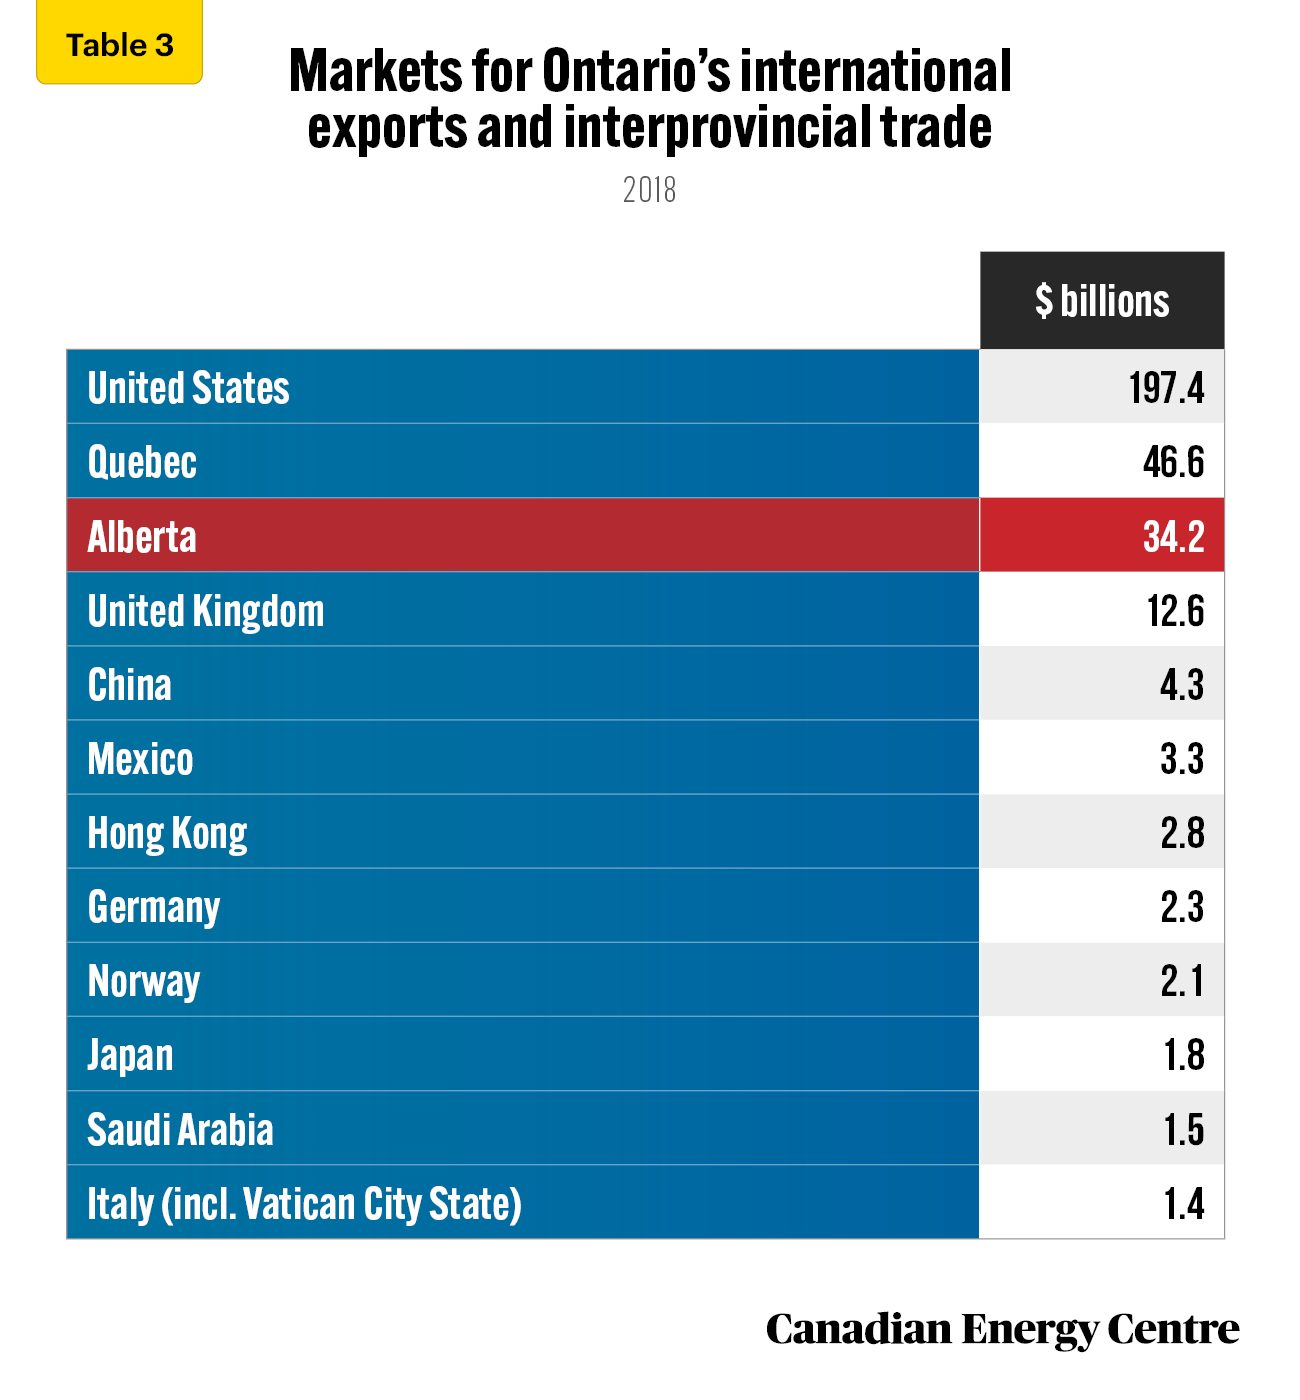
Alberta is Ontario’s third largest export market after the United States and Quebec
Ontario’s interprovincial trade with Alberta was worth $34.2 billion in 2018. That was behind only the United States (over $197 billion) and Quebec ($46.6 billion) and ahead of international markets such as the United Kingdom ($12.6 billion), China ($4.3 billion), and Mexico ($3.3 billion), among others (see Table 3).
Sources: Government of Canada, trade data online, and authors’ calculation derived from Statistics Canada, Table 12-10-0088-01.
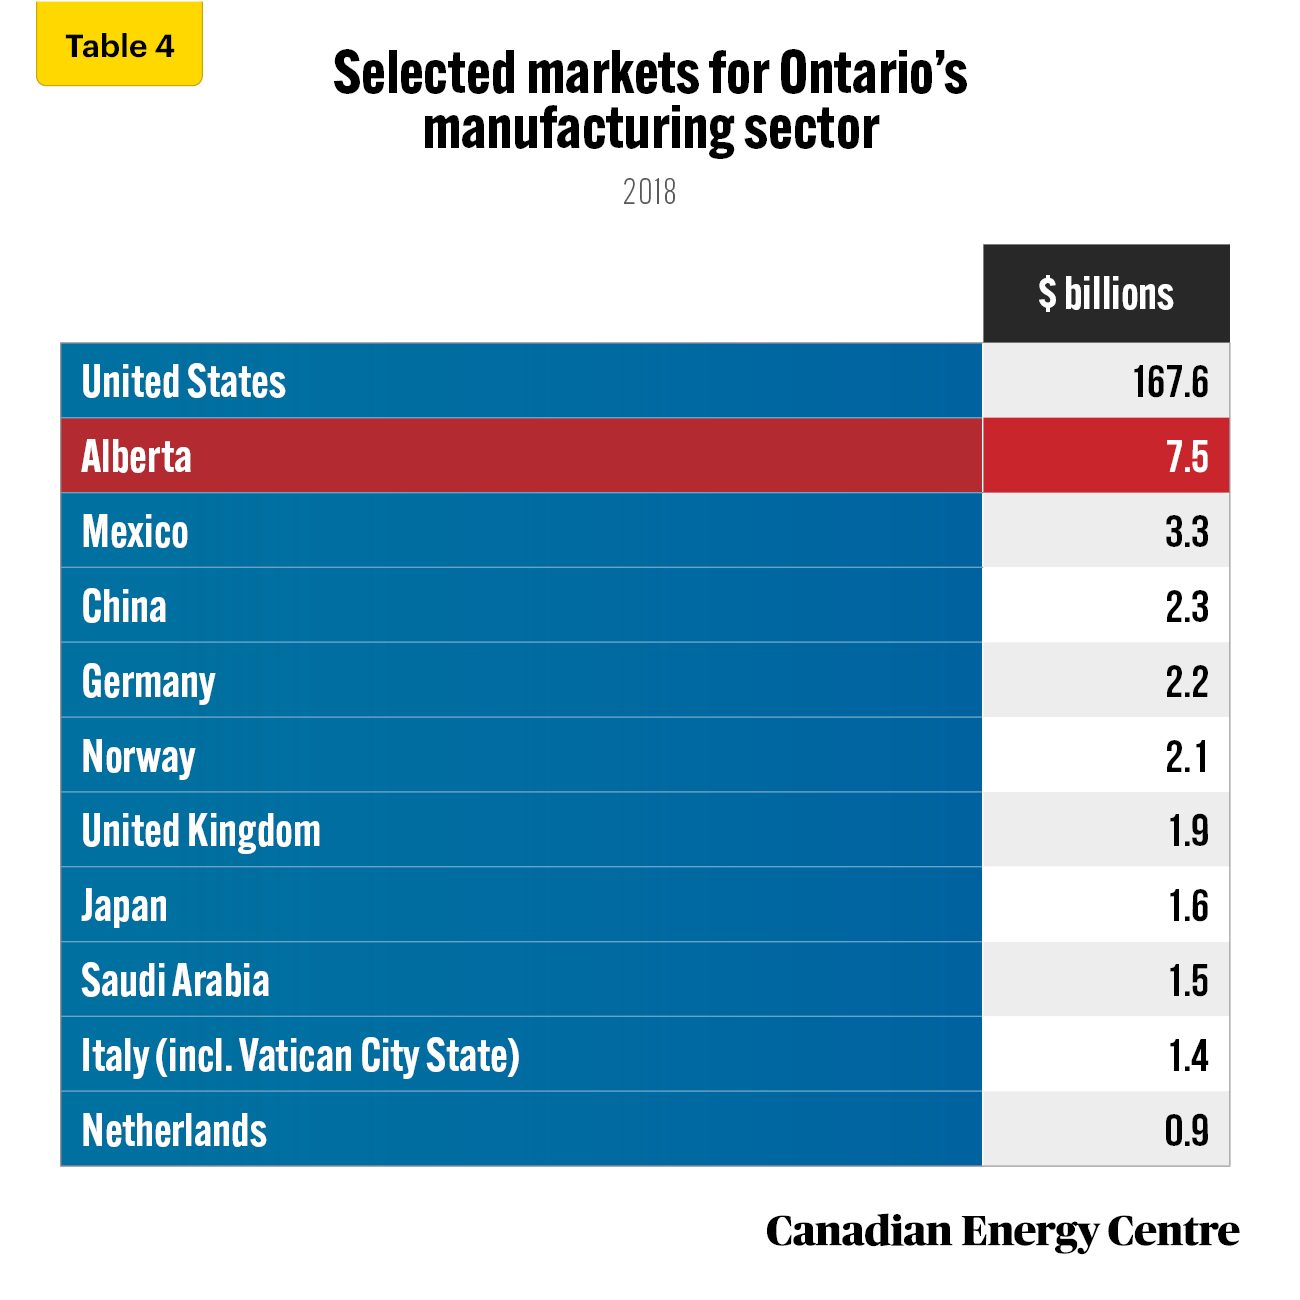
Alberta and Ontario’s manufactured goods
In 2018, Ontario’s manufacturing sector exported nearly $7.5 billion worth of goods and services to Alberta, about 21 per cent of the industry’s total value of interprovincial trade (see Table 4). That was significantly less than Ontario’s exports to the United States (nearly $168 billion), but ahead of international destinations for Ontario’s manufactured exports including Mexico ($3.3 billion), China ($2.3 billion), and Germany ($2.2 billion), among others.
Sources: Government of Canada, trade data online, and authors’ calculation derived from Statistics Canada, Table 12-10-0088-01.
Conclusion
The oil and gas sector in Canada has a significant impact on Ontario’s export sectors, directly and indirectly, as does the purchase of goods and services by citizens, businesses, and governments in the province where the oil and gas sector is concentrated, i.e., by those in Alberta.
Notes
This CEC Fact Sheet was compiled by Ven Venkatachalam and Lennie Kaplan at the Canadian Energy Centre (www.canadianenergycentre.ca). All percentages in this report are calculated from the original data, which can run to multiple decimal points. They are not calculated using the rounded figures that may appear in charts and in the text, which are more reader friendly. Thus, calculations made from the rounded figures (and not the more precise source data) will differ from the more statistically precise percentages we arrive at using source data. The authors and the Canadian Energy Centre would like to thank and acknowledge the assistance of Philip Cross in reviewing the data and research for the initial edition of this Fact Sheet.
References (all links live as of December 13, 2022)
Statistics Canada (2020), Supply and Use Tables, 2017: 15-602-X_2017 <https://bit.ly/2XHbDUe>; Statistics Canada (2021a), Supply and Use Tables, custom tabulation; Statistics Canada (2021b), Table 17-10-0057-01: Projected population, by projection scenario, age and sex, as of July 1 <https://bit.ly/2W8bzfN>; Statistics Canada (2021c), Table 12-10-0088-01: Interprovincial and international trade flows, basic prices, summary level <https://bit.ly/3EN0aTR>; The American Petroleum Institute (July 2017), Impacts of the Natural Gas and Oil Industry on the US Economy in 2015<https://bit.ly/2EKrJTT>; Government of Canada (October 2021), Trade Data Online <https://bit.ly/2EMswnj>.
Definitions
The oil and gas sector is defined as the sum of oil and gas extraction and oil and gas investment. Oil and gas extraction is defined by NAICS subsector 211. It comprises establishments primarily engaged in operating oil and gas field properties. Such activities may include exploration for crude petroleum and natural gas; drilling, completing, and equipping wells; and all other activities in the preparation of oil and gas up to the point of shipment from the producing property. This subsector includes the production of oil, the mining and extraction of oil from oil shale and oil sands, and the production of gas and hydrocarbon liquids through gasification. Oil and gas investment includes capital expenditures on construction, machinery and equipment, and exploration by the oil and gas extraction industry. GDP, or Gross Domestic Product, also referred to as gross value added at basic prices, is the sum of the market values, or prices, of all final goods and services produced in an economy. Output consists primarily of the value of goods and services produced by an industry. Jobs include employee jobs (full-time, part-time, and seasonal) and self-employed jobs. The direct impact of oil and gas extraction is the effects directly attributed to the industry’s production. The direct impact of oil and gas investment is the deliveries by domestic industries to satisfy capital expenditures by the oil and gas extraction industry. Direct impact is measured in terms of GDP, output, and jobs within the oil and gas sector. The indirect impact covers upstream economic activities associated with supplying intermediate inputs (the current expenditures on goods and services used in the production process) to the directly affected industries. The indirect impact is measured in terms of GDP, output, and jobs through the oil and gas sector supply chain, including other key sectors of an economy—in the case of this paper, Ontario’s economy. We use the American Petroleum Institute definition of the oil and natural gas sector to quantify the goods and services purchased by the sector and the wages paid by the sector. The sector includes conventional oil and gas extraction and non-conventional oil extraction. Support activities for oil and gas extraction include oil and gas engineering construction, petroleum refineries, petroleum and coal product manufacturing (except petroleum refineries); petroleum product wholesaler-distributors, gasoline stations, crude oil and other pipeline transportation, and pipeline transportation of natural gas. The manufacturing sector includes food and non-alcoholic beverages; alcoholic beverages and tobacco products; textile products, clothing, and products of leather and similar materials; wood products; wood pulp, paper, paper products, and paper stock; printed products and services; refined petroleum products (except petrochemicals); chemical products; plastic and rubber products; non-metal mineral products; primary metal products; fabricated metal products; industrial machinery; computers and electronic products; electrical equipment, appliances, and components; transportation equipment; motor vehicle parts; furniture and related products; and other manufactured products.
Creative Commons Copyright
Research and data from the Canadian Energy Centre (CEC) is available for public usage under creative commons copyright terms with attribution to the CEC. Attribution and specific restrictions on usage including non-commercial use only and no changes to material should follow guidelines enunciated by Creative Commons here: Attribution-NonCommercial-NoDerivs CC BY-NC-ND.