To sign up to receive the latest Canadian Energy Centre research to your inbox email: [email protected]
Download the PDF here
Download the charts here
Definitions and Terminology
CO2: Carbon dioxide, or CO2, is a heat-trapping (greenhouse) gas, which is released through human activities such as deforestation and the burning of fossil fuels and through many natural processes such as decomposition of organic matter and phenomena such as volcanoes and forest fires.
CO2e: Carbon dioxide equivalent, or CO2e, is a term that describes different greenhouse gases in a common unit. For any quantity and type of greenhouse gas, CO2e signifies the amount of CO2 that would have the equivalent global warming impact.
Emissions intensity: Emissions intensity is the emission rate of a given pollutant relative to the intensity of a specific activity or industrial production process. Examples include grams of carbon dioxide released per megajoule of energy produced, or the ratio of greenhouse gas emissions produced to gross domestic product (GDP). Emissions intensities are used to derive estimates of air pollutants or greenhouse gas emissions based on the amount of fuel combusted. Emissions intensities may also be used to compare the environmental impact of different fuels or activities.
GDP: Gross domestic product, or GDP, is the total value of goods produced and services provided in a country during one year.
GHG: Greenhouse gas, or GHG, emissions are produced when hydrocarbons, such as oil and natural gas, are burned. GHGs include carbon dioxide (CO2), methane, nitrous oxide, and ozone, all of which contribute to climate change.
Kilograms (kg) of CO2e per barrel: A measurof emissions intensity, defined as absolute greenhouse gases emitted in kilograms divided by the number of barrels of oil.
Kilograms (kg) CO2e per purchasing power parity (PPP) in 2015 $US of GDP: A measure of emissions intensity used to compare fuel combustion by country and industrial sector, defined as absolute greenhouse gases emitted in kilograms divided by gross domestic product (GDP), converted to international dollars, with the international dollar having the same purchasing power as a US dollar has in the United States.
MT of CO2e: Megatonne, or MT, of carbon dioxide equivalents is the metric unit equivalent to 1 million tonnes of common units of greenhouse gases.
MT of CO2e per billion dollars of GDP: A measure of emissions intensity, defined as the absolute amount of greenhouse gases emitted in megatonnes divided by each billion dollars of gross domestic product (GDP).
PPP: Purchasing Power Parity, or PPP, is gross domestic product (GDP) converted to international dollars using purchasing power parity rates. An international dollar has the same purchasing power over GDP as a US dollar has in the United States.
Terajoules: A terajoule, or TJ, is a unit of energy in the International System of Units (SI). Tera denotes a factor of a trillion, so there are 1,000,000,000,000 joules in a terajoule.
Tonnes of CO2e per capita or per person: A measure of emissions intensity to compare countries, defined as absolute greenhouse gases emitted in tonnes divided by the population of a country.
Tonnes of CO2e per TJ of energy used: A measure of emissions intensity to compare industrial sectors, defined as absolute greenhouse gases emitted in tonnes divided by the amount of fossil fuels used that can be attributed to the operations of the establishments of a specific industrial sector.
Tonnes of CO2e per million dollars of GDP: A measure of emissions intensity to compare countries, defined as absolute greenhouse gases emitted in tonnes divided by each million U.S. dollars of gross domestic product.
Tonnes of CO2e per barrel: A measure of oil emissions intensity, defined as absolute greenhouse gases emitted in tonnes divided by the number of barrels of oil.
Executive Summary
There has been considerable debate in the media and in policy circles about the absolute greenhouse gas (GHG) emissions arising from the activities of Canada’s oil and gas sector, but little attention has been paid to the reductions in GHG emissions intensity that have occurred within the sector over the past two decades.
In this CEC Research Brief, we update trends in emissions intensity in Canada generally, and in the oil and gas sector specifically, over nearly the past two decades, and compare Canada’s emissions intensity performance with that of a number of energy-producing and energy consuming countries.
Methodology for measuring greenhouse gas emissions intensity
GHG emissions occur over the entire life of a hydrocarbon fuel, from its production, refining, transport to markets, combustion, and consumption. The production, refining, and marketing phases make up a relatively small share of overall emissions. In fact, final combustion of refined petroleum products accounts for fully 70 to 80 per cent of lifecycle emissions (IHS Markit, 2020).
Emission intensity is determined by dividing the amountof absolute GHG emissions by some unit of output, such as GDP, energy used, population, or barrel of crude oil produced.
Four key emissions intensity measures
This CEC Research Brief examines the trends of four key measures of emissions intensity:
1. Ratio of emissions produced to gross domestic product (GDP), sometimes expressed in terms of purchasing power parity (PPP) in US dollars.
2. Ratio of emissions produced per person
3. Ratio of emissions released per unit of energy used
4. Ratio of emissions per barrel of crude oil produced
Key Findings
On the basis of data drawn from sources that include Statistics Canada, the International Energy Agency (IEA), Climate Watch, BMO Capital Markets, IHS Markit, and others, Canada’s oil and gas sector has clearly been reducing its GHG emissions intensity over the past two decades.
Canada’s GHG emissions per person, per unit of GDP, per unit of energy used, and per barrel of crude oil produced, have all declined noticeably over the past two decades. Canada is making real and measurable progress. The key findings are as follows:
Canada’s emissions intensity has fallen by 30 per cent since 2000
- Between 2000 and 2019, GHG emissions intensity in Canada has fallen from 0.5 megatonnes of carbon dioxide equivalent (MT of CO2e) per billion dollars of GDP to 0.35 MT, a decline of 30 per cent.
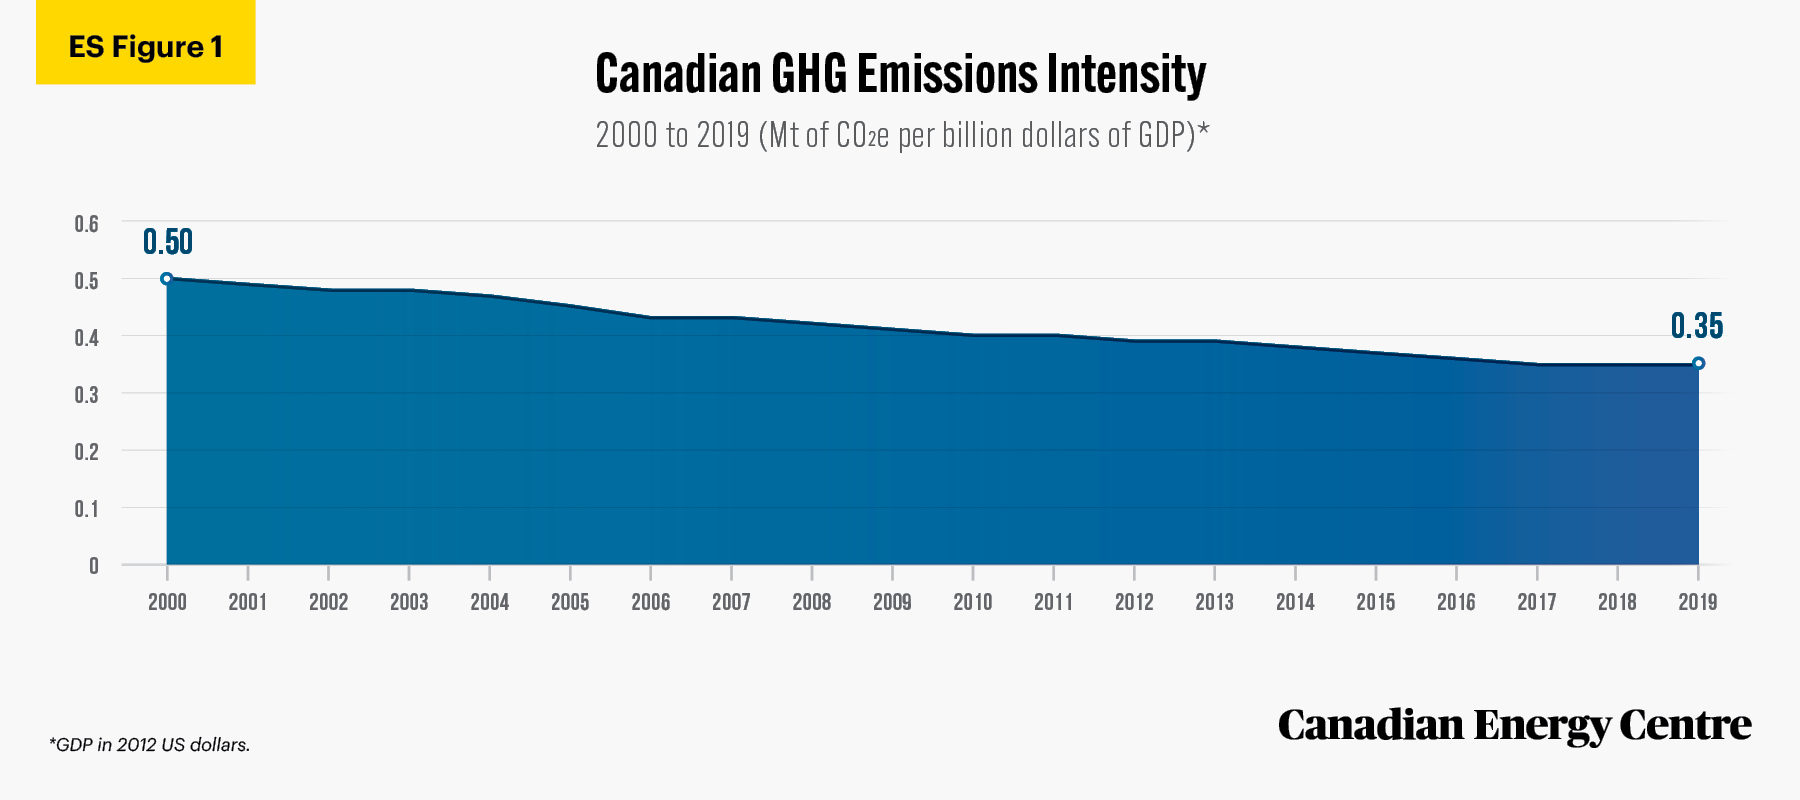
Source: Environment and Climate Change Canada (2021b).
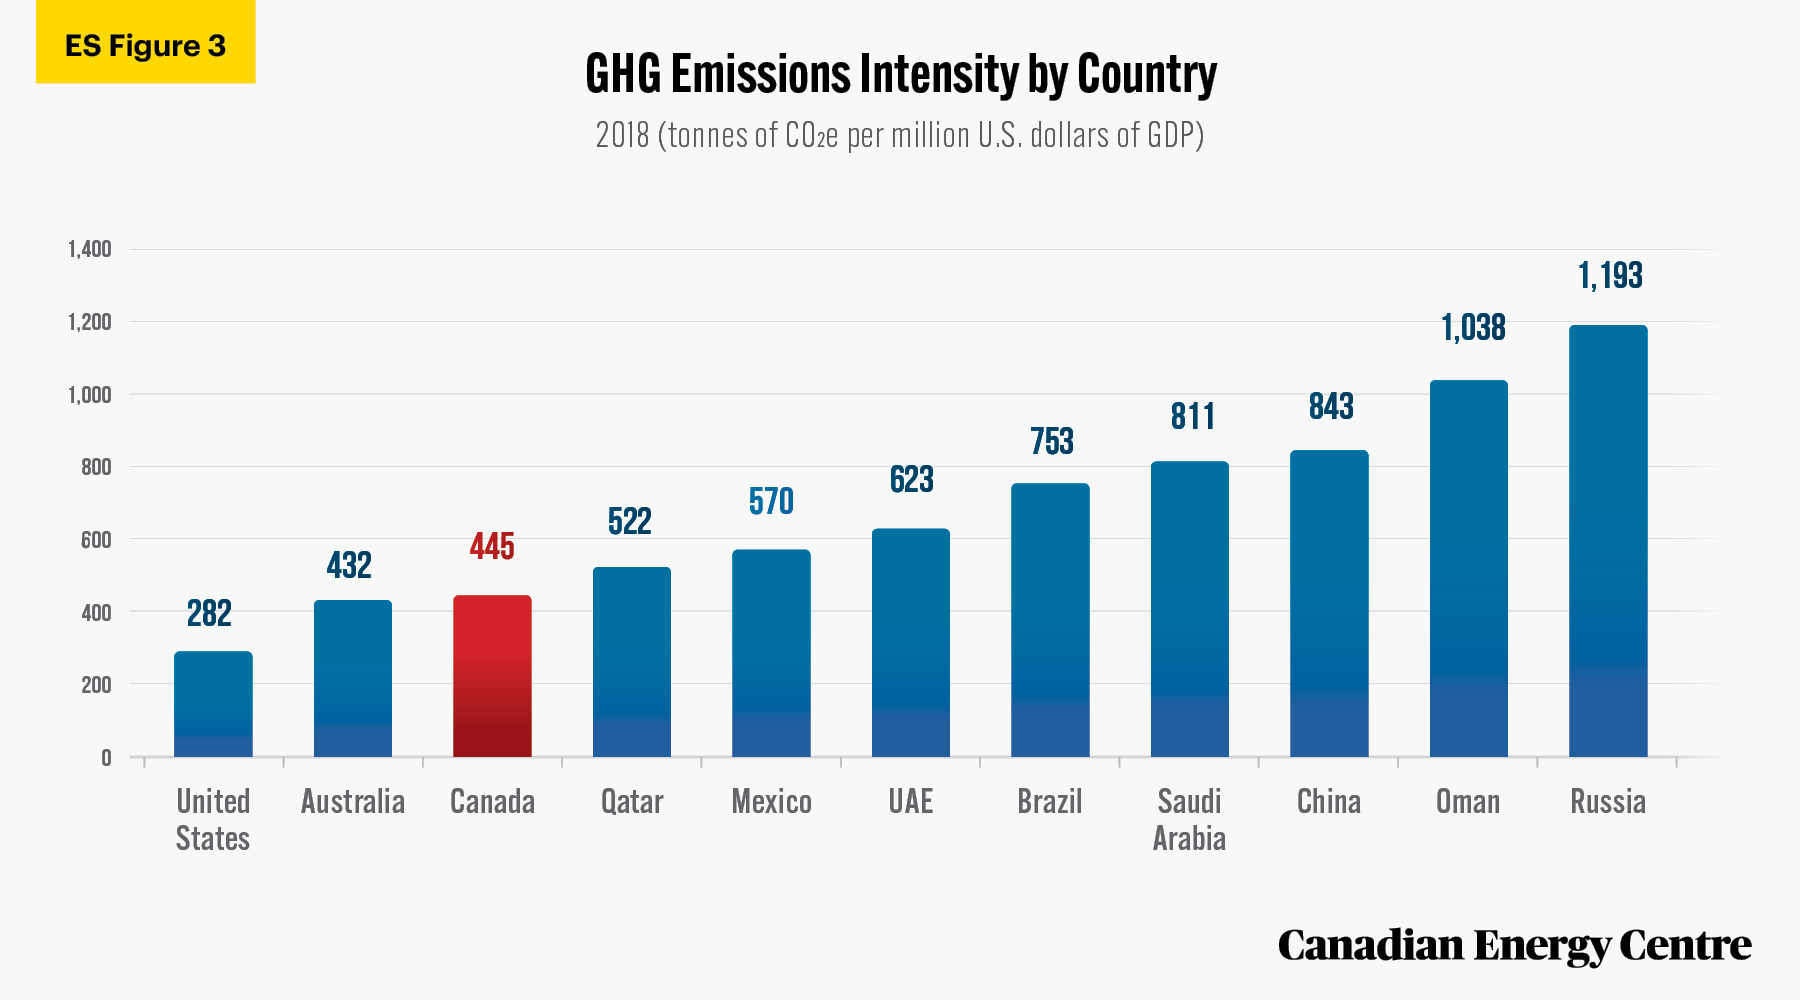
Canada’s emissions intensity is lower than that of a number of other energy-producing and energy-consuming nations
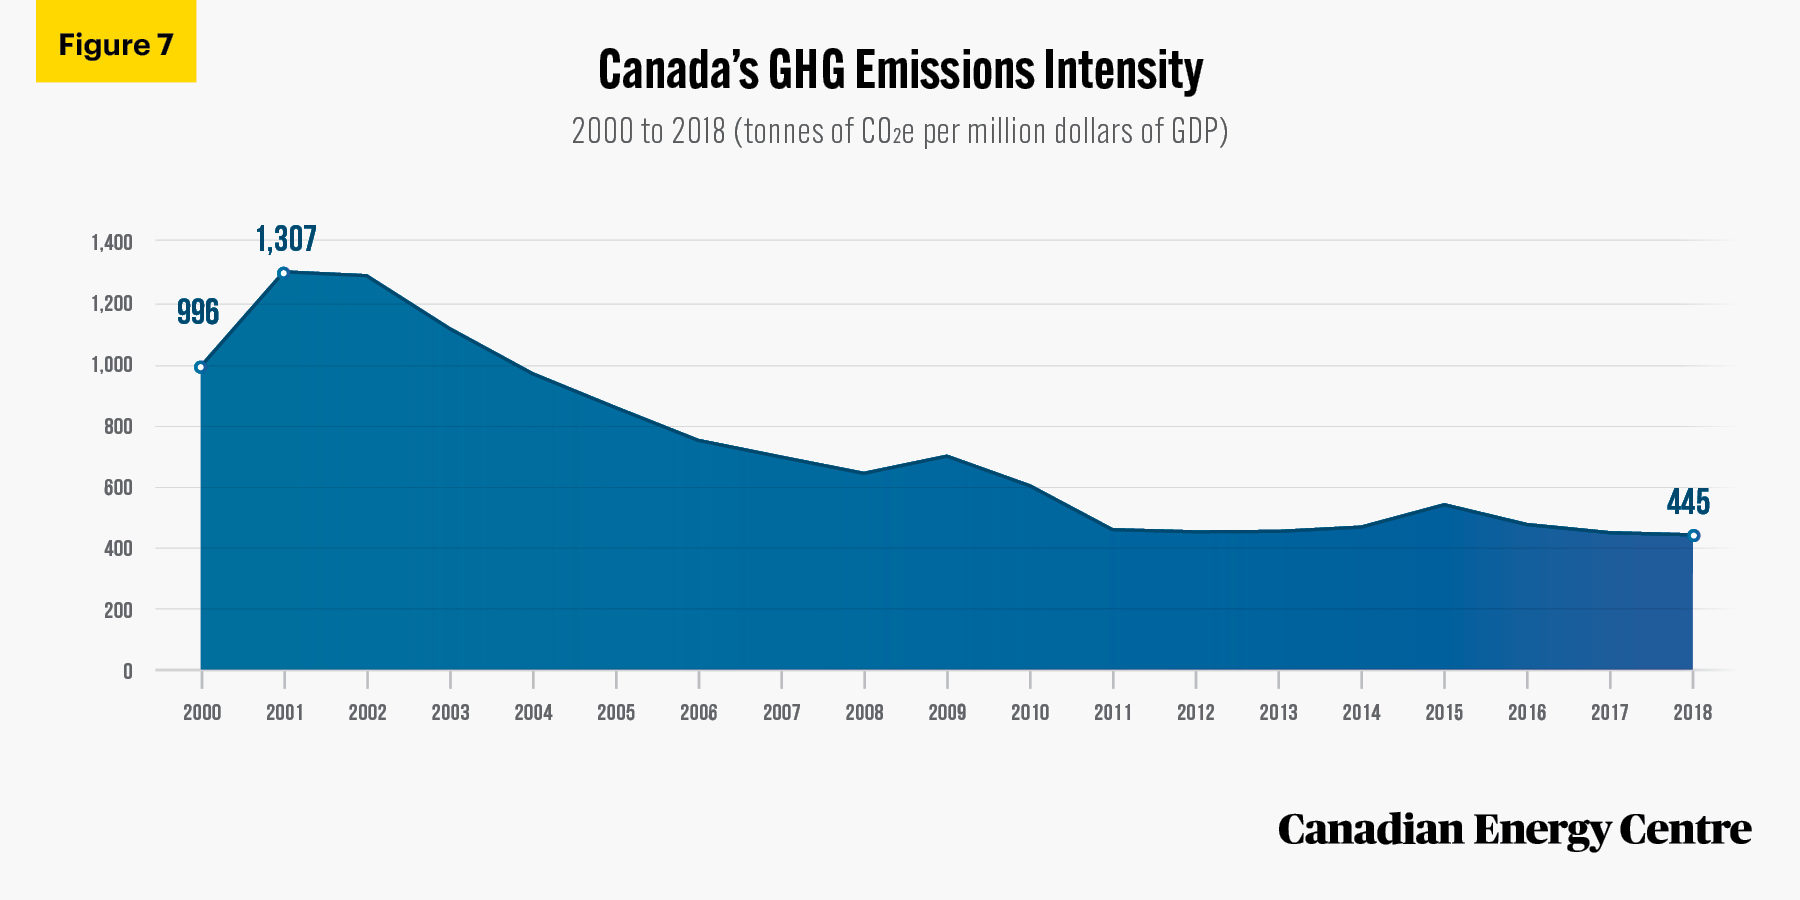
- Between 2000 and 2018, Canada’s GHG emissions intensity fell from 996 tonnes of CO2e per million dollars of GDP to 445 tonnes, a decline of over 55 per cent.
- As of 2018, Canada’s GHG emissions intensity of 445 tonnes of CO2e per million dollars of GDP is lower than many other energy producing and energy-consuming countries, such as China, India, Brazil, Oman, Russia, Saudi Arabia, Mexico, and the United Arab Emirates.
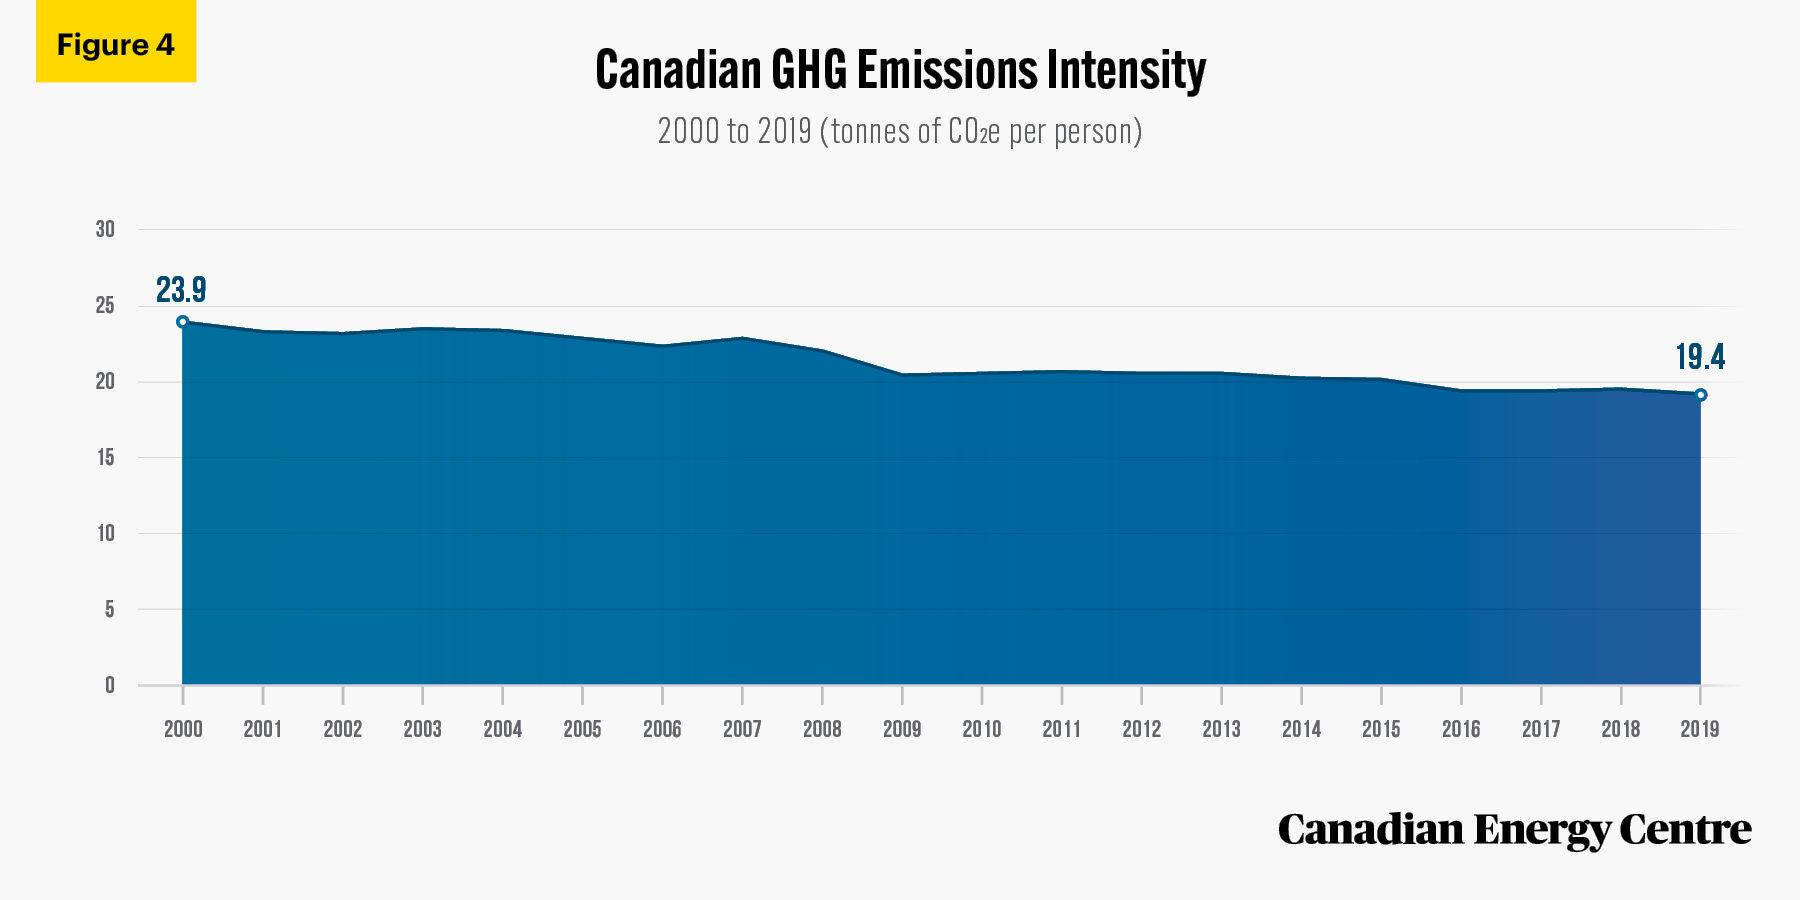
- Between 2000 and 2019, Canada’s GHG emissions intensity fell from 23.9 tonnes of CO2e per person to 19.4 tonnes, a decline of nearly 19 per cent.
- As of 2018, Canada’s GHG emissions intensity per person is lower than Australia, Qatar, and the United Arab Emirates, but higher than the United States, Russia, China, and Mexico.
Source: Climate Watch (2021).
Source: Climate Watch (2021).
Canadian mining, quarrying, and oil and gas extraction sector emissions intensity compares favourably with a number of other industrial sectors in Canada
- The current emissions intensity of the Canadian mining, quarrying, and oil and gas extraction sector compares favourably to that of other industrial sectors in Canada.
- In 2018, the emissions intensity of the mining, quarrying, and oil and gas extraction sector in Canada was 62.4 tonnes of CO2e per terajoule (TJ) of energy used in extraction. This compares to 66.1 tonnes used in the construction sector, 68.4 tonnes used in the iron and steel sector, 70.3 tonnes used in the forestry sector, and 71.2 tonnes used in the cement sector.
Fuel combustion emissions intensity in Canada’s industrial sector is also falling and is comparable with a number of other energy-producing and energy-consuming countries
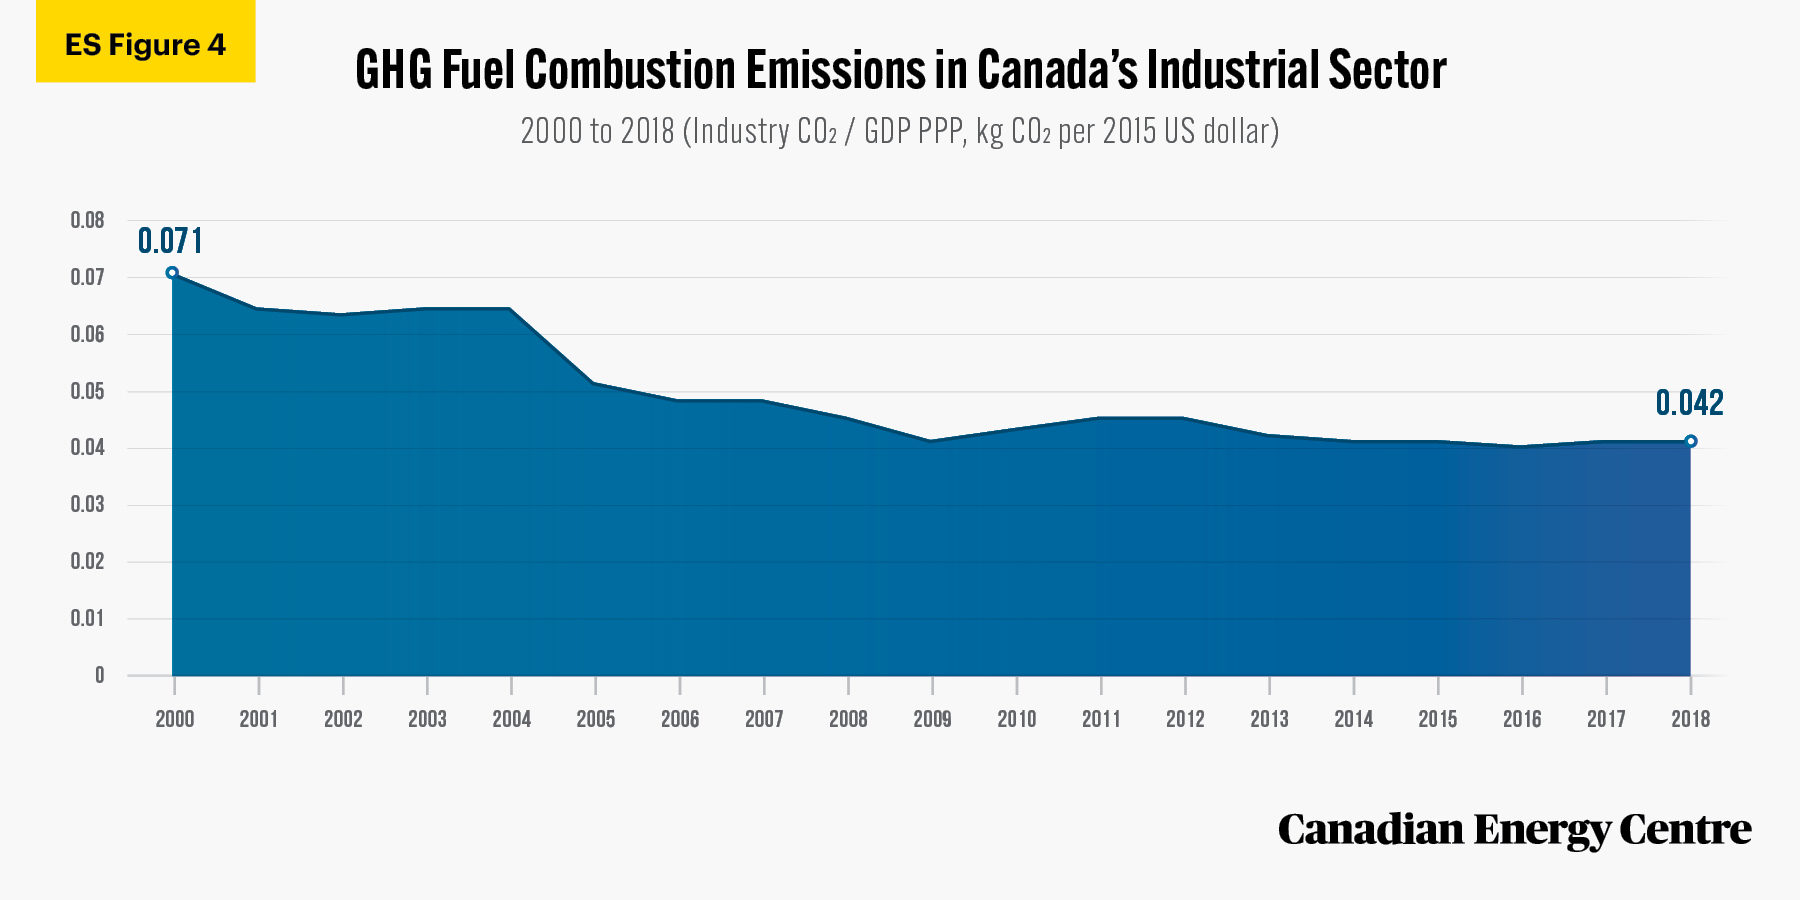
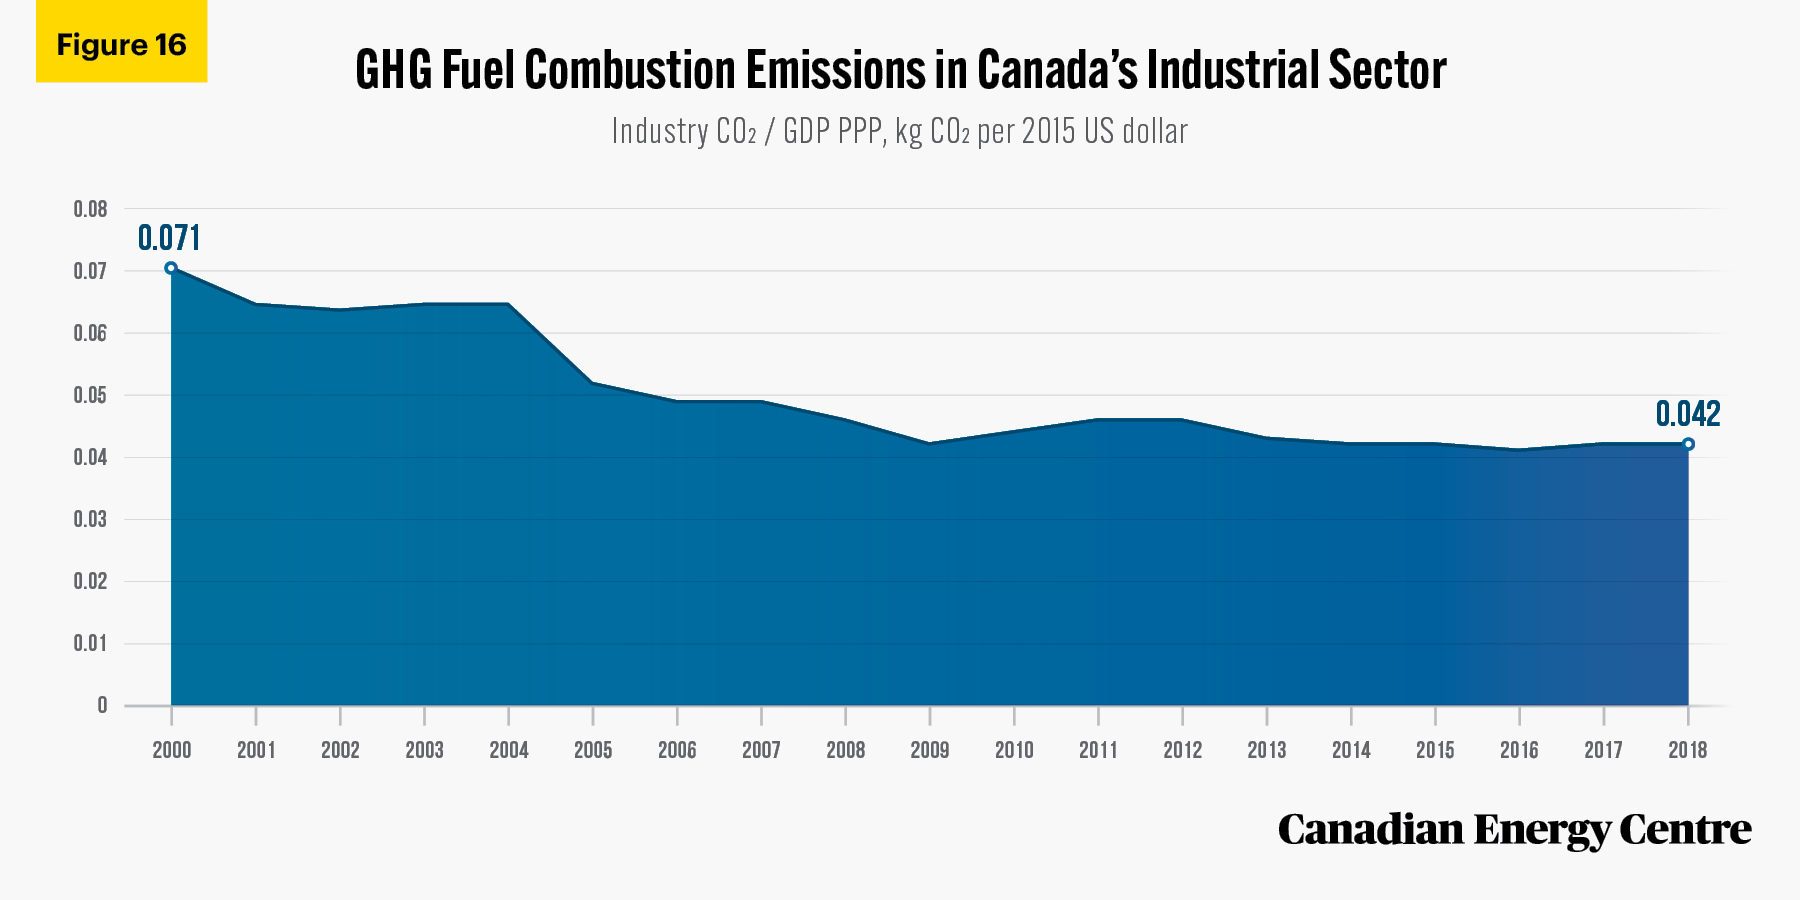
- Between 2000 and 2018, GHG fuel combustion emissions in Canada’s industrial sector fell from 0.071 kg of CO2e per purchasing power parity (PPP) in 2015 US dollars of GDP to 0.042 kg, a decline of 41 per cent.
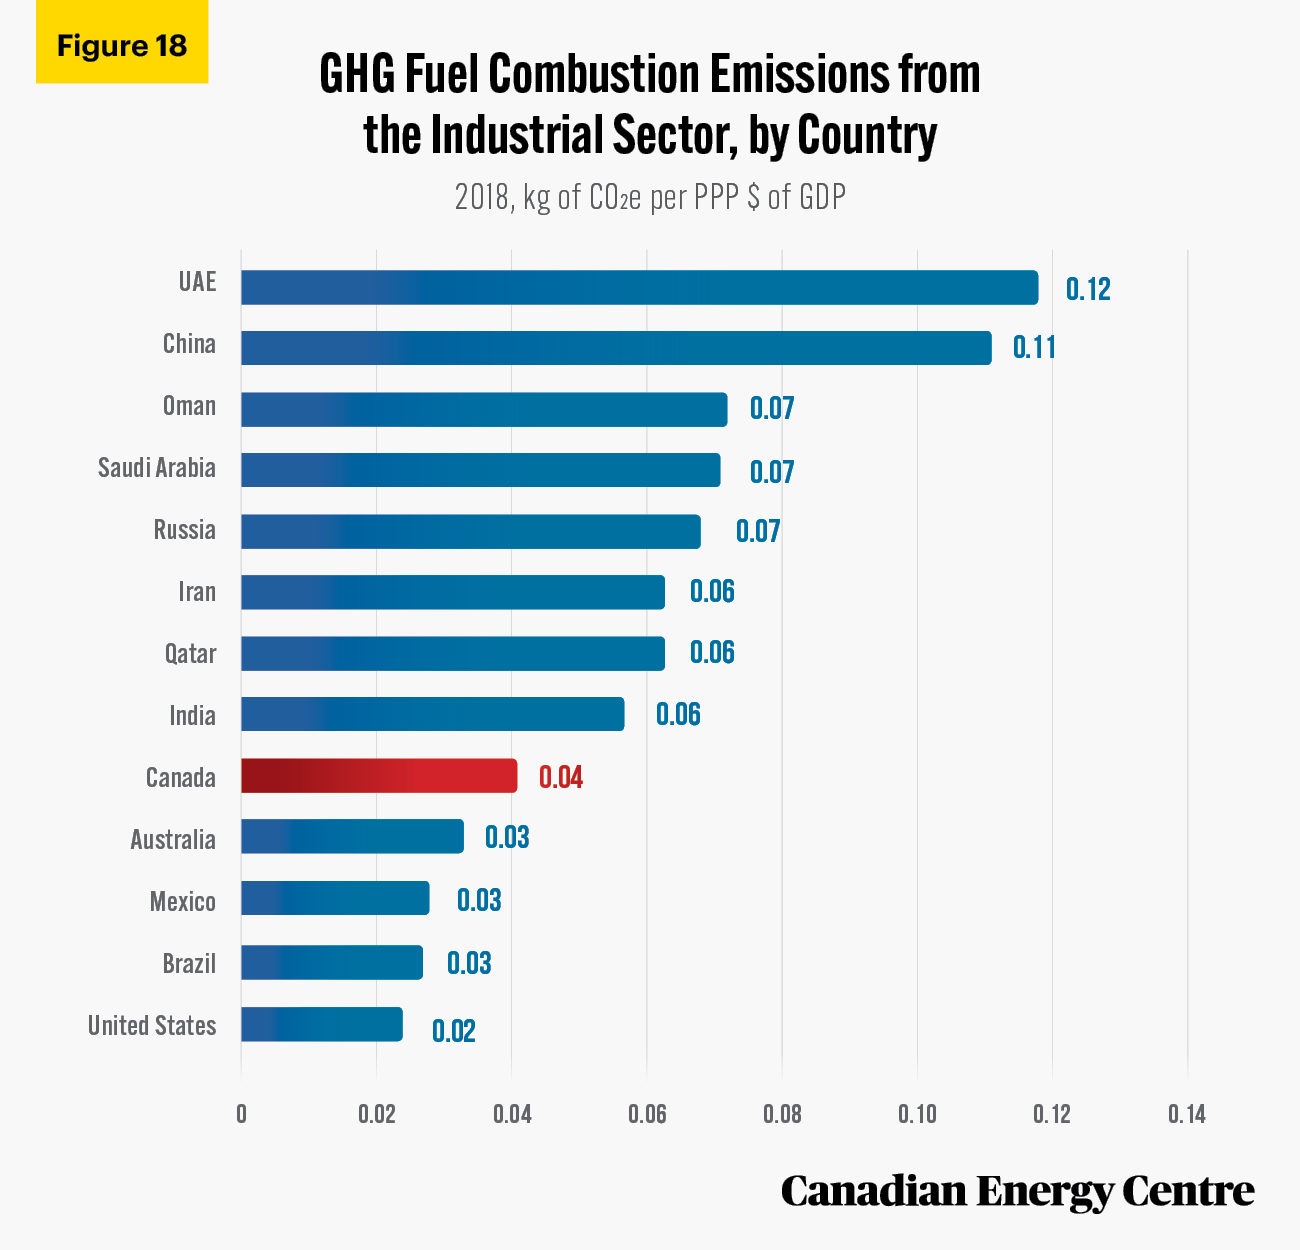
- As of 2018, GHG fuel combustion emissions of 0.042 CO2e per PPP in 2015 US dollars of GDP in Canada’s industrial sector was slightly higher than in the United States, Australia, Mexico and India, but lower than in Oman, China, and Russia.
Source: Climate Watch (2021)
Oil sands emissions intensity has been falling over the past decade
- Between 2011 and 2019, oil sands emissions intensity fell from 0.533 tonnes of CO2e per barrel to 0.417 tonnes of CO2e per barrel, a decline of nearly 22 per cent.
Oil sands sector expected to drive future emissions intensity reductions through 2030 and 2040
- According to IHS Markit, the deployment of commercial and near-commercial technologies and efficiencies could result in a 17 to 27 per cent reduction in the GHG intensity of steam-assisted gravity drainage operations (which accounted for 45 per cent of oil sands supply in 2017) and a 15 per cent to 20 per cent reduction in the GHG intensity of mined oil sands by 2030.
Canada’s GHG Emissions Intensity Record since 2000: An Updated 2021 Analysis
- On a full life-cycle basis (inclusive of emissions from production to combustion), these upstream intensities would place steam-assisted gravity drainage operations within 2 to 4 per cent and mined oil sands within 5 to 7 per cent of the average for crude oil refined in the United States by 2030 (IHS Markit, 2018).
- The base emissions forecast from BMO Capital Markets implies that average oil sands emissions intensity could improve by at least another 17 per cent, or about 1.7 per cent per year, by 2030.
- Assuming the Canadian mining, quarrying, and oil and gas extraction sector uses promising emerging technologies, BMO Capital Markets anticipates average emissions intensity will improve another 25 to 30 per cent overall by 2040, to about 55 kg per barrel.
Analysis
Part I: Evaluating GHG emissions intensity trends in Canada
Canada’s emissions levels are small on a worldwide basis
Canada’s contribution to worldwide greenhouse gas (GHG) emissions is small compared to other key energy-producing and energy consuming countries. As of 2018, Canada’s greenhouse gas emissions were 763 Mt of CO2e, comprising just 1.6 per cent of worldwide GHG emissions of 47,261 Mt of CO2e. This puts Canada’s emissions levels just above those of Australia (1.3 per cent) and well below those of Russia (4.2 per cent), the United States (12.3 per cent), and China (24.8 per cent) (see Figure 1) (Climate Watch, 2021).
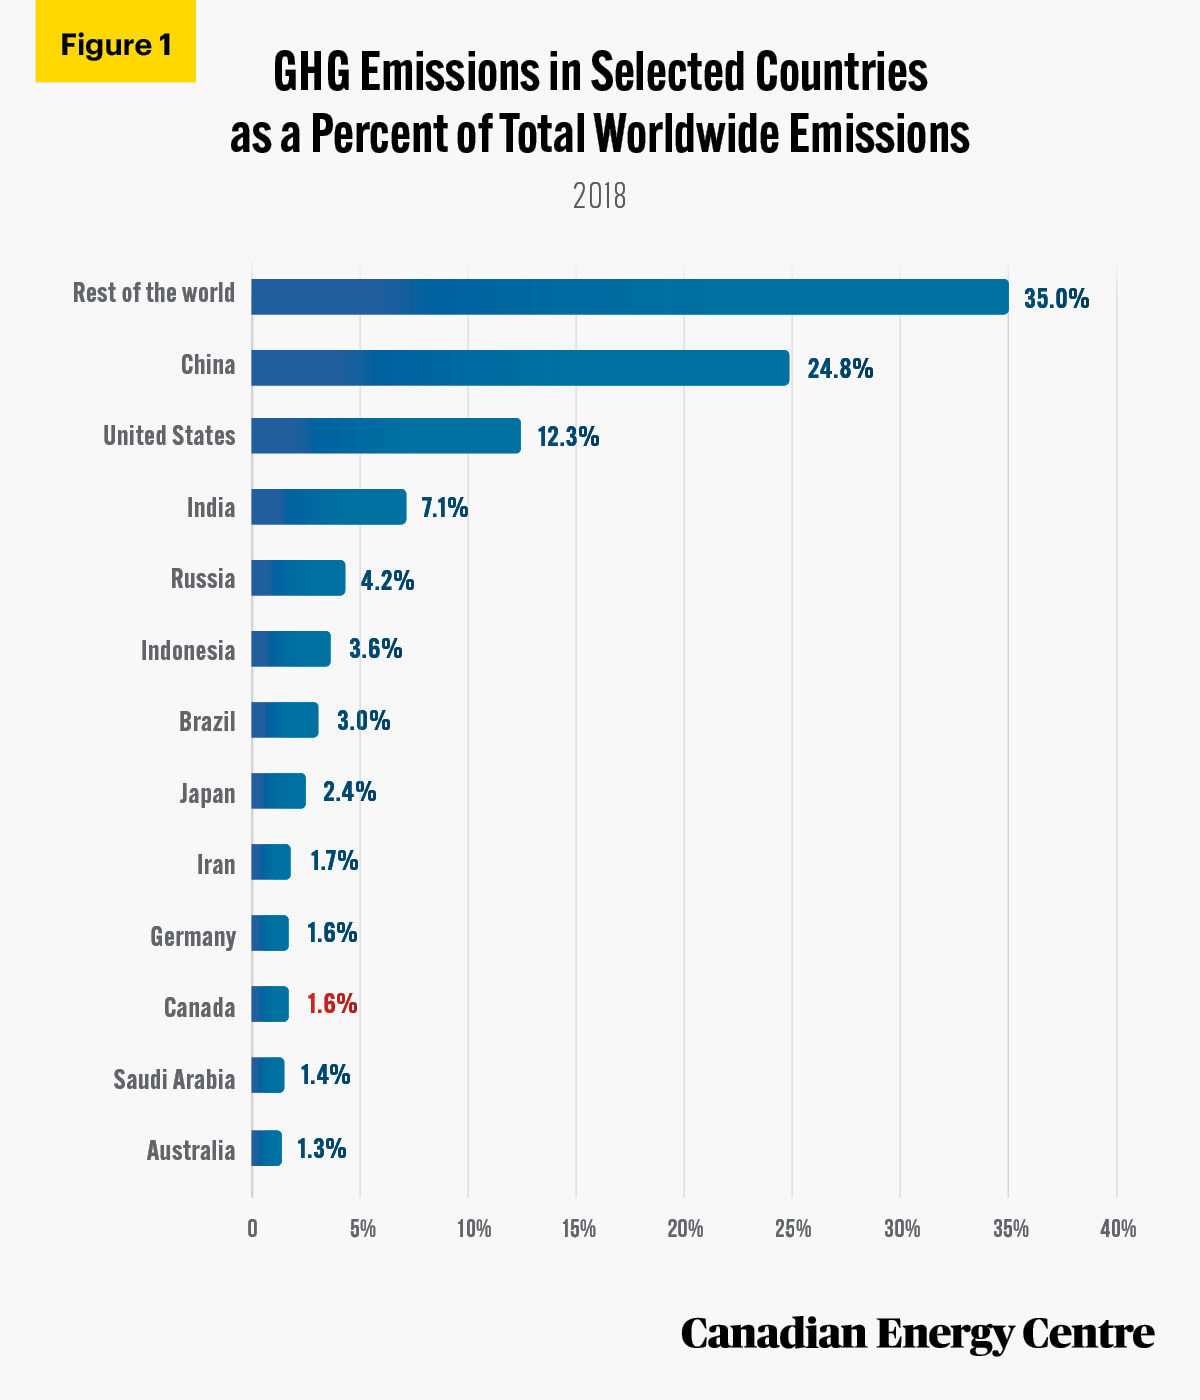
Source: Climate Watch (2021).
According to a March 2020 report by Bank of Montreal (BMO) Capital Markets and the latest worldwide data from Climate Watch, Canada’s oil and gas sector is estimated to account for just 0.4 per cent of global GHG emissions, while the oil sands sub-sector itself is estimated
to account for just 0.2 per cent of global emissions (see Figure 2) (BMO Capital Markets, 2020 Climate Watch, 2021).
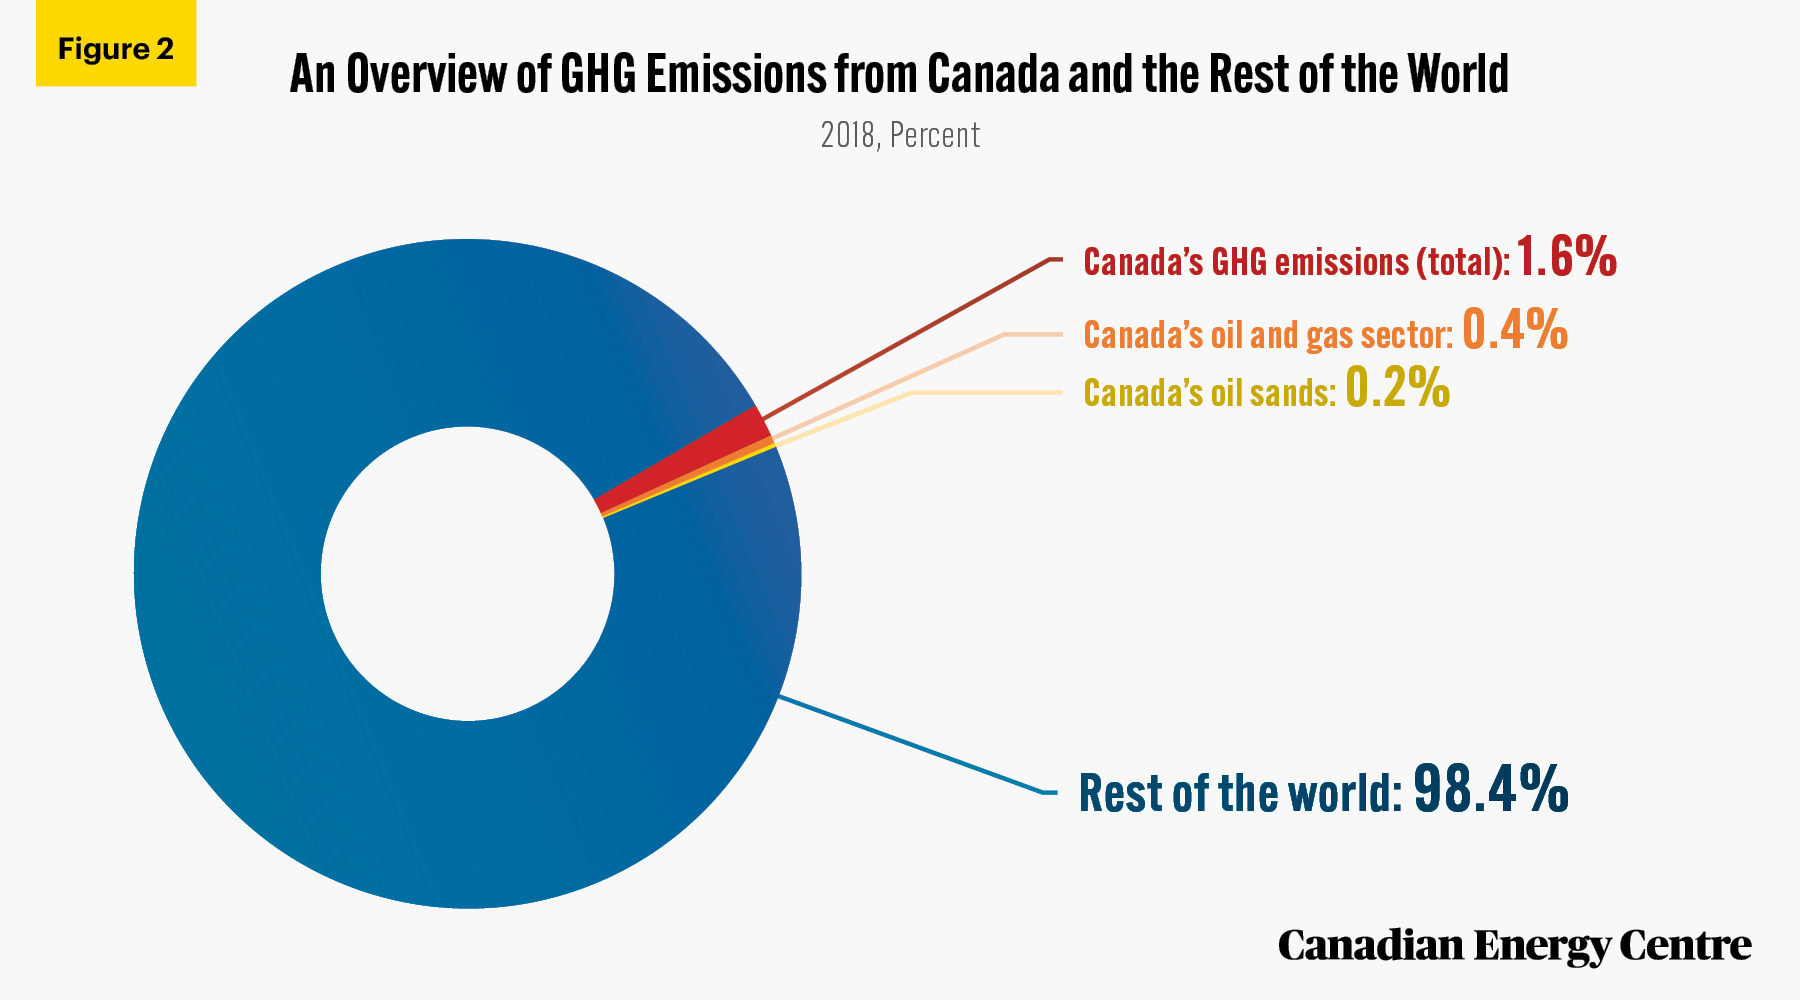
Sources: BMO Capital Markets (2020) and Climate Watch (2021).
Canada’s emissions per unit of GDP have fallen by 30 per cent since 2000
Canada’s GHG emissions per unit of GDP declined over the past two decades.
Between 2000 and 2019, GHG emissions in Canada fell from 0.5 MT of CO2e per billion dollars of GDP to 0.35 MT, a decline of 30 per cent (see Figure 3) (Environment and Climate Change Canada, 2021b)
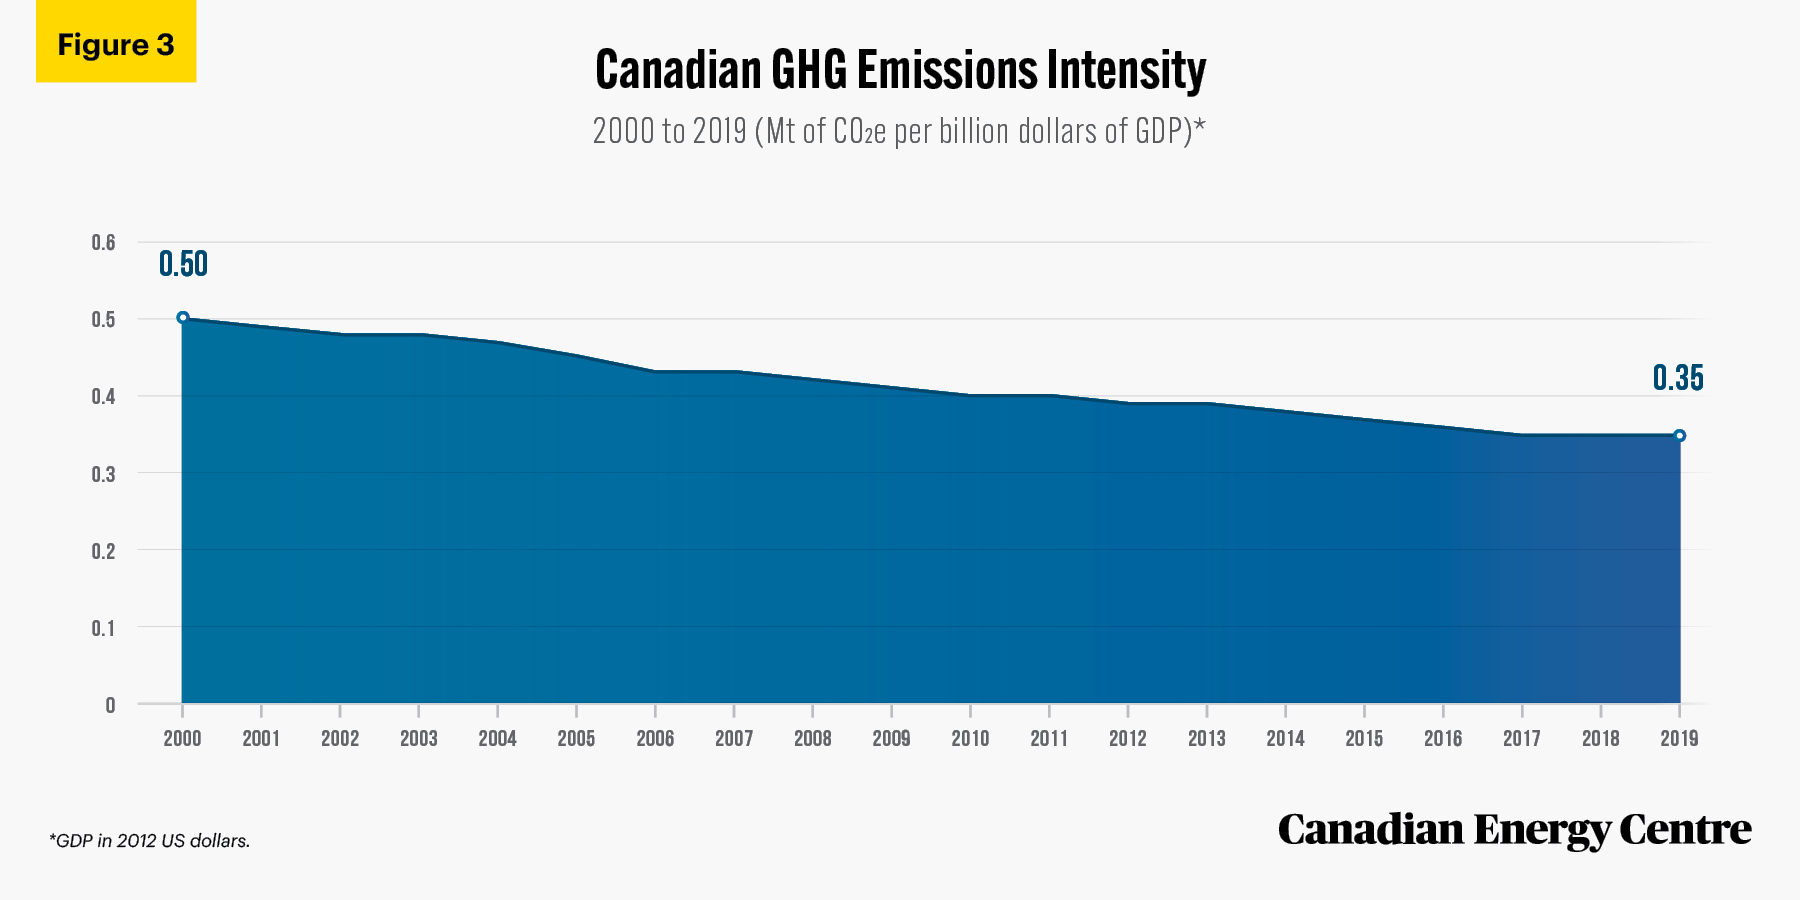
Source: Environment and Climate Change Canada (2021b).
Canada’s GHG emissions intensity per person has fallen by 19 per cent since 2000
Between 2000 and 2019, GHG emissions in Canada fell from 23.9 tonnes of CO2e per person to 19.4 tonnes, a decline of 19 per cent (see Figure 4) (Environment and Climate Change Canada 2021b).
According to Environment and Climate Change Canada (ECCC), decreases in emissions per unit of GDP and per person in Canada are the result of a number of factors, most notably more efficient industrial processes and technological improvements that have contributed to decreases in emissions intensity (Environment and Climate Change Canada, 2021b).
Comparing Canada’s per capita GHG emissions to that of other countries, 2000 to 2018*
The latest year for which per capita and per GDP international emissions data are available is 2018. They reveal that between 2000 and 2018, Canada’s GHG emissions fell from 24.1 tonnes of CO2e per capita to 20.6 tonnes of CO2e per capita, a decline of over 14 per cent.
By comparison, GHG emissions expressed as tonnes of CO2e per capita fell by 22 per cent in the United States, 24 per cent in the United Arab Emirates, 12 per cent in Qatar, and 28 per cent in Australia. Meanwhile, over the same period, emissions per capita increased by 10 per cent in Russia, 34 per cent in Saudi Arabia, and nearly 43 per cent in Oman (Climate Watch, 2021).
In 2018, GHG emissions per capita in Canada (20.6 tonnes of CO2e) were lower than in Australia, Qatar, and the United Arab Emirates, but higher than in the United States, Russia, China, and Mexico (Climate Watch, 2021).
*Note that these international figures for Canada differ marginally from the Canada-only figures displayed in Figure 4 from Environment and Climate Change Canada
Source: Environment and Climate Change Canada (2021b).
Canada’s GHG emissions intensities by sector per TJ of energy used: The mining, quarrying, and oil and gas extraction sector is comparable to other sectors
The reducing emission intensity trend applies to several sectors within Canada’s economy. Emissions intensity is defined as emissions per unit of energy used in various industries (including mining, quarrying, and oil and gas, forestry, cement, iron and steel, and construction), which are produced through the burning of the fossil fuels required to power their operations.
- Between 2000 and 2018, the GHG intensity of Canada’s industrial sector as a whole declined from 50.9 tonnes of CO2e per TJ of energy used to 49.5 tonnes, a reduction of nearly 3 per cent (Natural Resources Canada, 2021).
- Between 2000 and 2018, the GHG intensity of Canada’s mining, quarrying, and oil and gas extraction sector specifically declined from 64.5 tonnes of CO2e per TJ of energy used to 62.4 tonnes, a reduction of over 3 per cent (see Figure 5) (Natural Resources Canada, 2021).
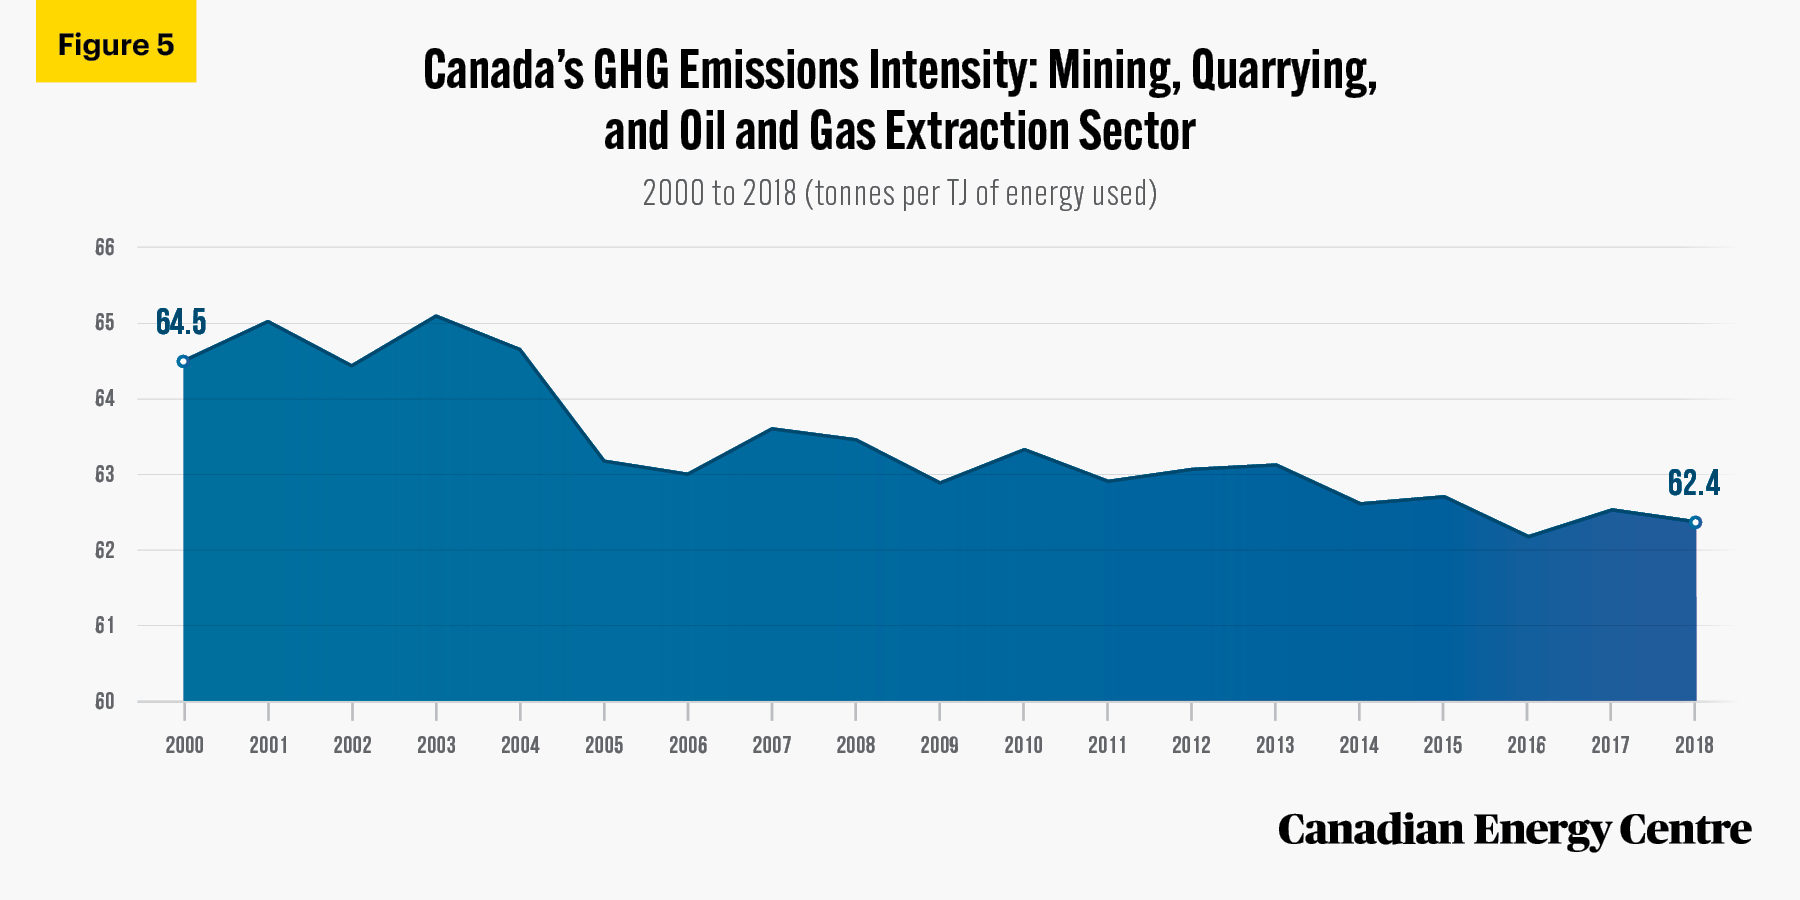
Source: Natural Resources Canada (2021).
- The current emissions intensity of the Canadian mining, quarrying, and oil and gas extraction sector compares favourably to other industrial sectors in Canada. In 2018, the emissions intensity of the sector in Canada was 62.4 tonnes of CO2e per terajoule (TJ) of energy used in extraction. This compares to 66.1 tonnes of CO2e per terajoule used in the construction sector, 68.4 tonnes used in the iron and steel sector, 70.4 tonnes used in the forestry sector, and 71.3 tonnes used in the cement sector (Figure 6) (Natural Resources Canada, 2021).
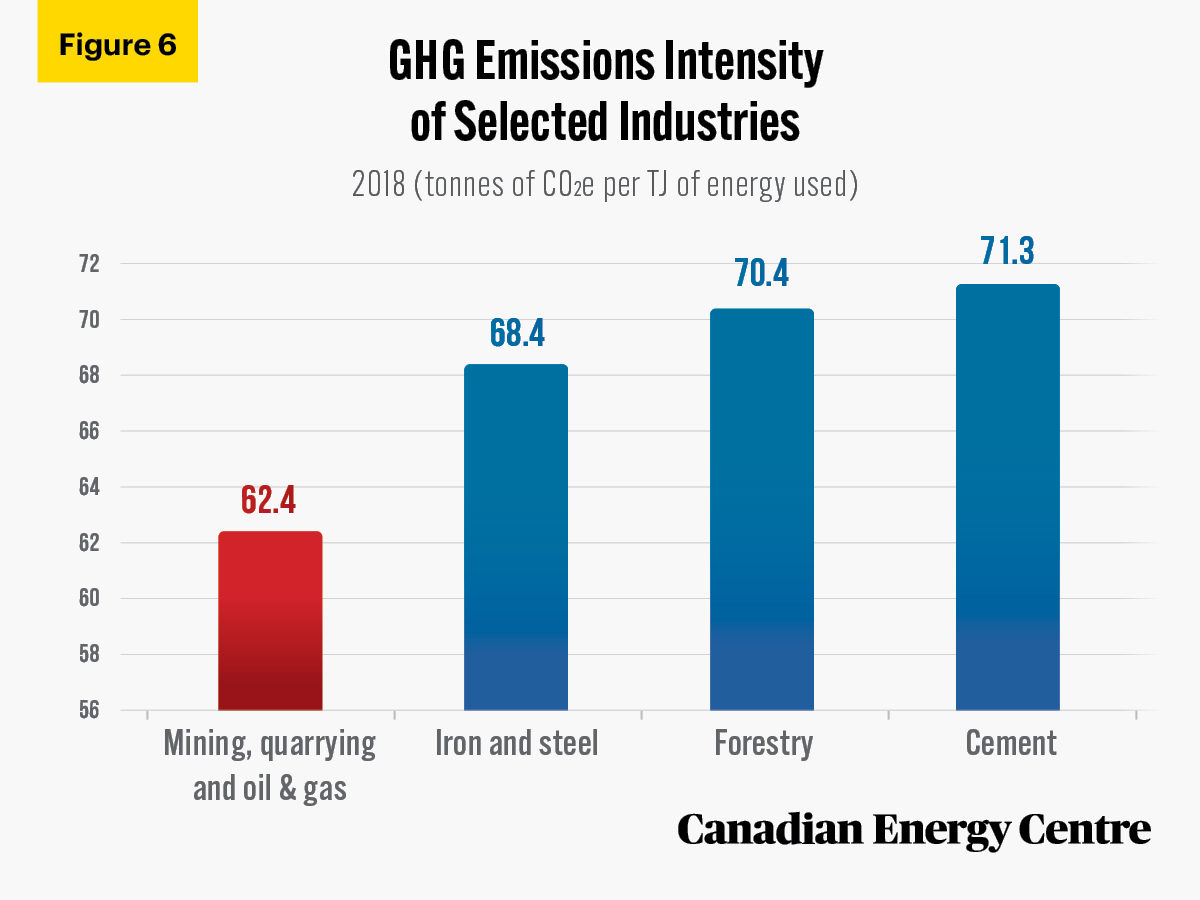
Source: Natural Resources Canada (2021).
Analysis
Part II :Evaluating GHG emissions intensity between Canada and selected energy-producing and energy-consuming nations
Canada’s GHG emissions intensity is comparable to other energy-producing and energy-consuming countries
As noted earlier, the latest year for which per capita and per GDP international emissions data are available is 2018.
Climate Watch compiles historical GHG emissions data through its Climate Analysis Indicators Tool (CAIT). These data include GHG emissions for 186 countries, including CO2, methane, fluorinated gases, and nitrous oxide. The values reported differ somewhat from the official estimate of GHG emissions that Canada and other countries submit to the United Nations Framework Convention on Climate Change (UNFCCC) for their National Inventory Reports. A leading cause of the differences is that many member countries, including Canada, now report emissions using a revised methodology and global warming potential guidelines that Climate Watch has yet to use (Government of Canada, 2020).
Greenhouse gas data in the CAIT dataset also have uncertainties due to the fact Climate Watch is using many different data sources. Despite these uncertainties, Climate Watch has chosen to err on the side of inclusiveness, by capturing the widest possible range of GHG sources and sinks that contribute to global climate change.¹
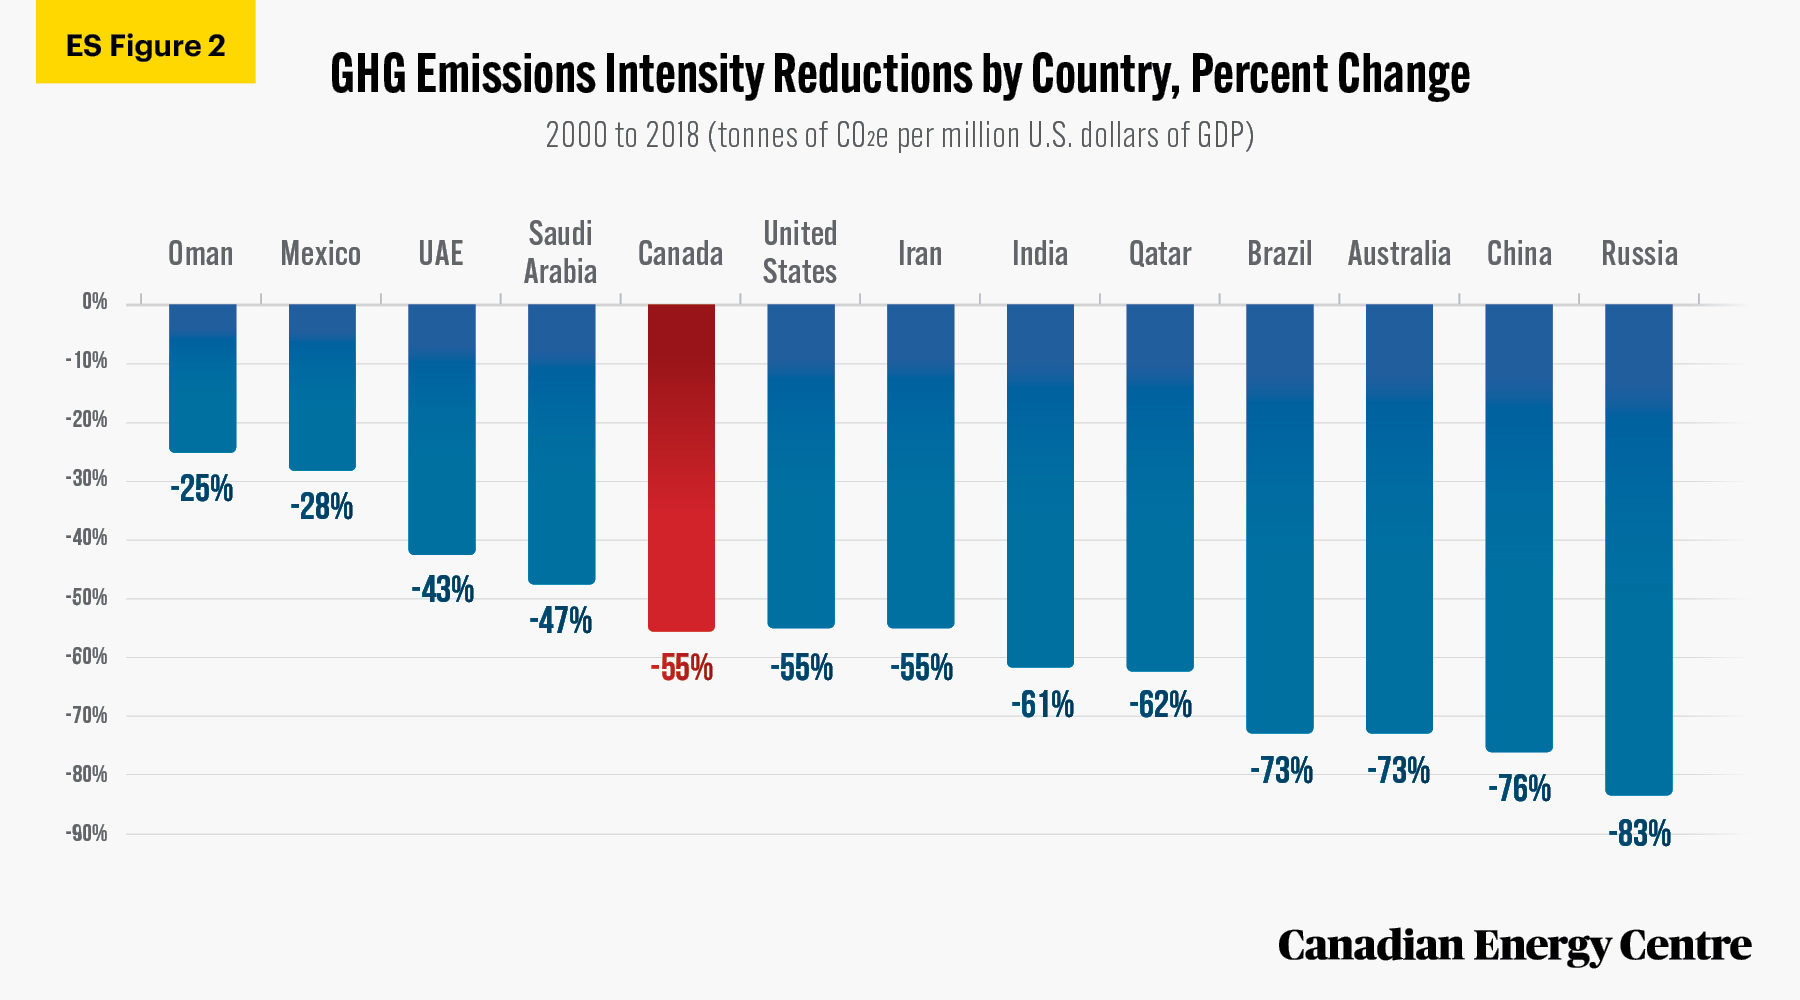
Canada’s GHG emissions intensity per million dollars of GDP fell by 55 per cent over the past two decades
According to Climate Watch, between 2000 and 2018, Canada’s GHG emissions intensity fell from 996.4 tonnes of CO2e per million dollars of GDP to 444.8 tonnes, a decline of over 55 per cent (see Figure 7) (Climate Watch, 2021).
1. For more information on data uncertainties please consult section 7 of CAIT Country Greenhouse Gas Emissions: Sources and Methods.
Source: Climate Watch (2021).
By comparison, over the same period, GHG emissions expressed in tonnes of CO2e per million US dollars of GDP declined in range with reductions as deep as 83 per cent in Russia to 25 per cent in Oman (see Figure 8) (Climate Watch, 2021).
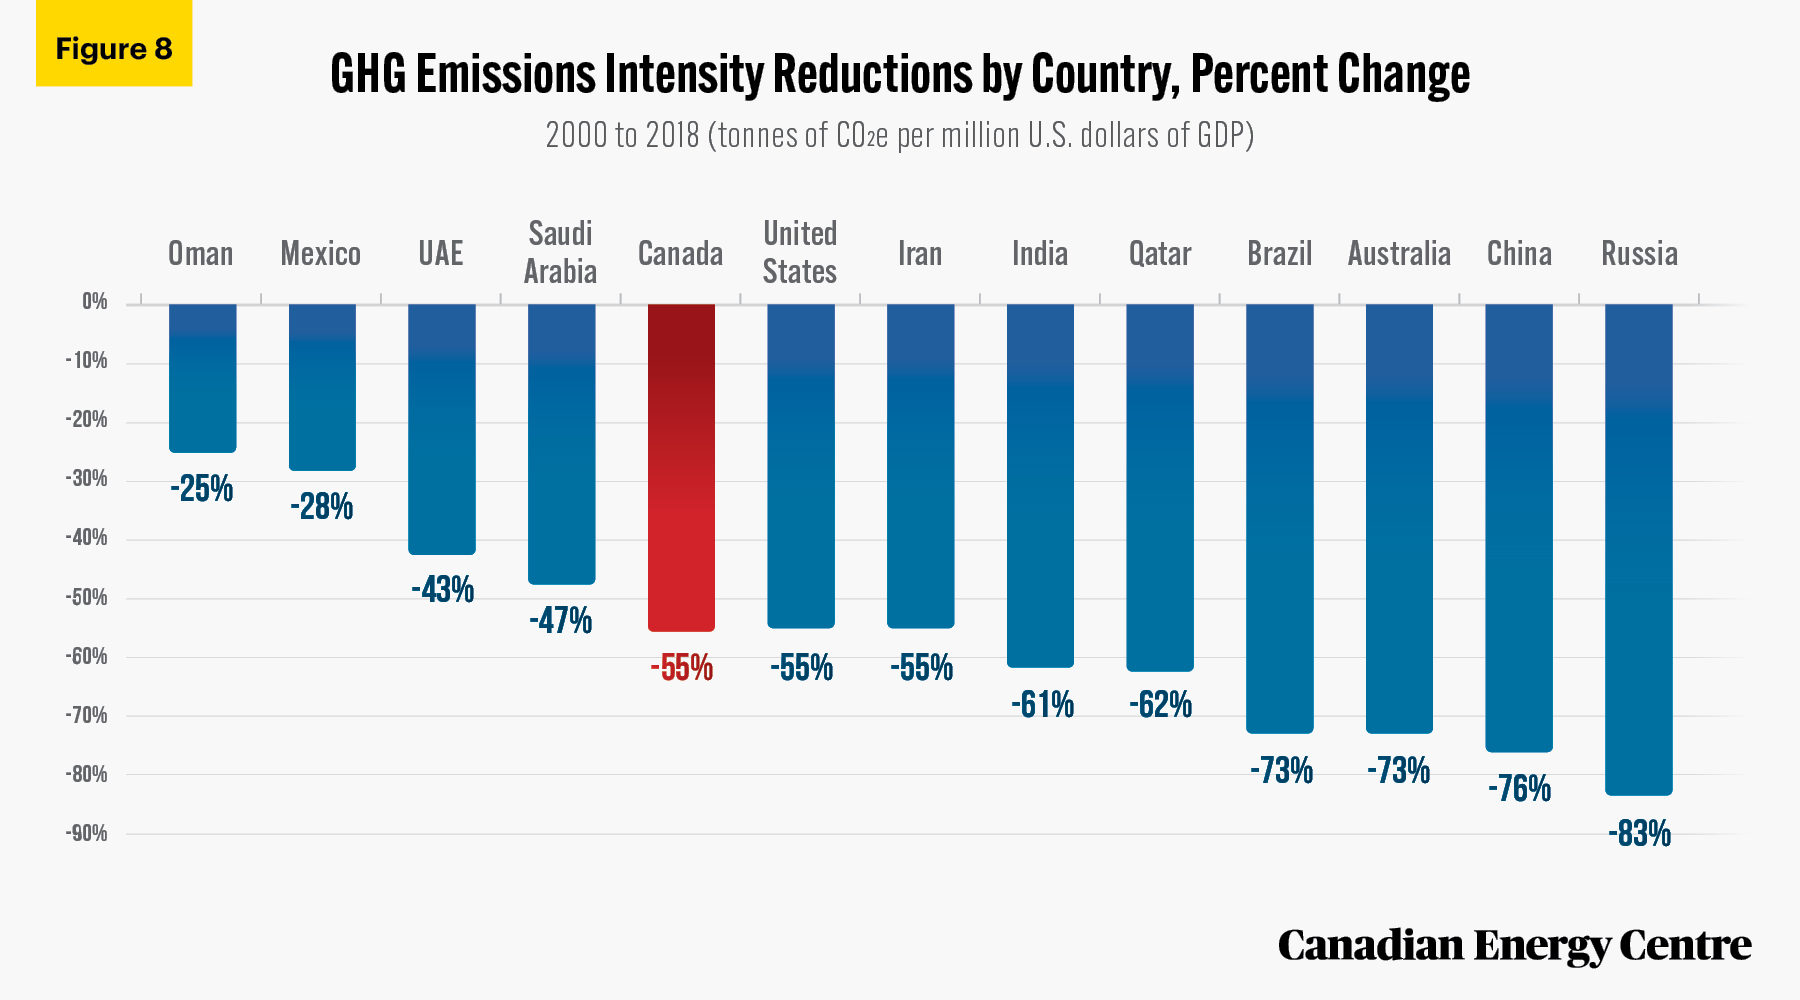
Source: Climate Watch (2021).
Though it appears that the reduction in emissions was much more dramatic in countries such as Russia (down 83 per cent) than in Canada (down 55 per cent) in 2018, Canada’s GHG emissions intensity of 445 tonnes of CO2e per million dollars of GDP was lower in absolute terms than in many other energy-producing and energy-consuming countries, such as China, India, Brazil, Oman, Russia, Saudi Arabia, Mexico, and the United Arab Emirates (see Figure 9) (Climate Watch, 2021).
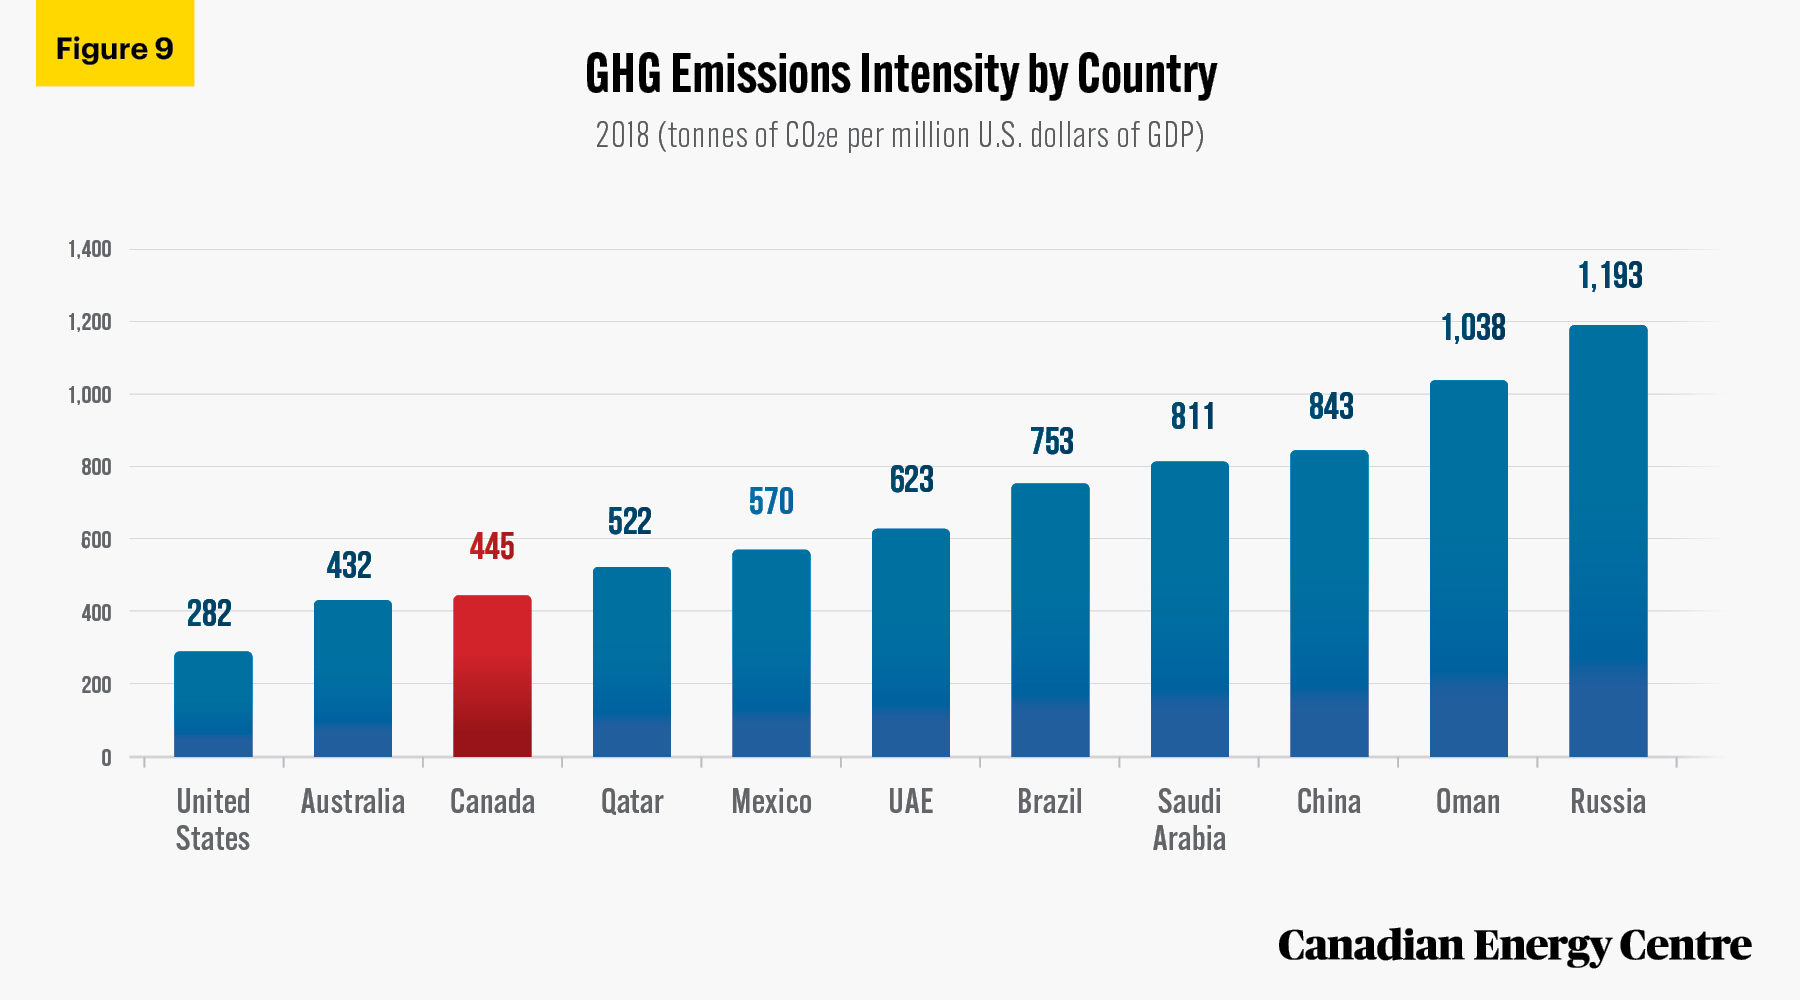
Source: Climate Watch (2021).
Canada’s fuel combustion GHG emission intensities are falling
The International Energy Agency (IEA) tracks GHG fuel combustion emissions (i.e., emissions stemming from energy use) for over 180 countries and regions. This is an important indicator to examine because globally about 70 to 80 per cent of GHG emissions are from the production and consumption of energy. This includes activities such as using gasoline for transportation, producing non-renewable electricity, producing oil and gas, and heating and cooling buildings (Environment and Climate Change, 2020b).
Canada’s GHG fuel combustion emissions intensity has been falling steadily. Between 2000 and 2018 (the latter year the most recent for which comprehensive data are available), Canada’s GHG fuel combustion emissions intensity fell from 0.42 kilograms (kg) of CO2e per purchasing power parity (PPP) in 2015 US dollars of GDP to 0.33 kg, a decline of over 21 per cent (see Figure 10) (International Energy Agency, 2020)
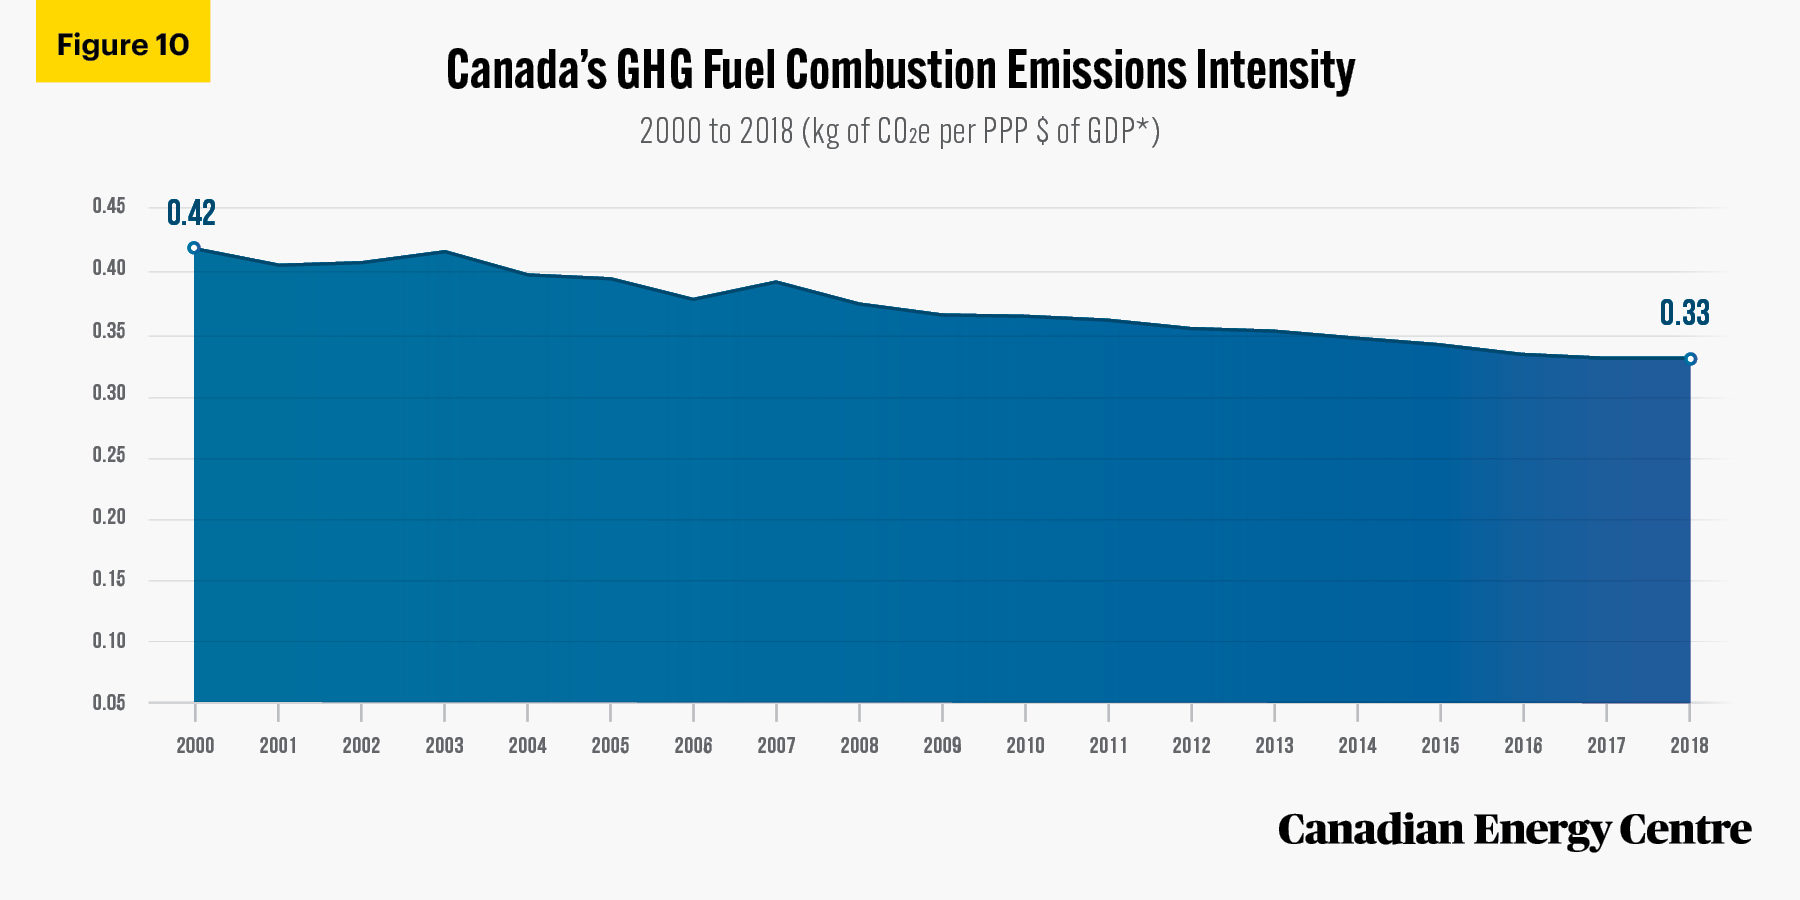
Source: International Energy Agency (2020).
By comparison, fuel combustion emissions intensity changes expressed in kg of CO2e per PPP in 2015 US dollars of GDP ranged from a 41 per cent decline in Russia and the United States to an increase of 90 per cent in Oman over the same period (see Figure 11) (International Energy Agency, 2020).
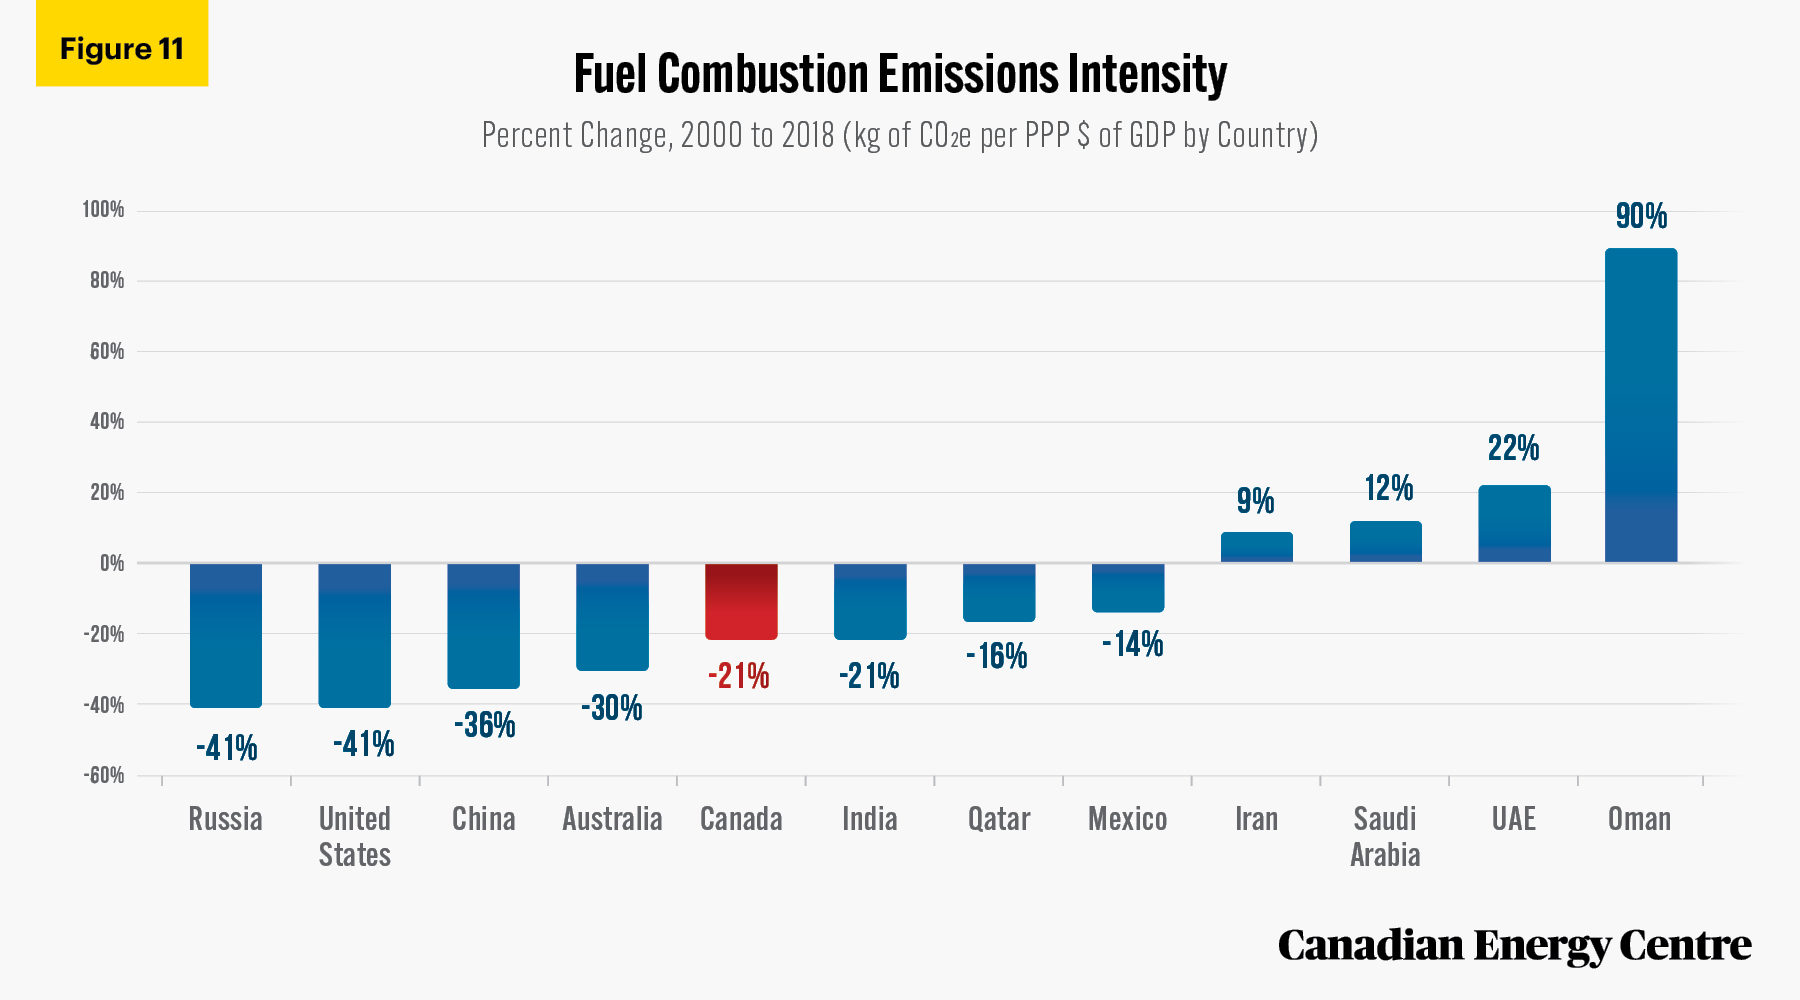
Source: International Energy Agency (2020).
In 2018, Canada’s GHG fuel combustion emissions of 0.33 kg of CO2e per PPP in 2015 US dollars of GDP ranked above Australia and the United States, but lower than Russia, China, Iran and Oman (see Figure 12) (International Energy Agency, 2020).
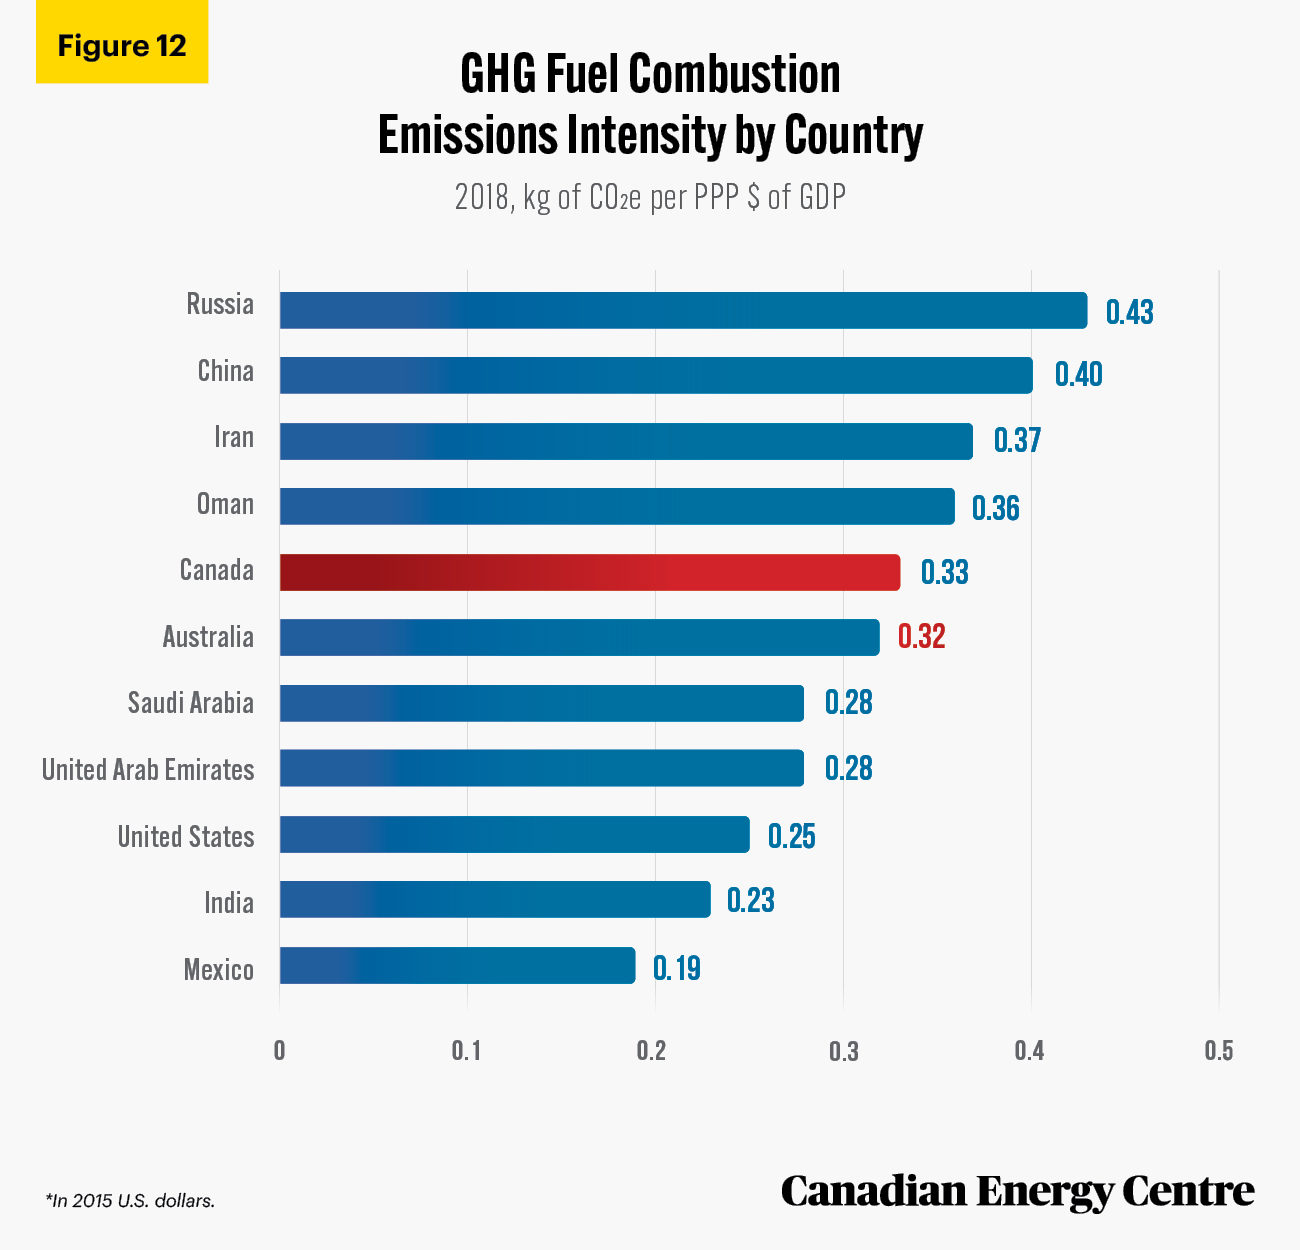
Source: International Energy Agency (2020).
Between 2000 and 2018, Canada’s fuel combustion emissions intensity fell from 16.4 tonnes of CO2e per capita to 15.3 tonnes of CO2e per capita, a decline of about 7 per cent (see Figures 13 and 14) (International Energy Agency, 2020).
By comparison, fuel combustion emissions intensity expressed in CO2e per capita ranged from a reduction (26 per cent) in the United States to an increase (178 per cent) in China (see Figure 14) (International Energy Agency, 2020).
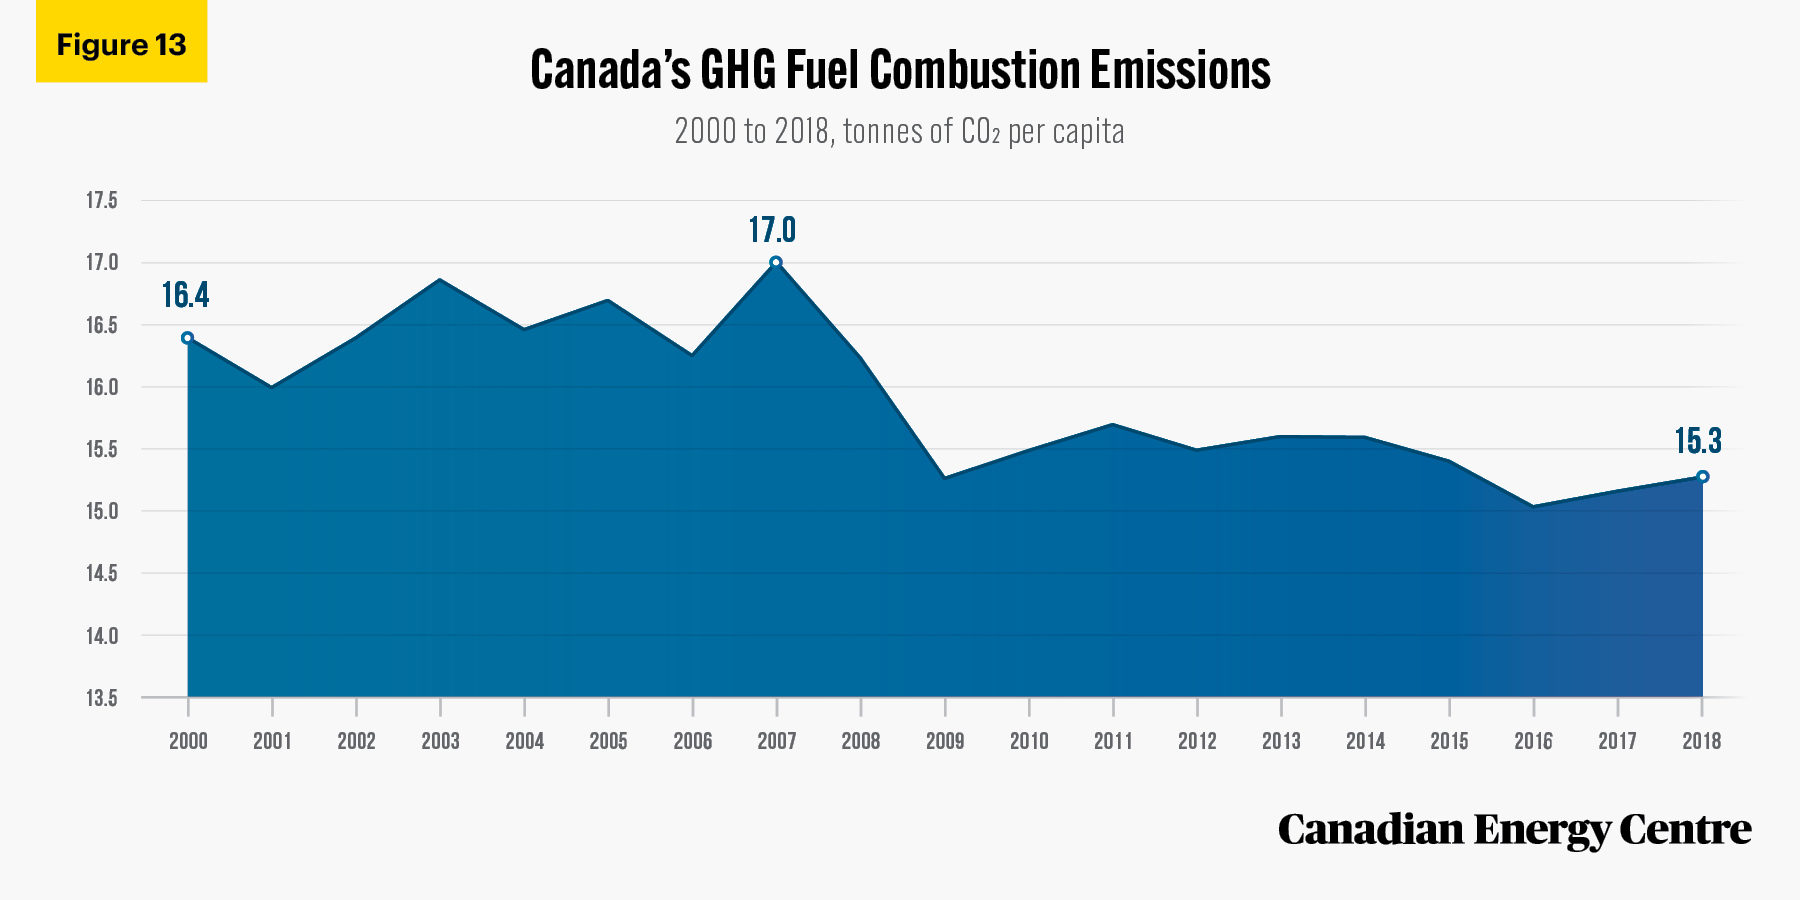
Source: International Energy Agency (2020).
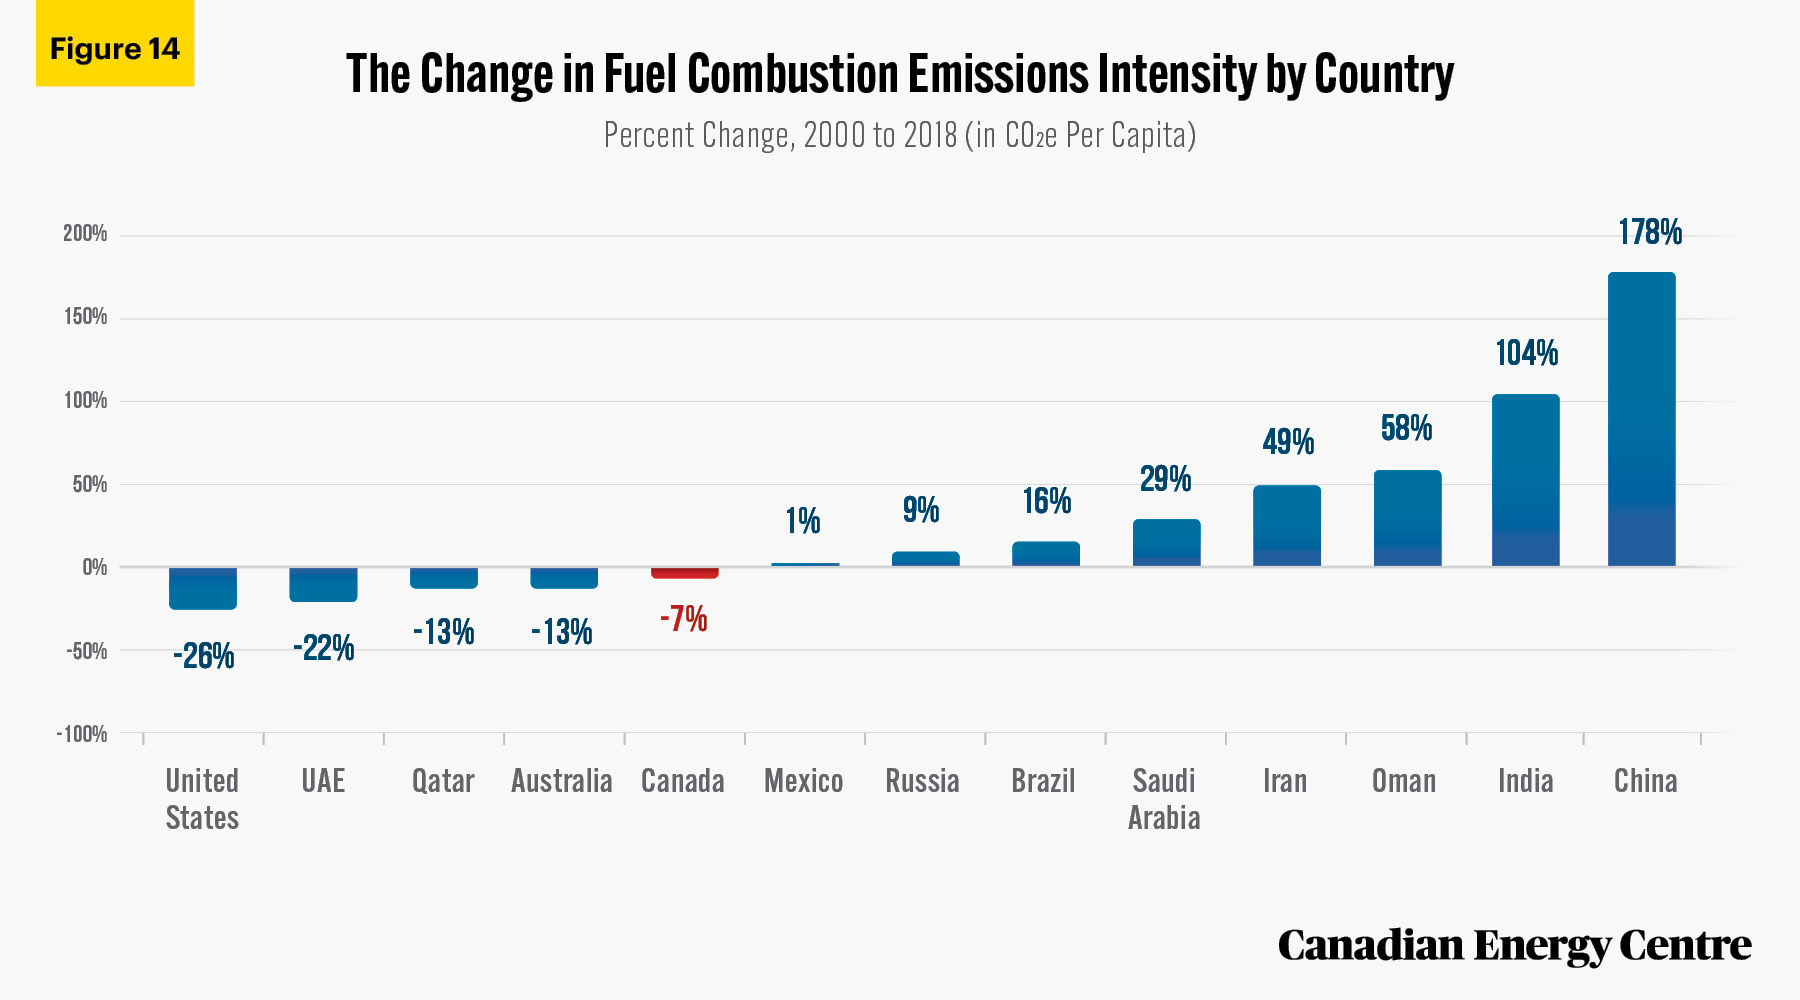
Source: International Energy Agency (2020).
In 2018, Canada’s fuel combustion emissions intensity of 15.3 tonnes of CO2e per capita was higher than the United States and Oman, but lower than Qatar, Saudi Arabia, and the United Arab Emirates (see Figure 15) (International Energy Agency, 2020).
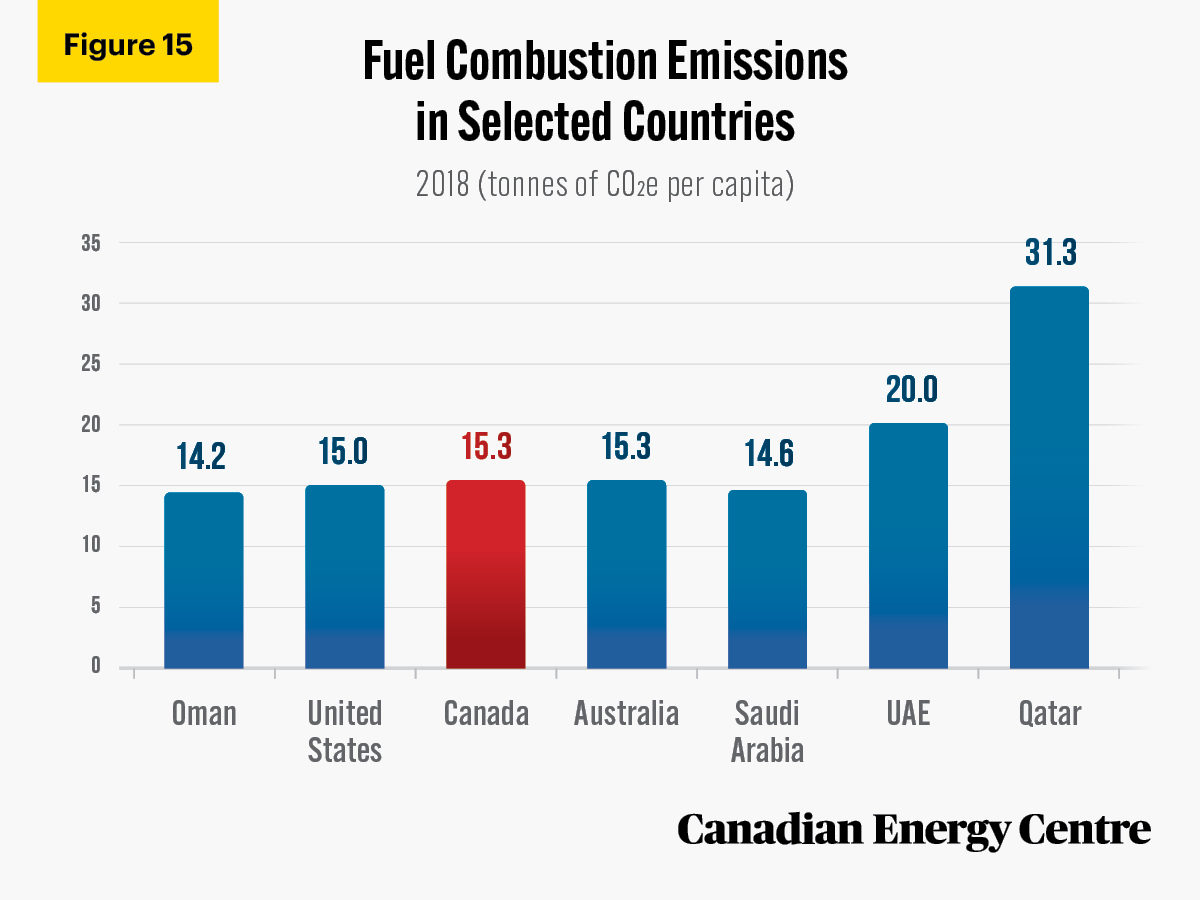
Source: International Energy Agency (2021).
Industrial fuel combustion GHG emissions intensity in Canada is also falling
Between 2000 and 2018, the GHG fuel combustion emissions from Canada’s industrial sector fell from 0.071 kg of CO2e per PPP in 2015 US dollars of GDP to 0.042 kg, a decline of nearly 41 per cent (see Figure 16) (International Energy Agency, 2020).
Source: International Energy Agency (2021).
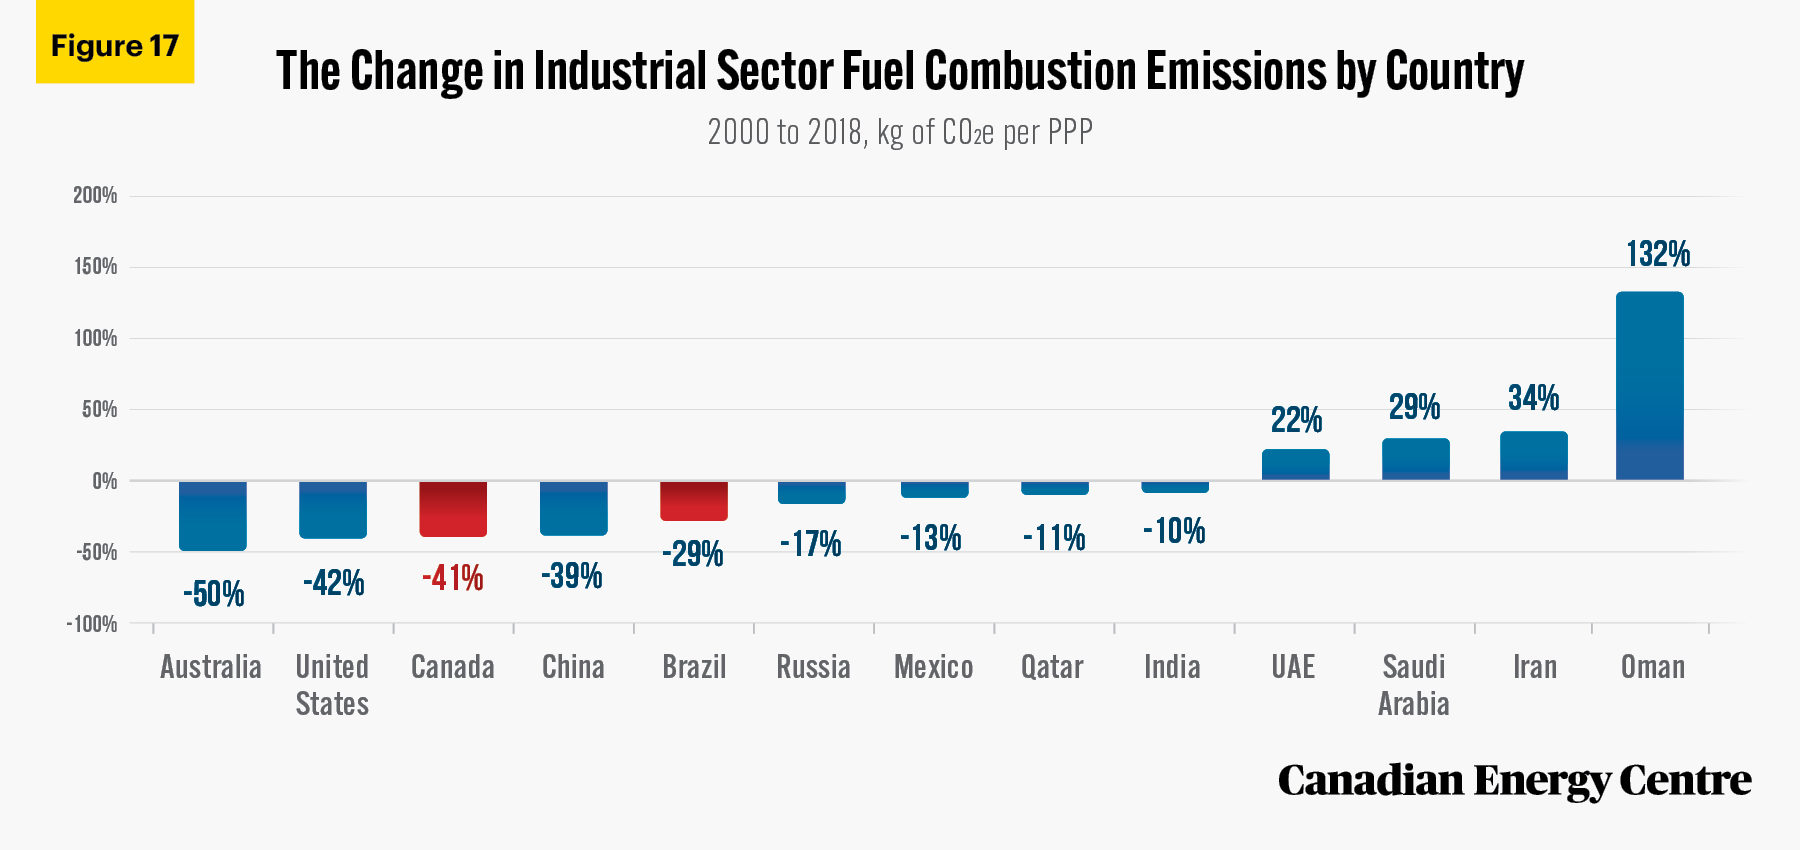
By comparison, the GHG fuel combustion emissions from the industrial sector expressed in kg of CO2e per PPP in 2015 US dollars of GDP ranged from a reduction of 50 per cent in Australia to an increase of 132 per cent in Oman over the same period (see Figure 17) (International Energy Agency, 2020).
Source: International Energy Agency (2020).
In 2018, the GHG fuel combustion emissions from Canada’s industrial sector expressed in kg CO2e per PPP in 2015 US dollars of GDP was higher than in the United States, Mexico, and Australia, but lower than in India, Oman, Qatar, Russia, Saudi Arabia, the United Arab Emirates, and China, among others (see Figure 18) (International Energy Agency, 2020).
Source: International Energy Agency (2020).
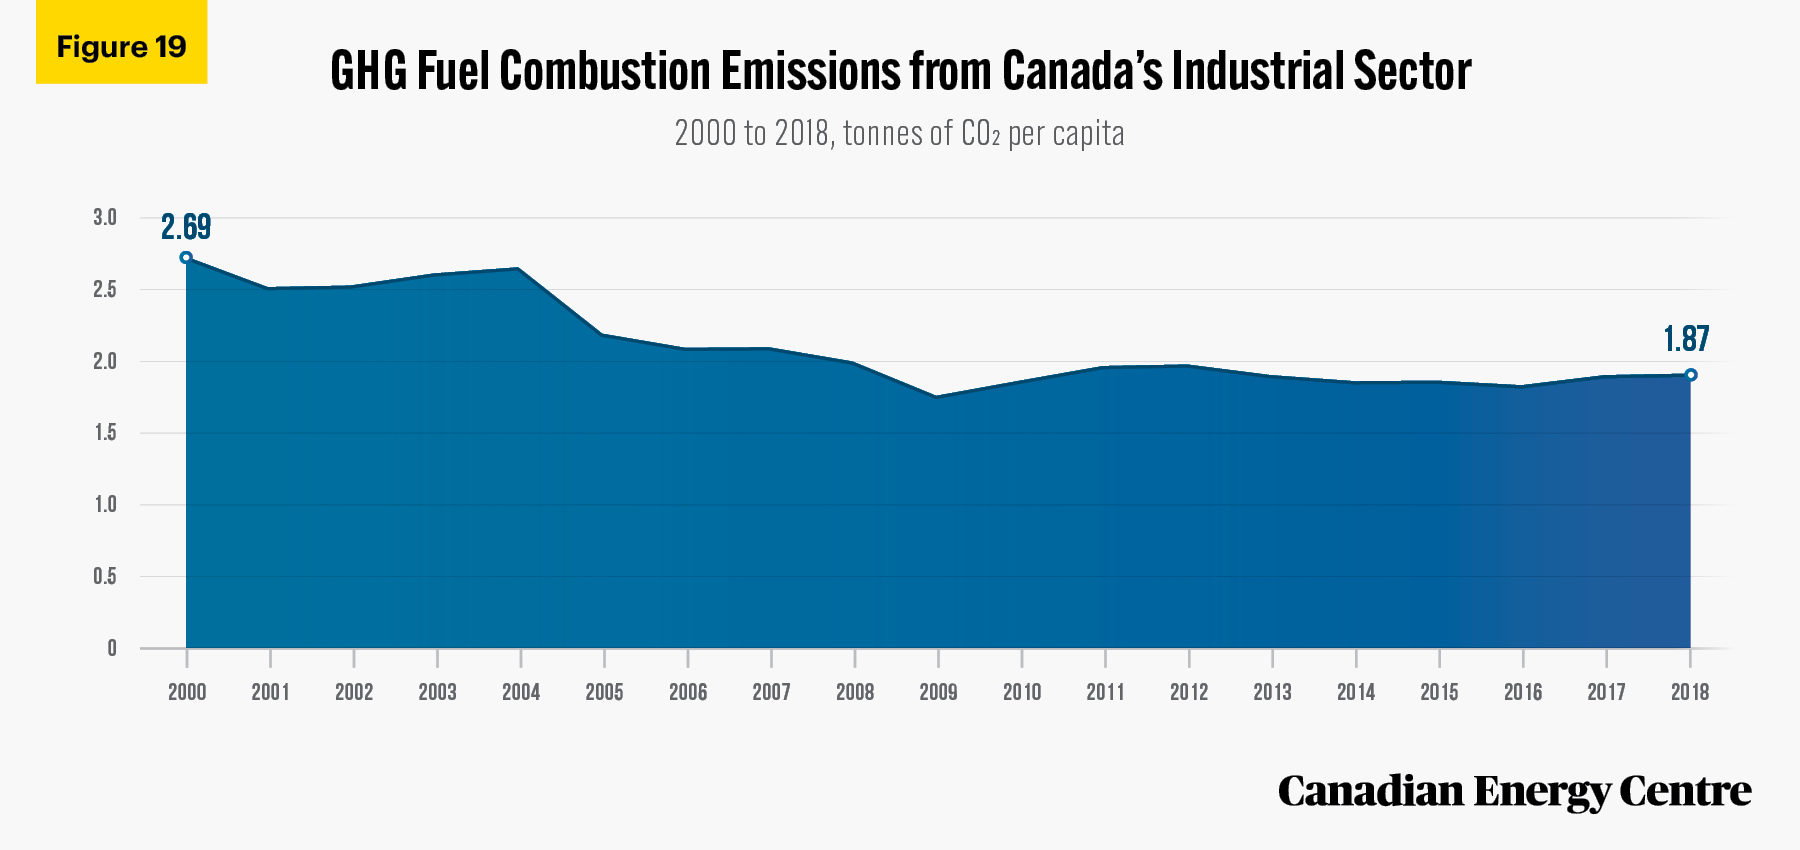
Between 2000 and 2018, the fuel combustion emissions intensity from Canada’s industrial sector fell from 2.69 tonnes of CO2e per capita to 1.87 tonnes of CO2e per capita, a decline of nearly 31 per cent (see Figure 19) (International Energy Agency, 2020).
Source: International Energy Agency (2020).
By comparison, the range of fuel combustion emissions intensity reductions and increases in the industrial sector of comparator countries expressed in tonnes of CO2e per capita range from a 38 per cent reduction in Australia to an increase of 167 per cent in China over the same period (see Figure 20) (International Energy Agency, 2020).
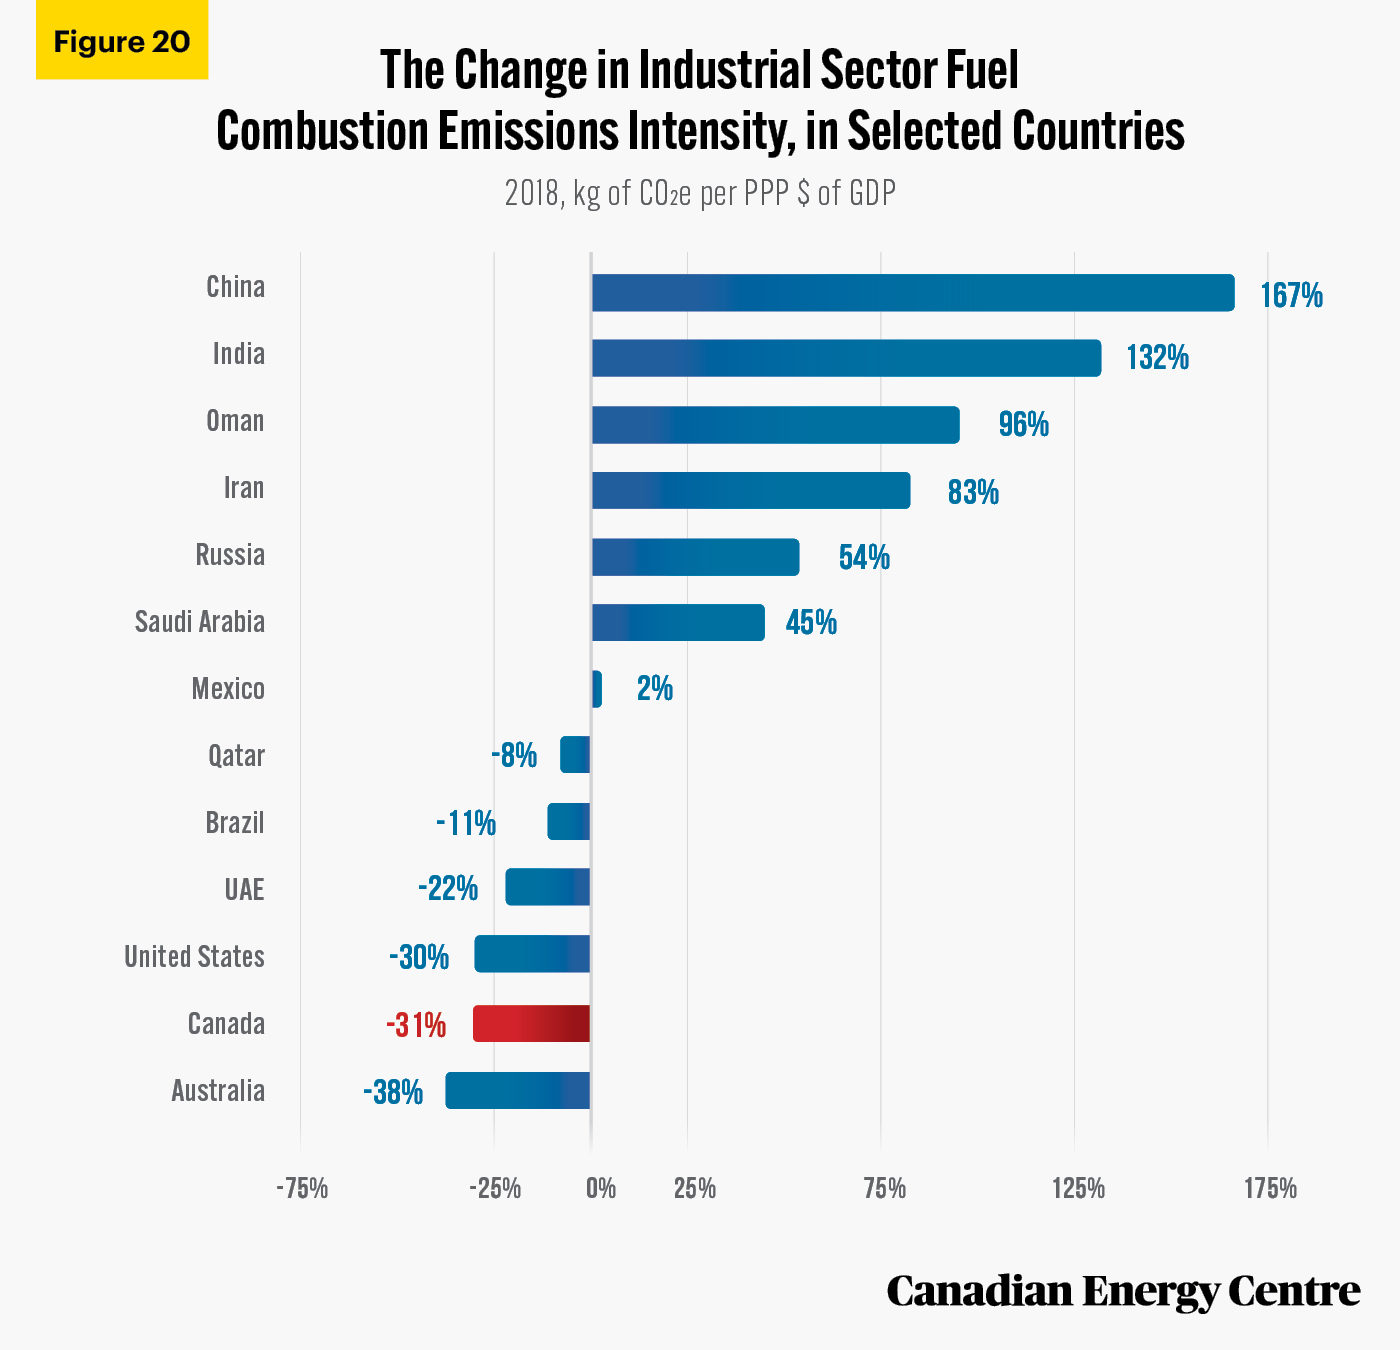
Source: International Energy Agency (2020).
In 2018, Canada’s fuel combustion emissions intensity from the industrial sector expressed in tonnes of CO2e per capita were higher than in the United States, Russia, Australia, and Mexico, but lower than in China, Oman, Qatar, Saudi Arabia, and the United Arab Emirates (see Figure 21) (International Energy Agency, 2020).
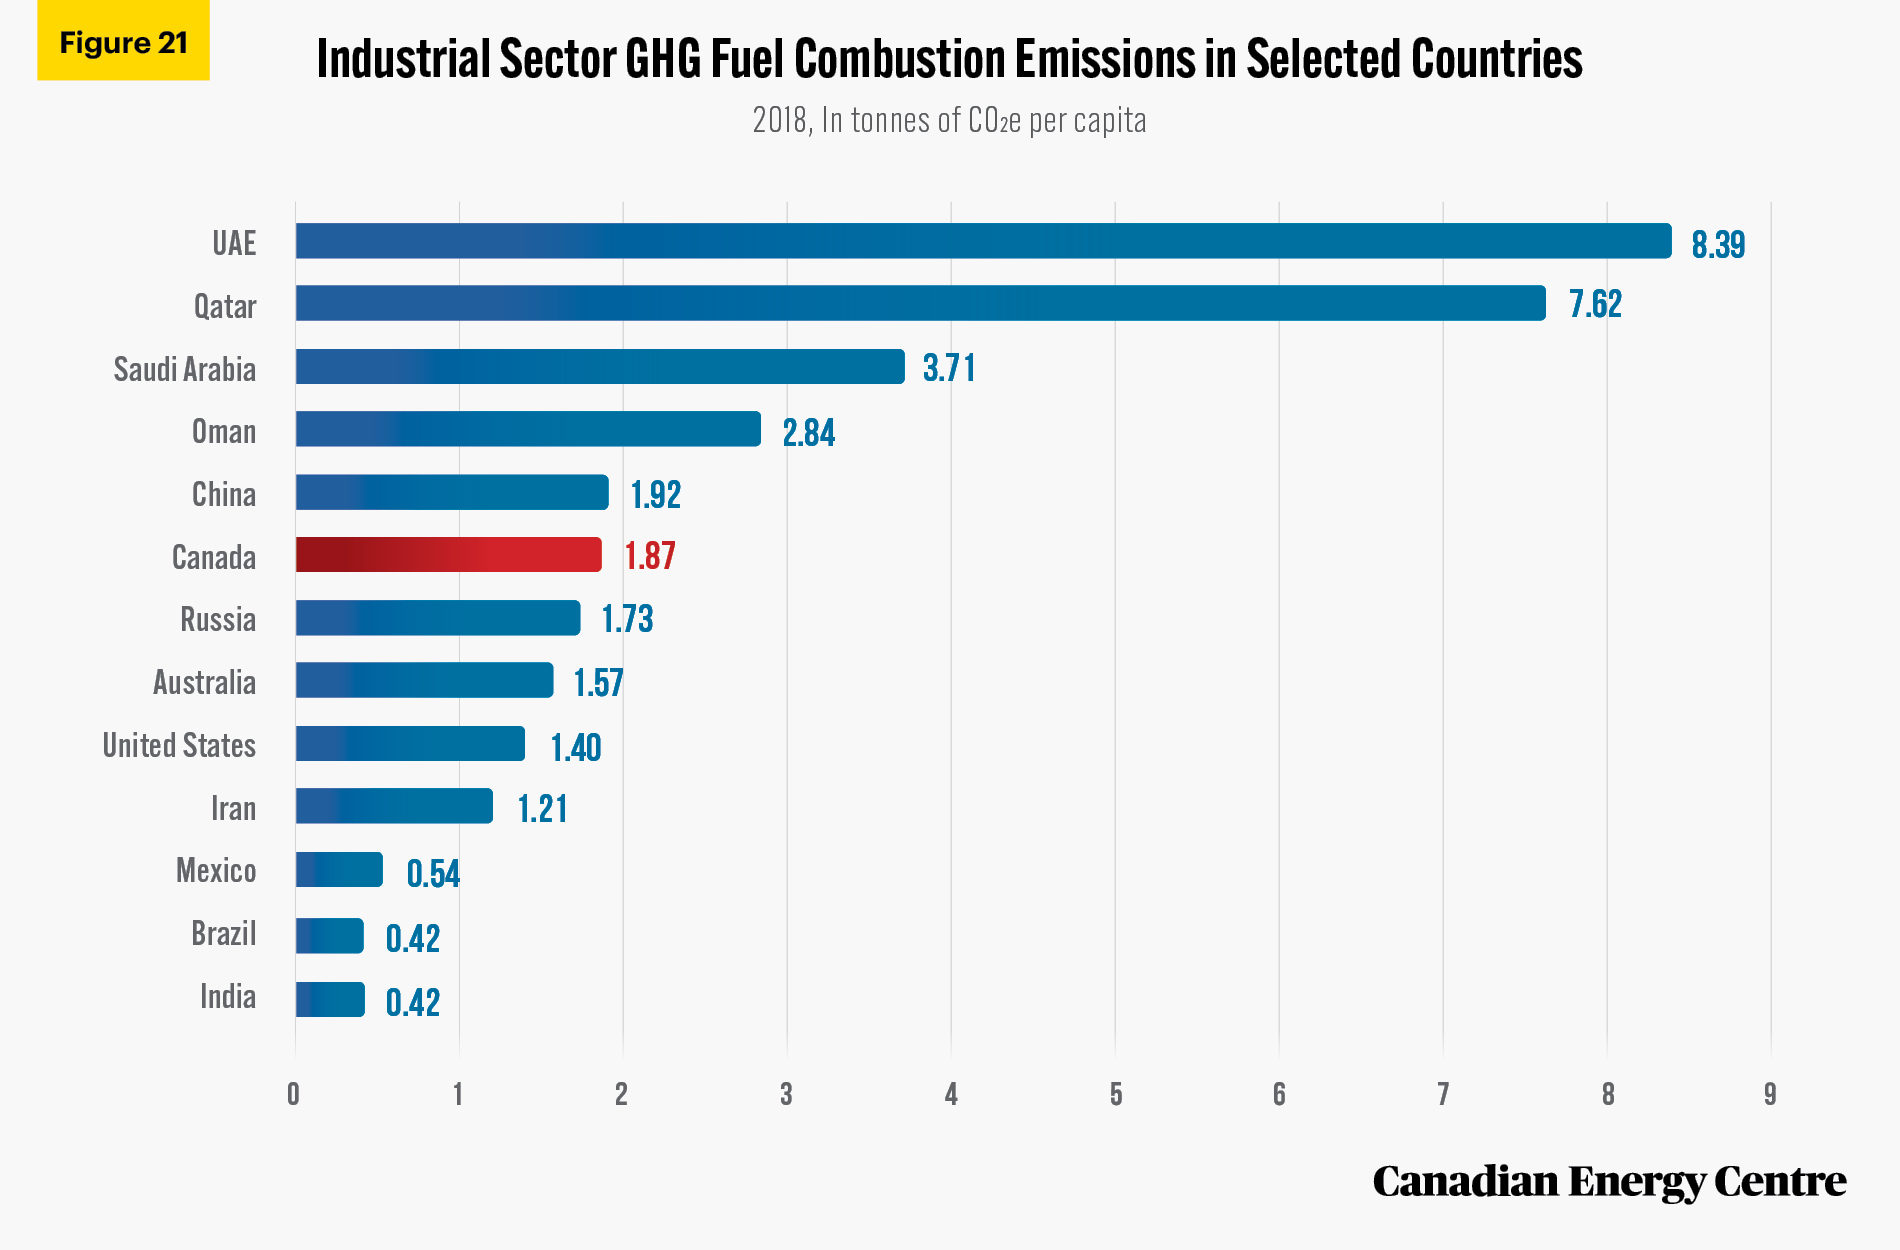
Source: International Energy Agency (2020).
Oil sands emissions intensity is declining
Over the past decade, there has been a marked improvement in GHG emissions intensities (i.e. upstream GHG emissions associated with oil sands extraction and primary processing, for commonly traded Canadian oil sands crudes).
- Between 2011 and 2019, the crude production GHG emissions intensity of Alberta oil sands commonly exported to the United States fell from 0.53 tonnes of CO2e per cubic metre to 0.42 tonnes, a decline of about 22 per cent (see Figure 22) (Alberta, 2021a).
- Between 2011 and 2019, the crude production GHG emissions intensity of Alberta in-situ oil sands commonly exported to the United States fell from 0.48 tonnes of CO2e per cubic metre to 0.45 tonnes, a decline of 7 per cent (see Figure 23) (Alberta, 2021a).
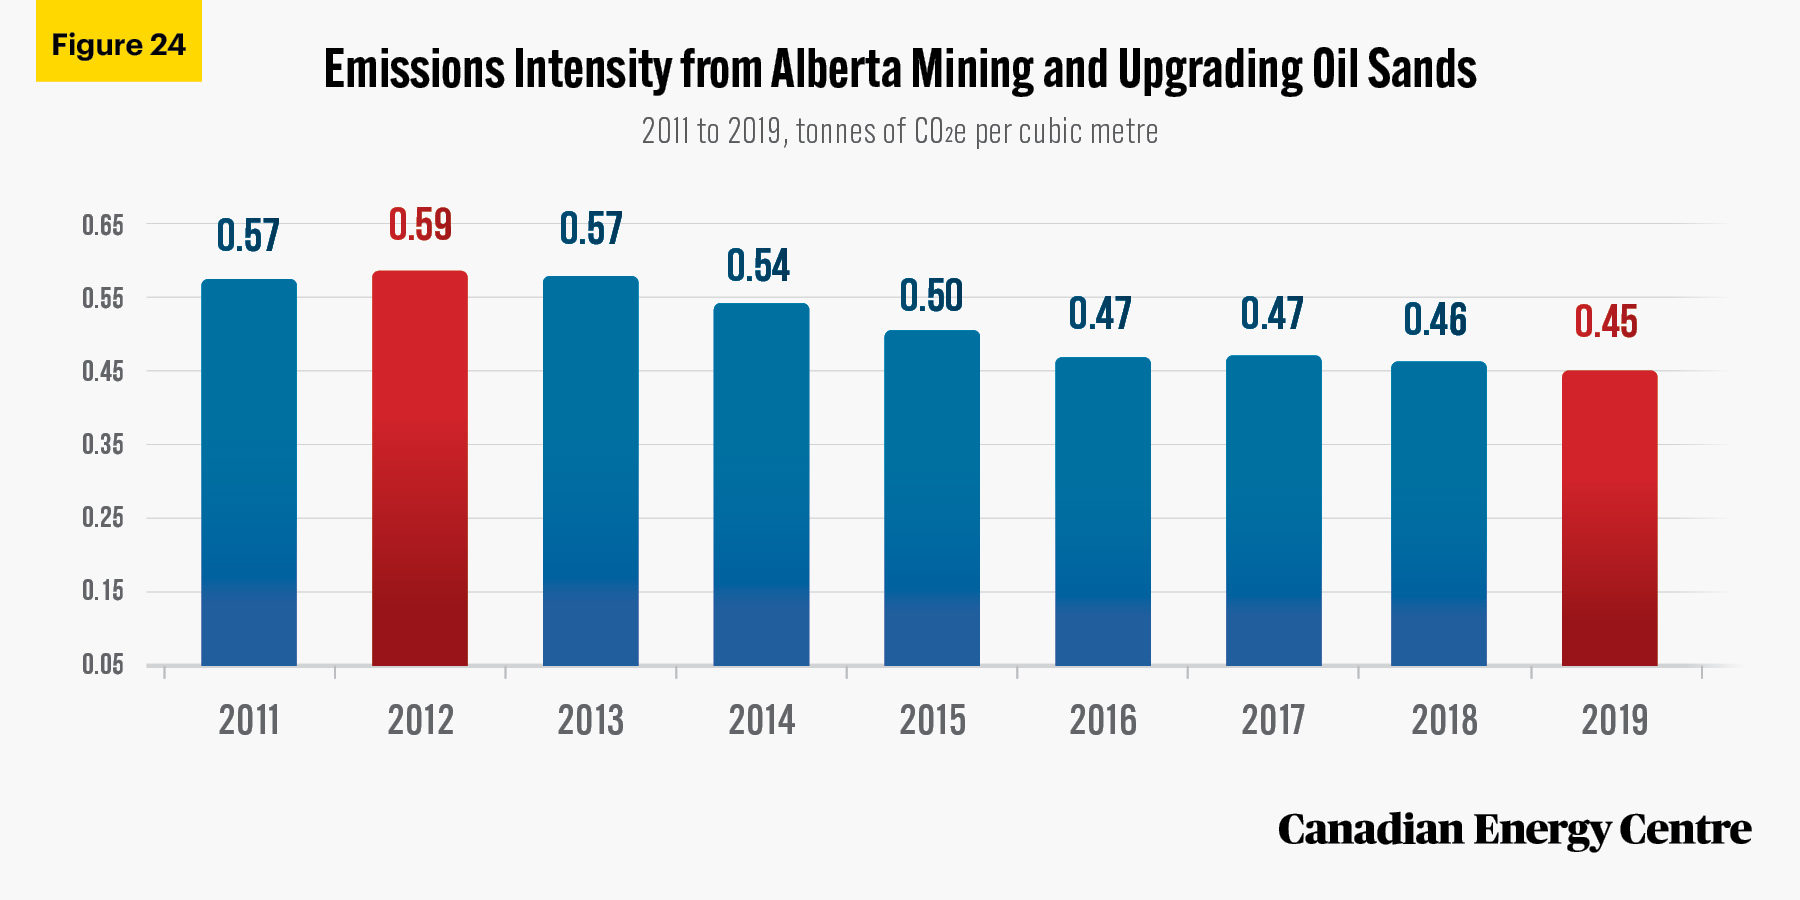
- Between 2011 and 2019, the crude production GHG emissions intensity of Alberta mining and upgrading oil sands commonly exported to the United States fell from 0.57 tonnes of CO2e per cubic metre to 0.45 tonnes, a decline of 21 per cent (see Figure 24) (Alberta, 2021a).
- According to IHS Markit, the overall weighted average of the upstream GHG intensity of Canadian oil sands (which includes oil sands, steam assisted gravity drainage, mined light/sweet synthetic crude, mined dilbit paraffinic froth treatment, and enhanced oil recovery) continued to decline in 2018— falling two per cent from 72 kilograms of carbon dioxide equivalent per barrel (kgCO2e/bbl) in 2017 to 70 kgCO2e/bbl in 2018. This is about 20 per cent, or about 17 kgCO2e/bbl lower than a decade earlier in 2009 (IHS Markit, 2020).
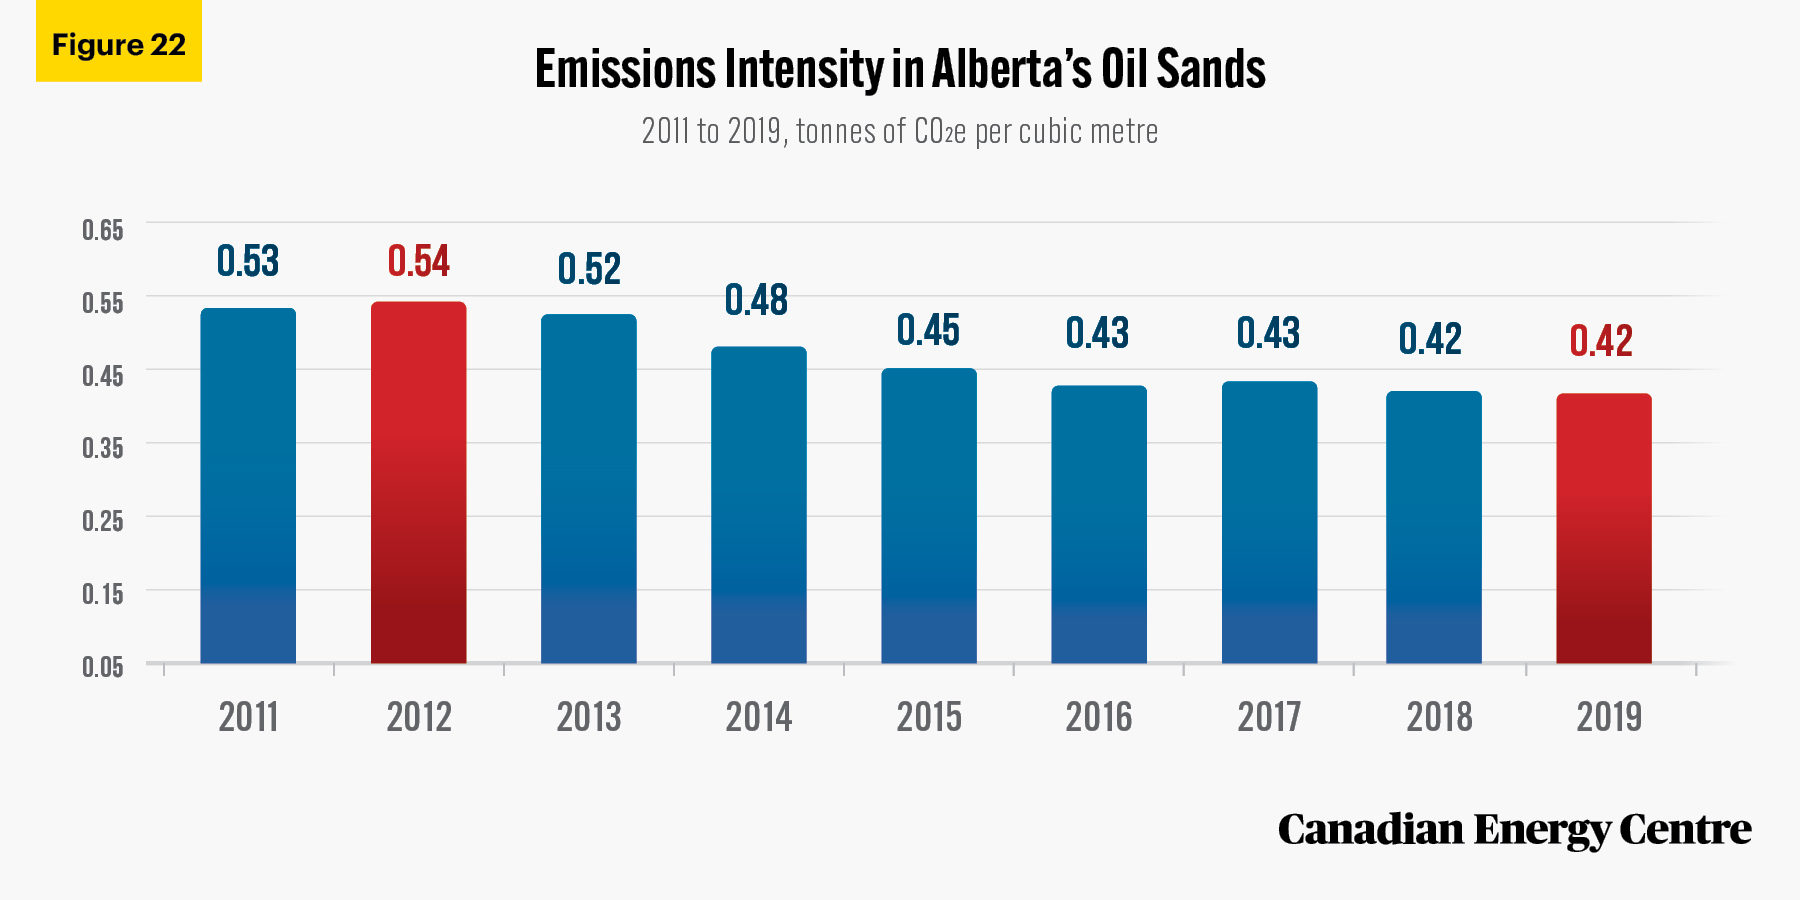
Source: Alberta (2021a).
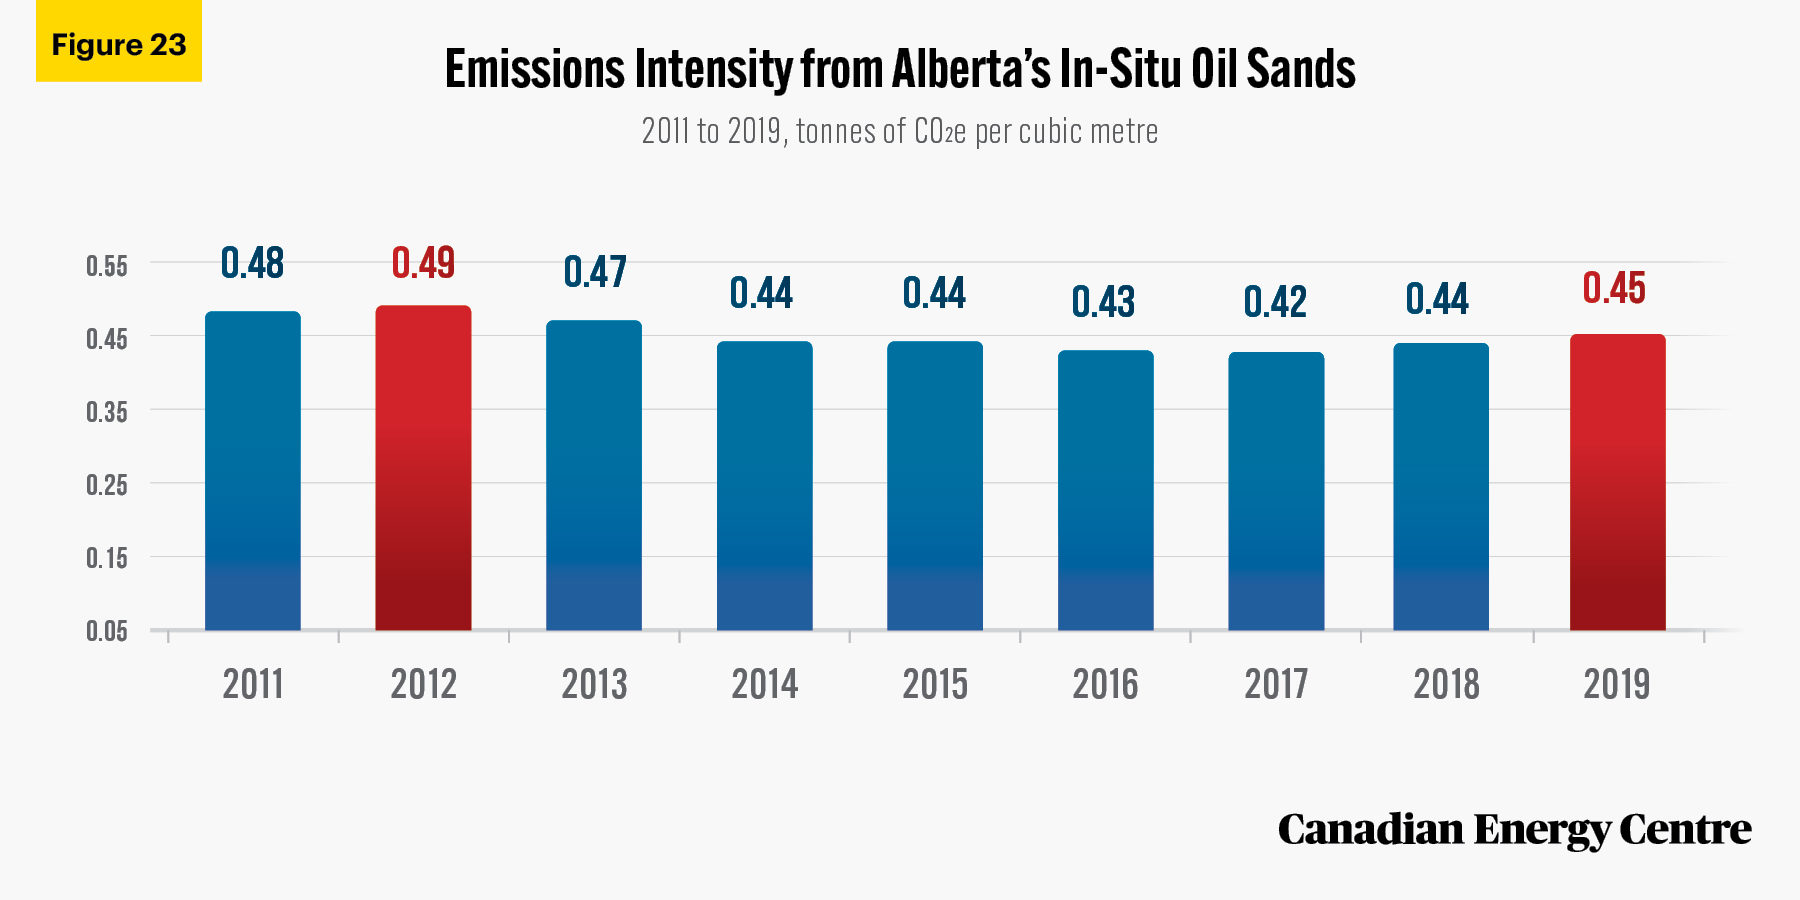
Source: Alberta (2021a).
Source: Alberta (2021a).
Alberta oil sands emissions compared with global and U.S. averages
An analysis of the amount of GHG emissions per unit of output over the life and use of the product—production, transportation, refining, and end use—is known as the “lifecycle analysis” (LCA) of GHG emissions intensity. Crude oil is not homogenous and the differences in properties, geography, geology, and even the operators give rise to differences in emissions.
IHS Markit found the average lifecycle intensity of the Canadian oil sands in 2018 to range from 1.6 per cent below the U.S. average (the lowest to date) to 8.6 per cent above the U.S. average, depending on the production process (IHS Markit, 2020).
Furthermore, IHS Markit notes that the GHG emissions intensity of the Canadian oil sands has continued to decline as new, lower GHG emissions intensity forms of production have increased output and as legacy mining operations have improved their emissions intensity (IHS Markit, 2020).
According to BMO, with GHG intensity down about 24 per cent since 2012, the oil sands now emit just 4 per cent to 6 per cent more than the global average of crude oils, from production to end-use, and several projects already boast below-average carbon footprints (BMO Capital Markets, 2020).
Analysis
Part III: What about the future?
According to IHS Markit’s 2018 study, the deployment of commercial and near-commercial technologies and efficiencies could result in a 17 to 27 per cent reduction in the GHG intensity of steam-assisted gravity drainage (SAGD) operations (which accounted for 45 per cent of oil sands supply in 2017) by 2030 and a 15 per cent to 20 per cent reduction in the GHG intensity of mined oil sands. On a full lifecycle basis (inclusive of emissions from production to combustion), these upstream intensities would place these sources within 2 to 4 per cent and 5 to 7 per cent of the average crude oil refined in the United States, respectively (IHS Markit, 2018).
Alberta forecasts that leading oil producers in that province are on track for a further 16 to 23 per cent reduction in GHG intensity over the coming decade (Alberta, 2021b).
And the base emissions forecast from BMO Capital Markets implies that average oil sands emissions intensity in Alberta could improve by at least another 17 per cent, or about 1.7 per cent per year by 2030, to about 62 kgCO2e per barrel. This trend is led by improvements in SAGD efficiencies and less carbon intensive PFT (Paraffinic Froth Treatment) bitumen mining, both of which will constitute a growing portion of supply in the future (BMO Capital Markets, 2020).
Assuming a selection of promising emerging technologies are successfully deployed, BMO anticipates average emissions intensity improving another 25 to 30 per cent overall by 2040 to around 55 kg per barrel, roughly in line with the global average of 50 kg per barrel (BMO Capital Markets, 2020).
Conclusion:
Canada primed to continue reducing GHG emissions Intensity
Data from a number of credible sources show that Canada’s oil and gas sector has successfully lowered its GHG emissions intensity and is improving its standing in a comparison with other energy-producing and energy-consuming countries.
Canada’s GHG emissions per person, per unit of GDP, per unit of energy used, and per barrel of oil produced, have all declined over the past two decades.
Oil sands emissions intensity levels have also been falling and are expected to continue to drop over the next two decades.
Despite some claims to the contrary, Canada and its energy sector are making progress in reducing emissions intensity and are on track to continue to do so in the future.
References (as of May 12, 2021)
Alberta (2021a). Alberta Oil Sands Greenhouse Gas Emission Intensity Analysis. <https://bit.ly/2Vc89oy>.
Alberta (2021b). Budget 2021. <https://bit.ly/3fIsVY3>.
BMO Capital Markets (2020). The 400 Billion Barrel Opportunity for Friendly Oil, and Canada’s Evolving Role. <https://bit.ly/2Z32ySs>.
CAIT (2015). CAIT Country Greenhouse Gas Emissions: Sources and Methods. <https://bit.ly/3yBua1p>.
Environment and Climate Change Canada (2021a). Canada’s Official Greenhouse Gas Inventory. <https://bit.ly/32qbeV8>.
Environment and Climate Change Canada (2021b). Greenhouse Gas Emissions. <https://bit.ly/2QBi5sb>.
IHS Markit (2018). Greenhouse Gas Intensity of Oil Sands Production. Select report at https://bit.ly/2VJiDvG.
IHS Markit (2020). The GHG intensity of Canadian oil sands production: A new analysis. Select report at https://bit.ly/2VJiDvG.
International Energy Agency (2020). CO2 Emissions from Fuel Combustion. <https://bit.ly/3txeb21>.
Natural Resources Canada (2021). Energy Efficiency Trends Analysis Tables. <https://bit.ly/3dwv9bl>.
Waxman, Andrew R., Achmad Khomaini, and Benjamin D. Leibowicz et al. (2020). Emissions in the Stream: Estimating the Greenhouse Gas Impacts of an Oil and Gas Boom. Environmental Research Letters 15, 1. <https://bit.ly/38yHyHF>.
Climate Watch (2021). Historical GHG Emissions. <https://bit.ly/3hRfvYi>.
CEC Research Briefs
Canadian Energy Centre (CEC) Research Briefs are contextual explanations of data as they relate to Canadian energy. They are statistical analyses released periodically to provide context on energy issues for investors, policymakers and the public. The source of profiled data depends on the specific issue. Note that percentages and figures in this Research Brief are calculated from the original data which includes multiple decimal points and which are then rounded to the nearest decimal point or whole number. Thus, further calculations based on the resulting numbers and percentages would not exactly equal proportions noted herein and would be incorrect.
About the authors
This CEC Research Brief was compiled by Lennie Kaplan, Chief Research Analyst at the Canadian Energy Centre and Mark Milke, Executive Director of Research for the Canadian Energy Centre.
Acknowledgments
The authors and the Canadian Energy Centre would like to thank and acknowledge the assistance of two anonymous reviewers.
Creative Commons Copyright
Research and data from the Canadian Energy Centre (CEC) is available for public usage under creative commons copyright terms with attribution to the Canadian Energy Centre. Attribution and specific restrictions on usage including non-commercial use only and no changes to material should follow guidelines enunciated by Creative Commons here: Attribution-NonCommercial-NoDerivs CC BY-NC-ND.
Photo Credits
Marcin Jozwiak, M. Maggs, Maarten van den Heuvel, Mwangi Gatheca, Free-Photos, Jörg Vieli, James Wheeler
The unaltered reproduction of this content is free of charge with attribution to Canadian Energy Centre Ltd.