To sign up to receive the latest Canadian Energy Centre research to your inbox email: [email protected]
Download the PDF here
Download the charts here
Introduction
Natural gas is one of the world’s fastest-growing energy sources, representing more than 23 per cent of global energy demand, according to the International Energy Agency (IEA). Natural gas is vital to the energy mix in many emerging economies, including countries in the Asia-Pacific region.
Recent forecasts from a variety of sources predict a growing demand for natural gas in the coming decades. The IEA forecasts that despite the dip in demand for natural gas in 2020, 2021 will be a year of gradual recovery and natural gas requirements will rebound during the year. The IEA also believes that in 2021 the Asia-Pacific region will account for half the global growth in natural gas consumption.
As the world’s fourth-largest producer of natural gas, Canada has the potential to capitalize on energy demand in the Asia Pacific region. In Canada, 71 per cent of marketable¹ natural gas is produced in Alberta, followed by British Columbia with 27 per cent, Saskatchewan with 2 per cent, and only minor amounts produced in Eastern Canada (as of 2019).
Dependence on America and opportunities in Asia
All of Canada’s natural gas exports go to the United States though such exports have been decreasing in recent years. (The discovery of shale gas in Western Canada and in the United States changed international natural gas market dynamics, increasing supply and decreasing prices.²) In 2018, Canada exported 7.8 billion cubic feet per day to the US, but in 2019 just 7.4 billion cubic feet per day.
However, the expansion of shale gas production in Canada and the US has also created an opportunity for both countries to seek new markets in Asia. In this CEC Sheet, we explore the differential between prices for Canada’s natural gas and prices for natural gas in significant trading hubs worldwide, including Germany, Japan, South Korea, and the Asian average. Relative to Western Canada and the Asia Pacific market for natural gas (in the form of Liquified Natural Gas, or LNG), the price difference between Canada and Asia provides an opportunity for Canadian natural gas producers to export to Asia Pacific markets.
Natural gas price differences between Canada and selected markets
Closer US-Canada prices
Between 1990 and 2019, US Henry Hub and Canadian AECO-C natural gas spot trading prices have closely tracked each other, though the price differences could still be significant and to the advantage of the US (see Figure 1).³
- For example, the tightest price gap was in 2008 when US natural gas sold for U$8.85 per million BTU, just 11 per cent higher than the US$7.99 that Canadian (Alberta’s AECO-C) natural gas fetched that year.
- In contrast, the largest percentage gap was in 2018 when US natural gas sold for U$3.13 per million BTU, 179 per cent higher than the US$1.12 average price for Canadian (Albertan) natural gas that year.
1. Marketable natural gas consists of at least 90 per cent methane and meets the specification for pipeline transport and sale for general distribution to the public.
2. Beyond lower-cost shale, many other factors influence natural gas prices, including demand and supply, production and exploration, storage and withdrawal, weather, and access to demand markets, such as the Asia-Pacific region.
3. From October 2019 through March 2020, there was little difference in the spot prices between the AECO-C trading hub in Canada and Henry Hub in the US. In April and May 2020, AECO-C natural gas spot prices increased compared to Henry Hub. According to the EIA, most of the spot price volatility in Canada’s AECO-C trading hub is due to regulatory changes for Western Canada’s pipeline operations.
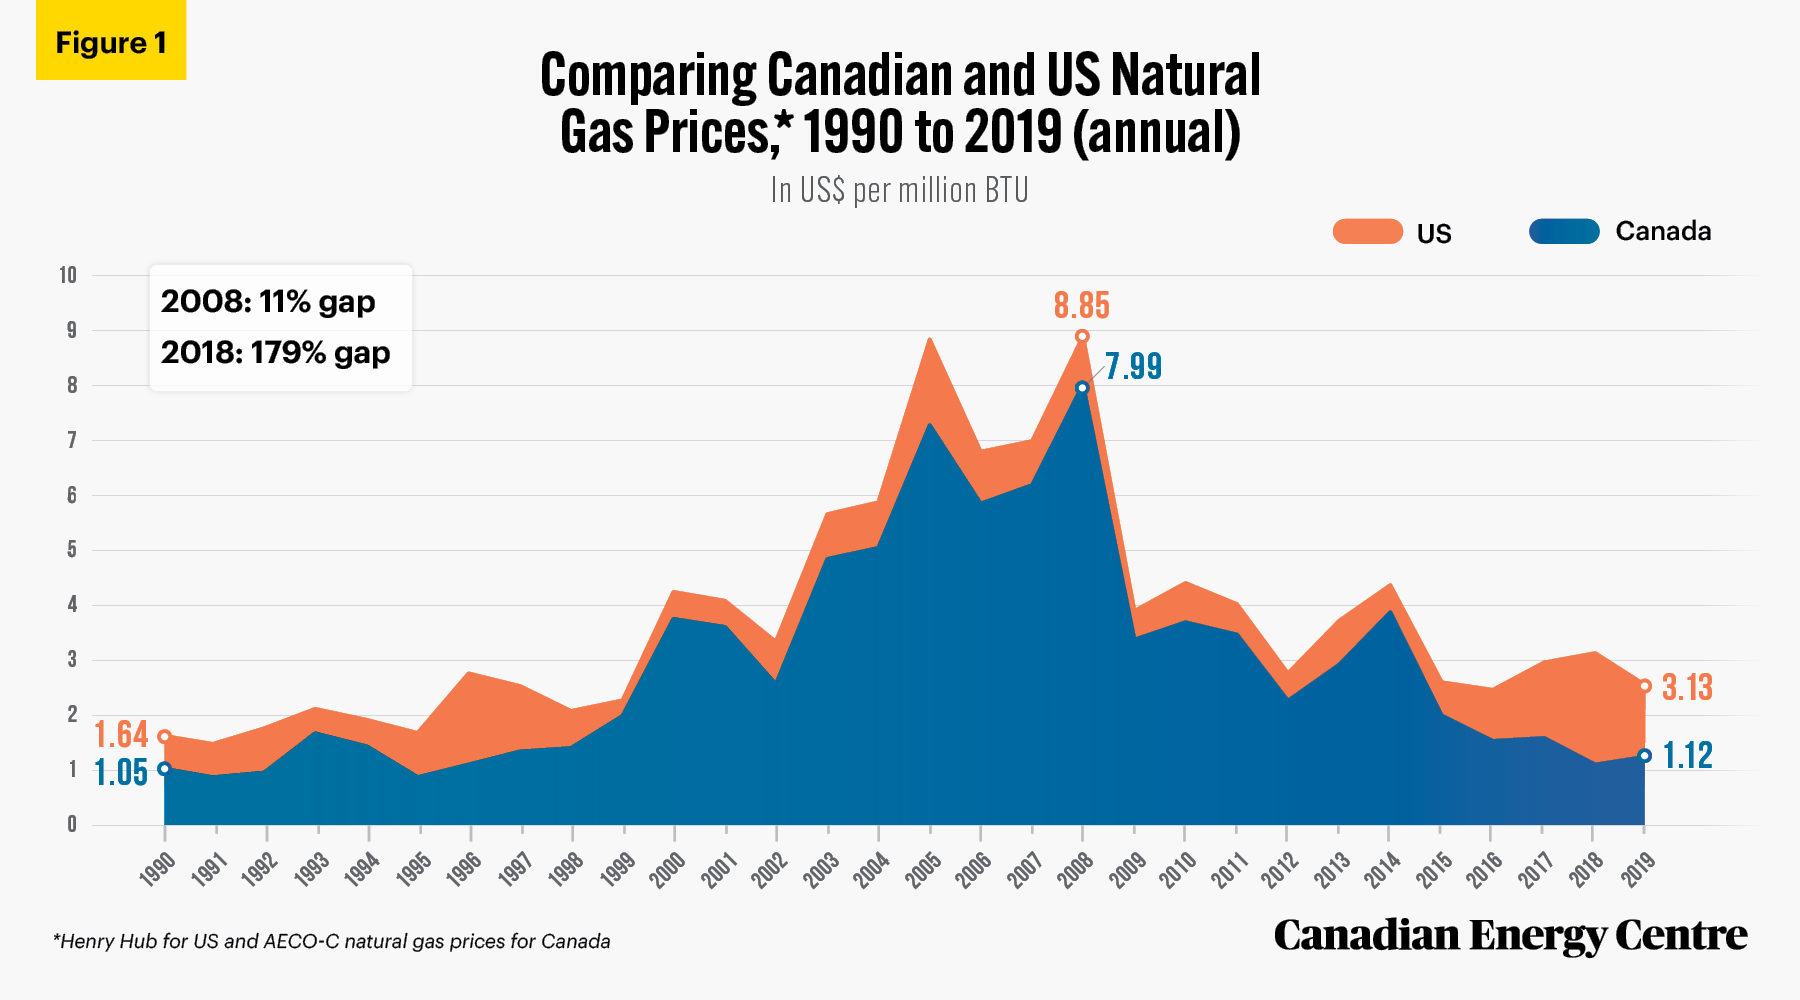
Source: BP Statistical Review (2020).
Three comparisons on natural gas prices from Asia
In contrast to the (somewhat) close tracking between US and Canadian natural gas prices, the opposite is true in comparisons between Canada and the Asia average price over the years, and in country-specific comparisons with Japan and South Korea.
In most years since 2000, average natural gas prices in Asia have been higher than in Canada (see Figure 2). The exceptions were in 2003 when Asian spot prices were three per cent higher and in 2005 when they were three per cent lower than in Canada. In most other years, the percentages and prices for natural gas sold in Asia have been significantly higher than in Canada. For example,
- In 2012, natural gas sold for US$2.27 per million BTU in Canada on the AECO-C trading hub, but for US$18.15 in Asia, or $15.88 more, fully 699 per cent higher.
- 2018 saw the largest percentage gap with natural gas selling for US$1.12 per million BTU in Canada but US$9.80 in Asia, or $8.68 more (775 per cent higher).
- The trend since 2009 has been for Asian natural gas prices to be higher than Canadian natural gas by triple percentages, i.e., selling for between 122 and 775 per cent more in Asia than in Canada depending on the year.
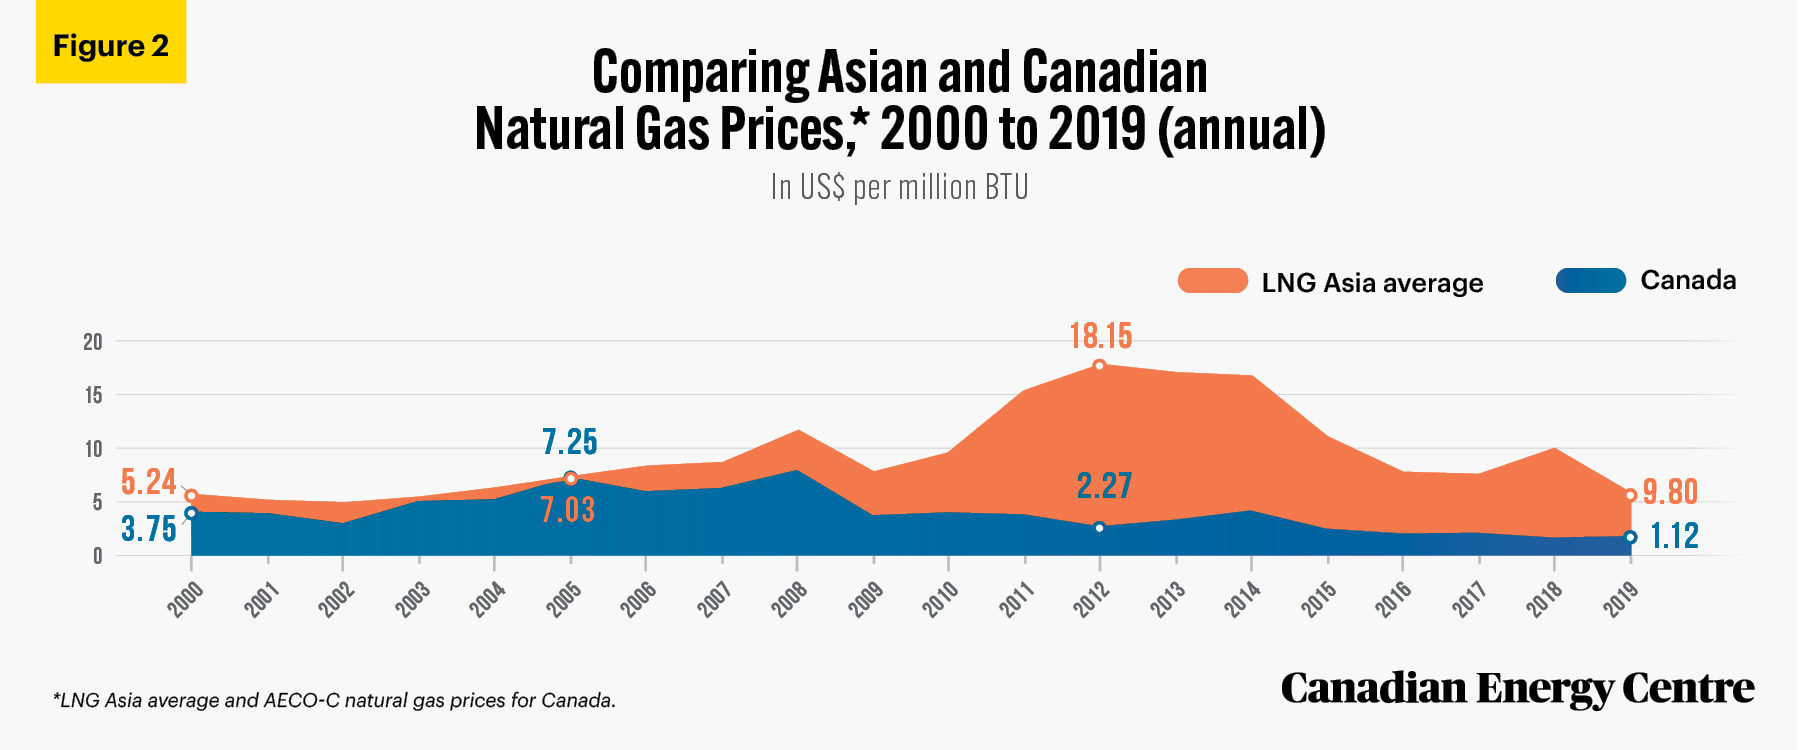
Sources: BP Statistical Review (2020) and International Monetary Fund (2021).
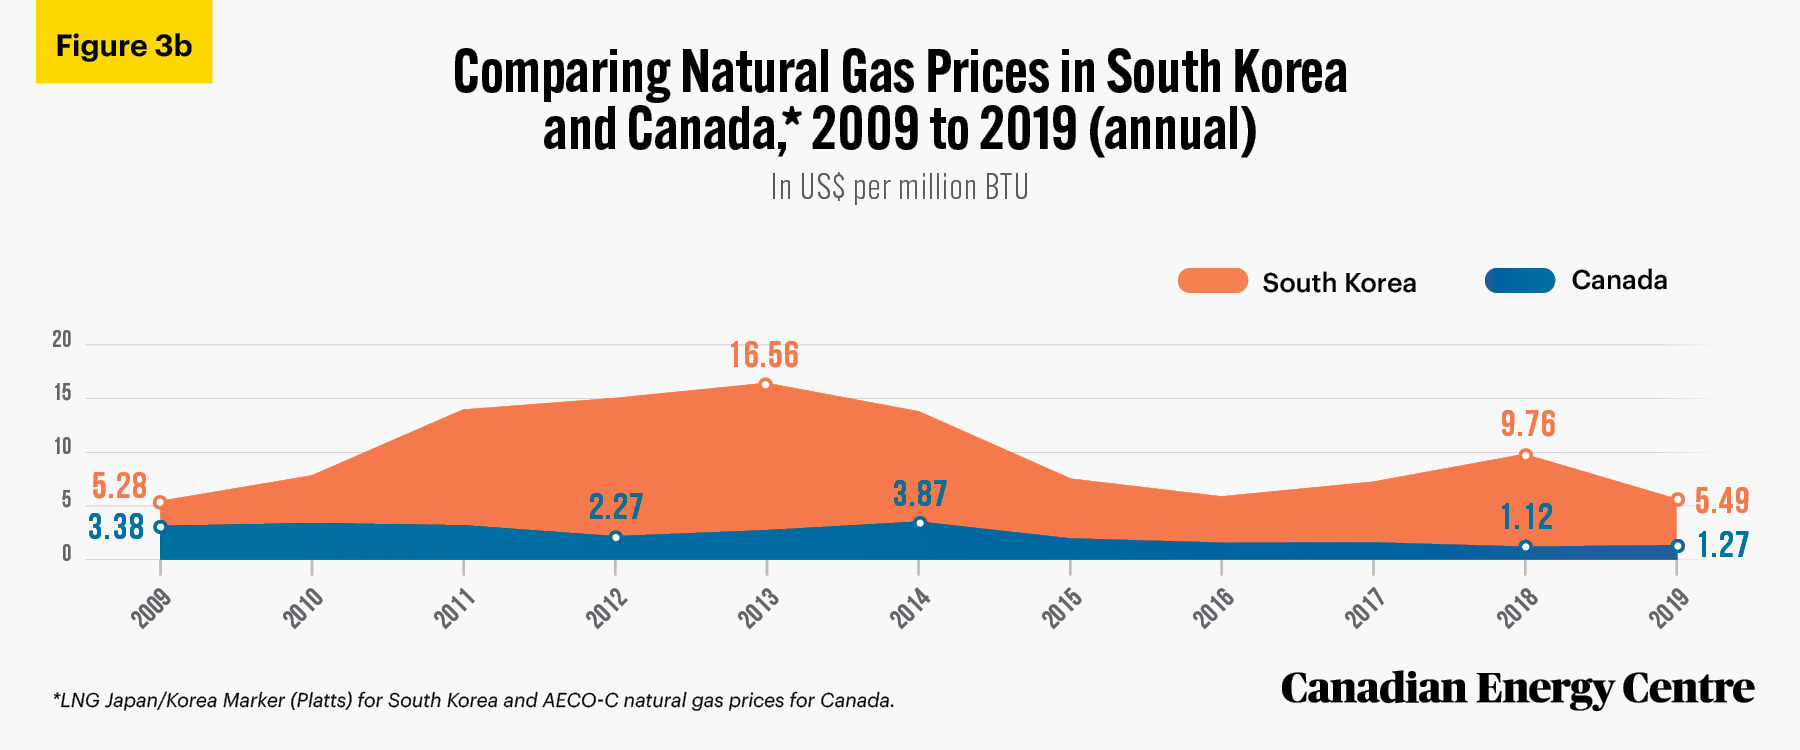
Price comparisons between Canada and Japan and South Korea mostly follow this same pattern; since 2009, price differences between Canada and both countries has been substantial (see Figures 3a and 3b).
- Prices in Japan were lower than in Canada only in 2003 and 2005 (by 1 per cent and 17 per cent).
- In every other year, prices for natural gas in Japan were higher by from 3 per cent (in 2004) to 797 per cent (in 2018).
- The highest dollar gap between prices in Canada and Japan was in 2012 when natural gas sold for US$2.27 per million BTU in Canada but US$16.75 in Japan, $14.48 higher, or 638 per cent more.
- In South Korea, where data are available only from 2009 onward, prices for natural gas have always been above those in Canada, with a range of between US$1.90 and US$13.63 more per million BTU (in 2009 and 2013 respectively).
- Measured as a percentage, natural gas prices in South Korea have ranged from 56 per cent more in 2009 to 771 per cent higher in 2018. That year, natural gas prices were US$9.94 per million BTU in South Korea and just US$1.27 in Canada, $8.84 higher in South Korea.
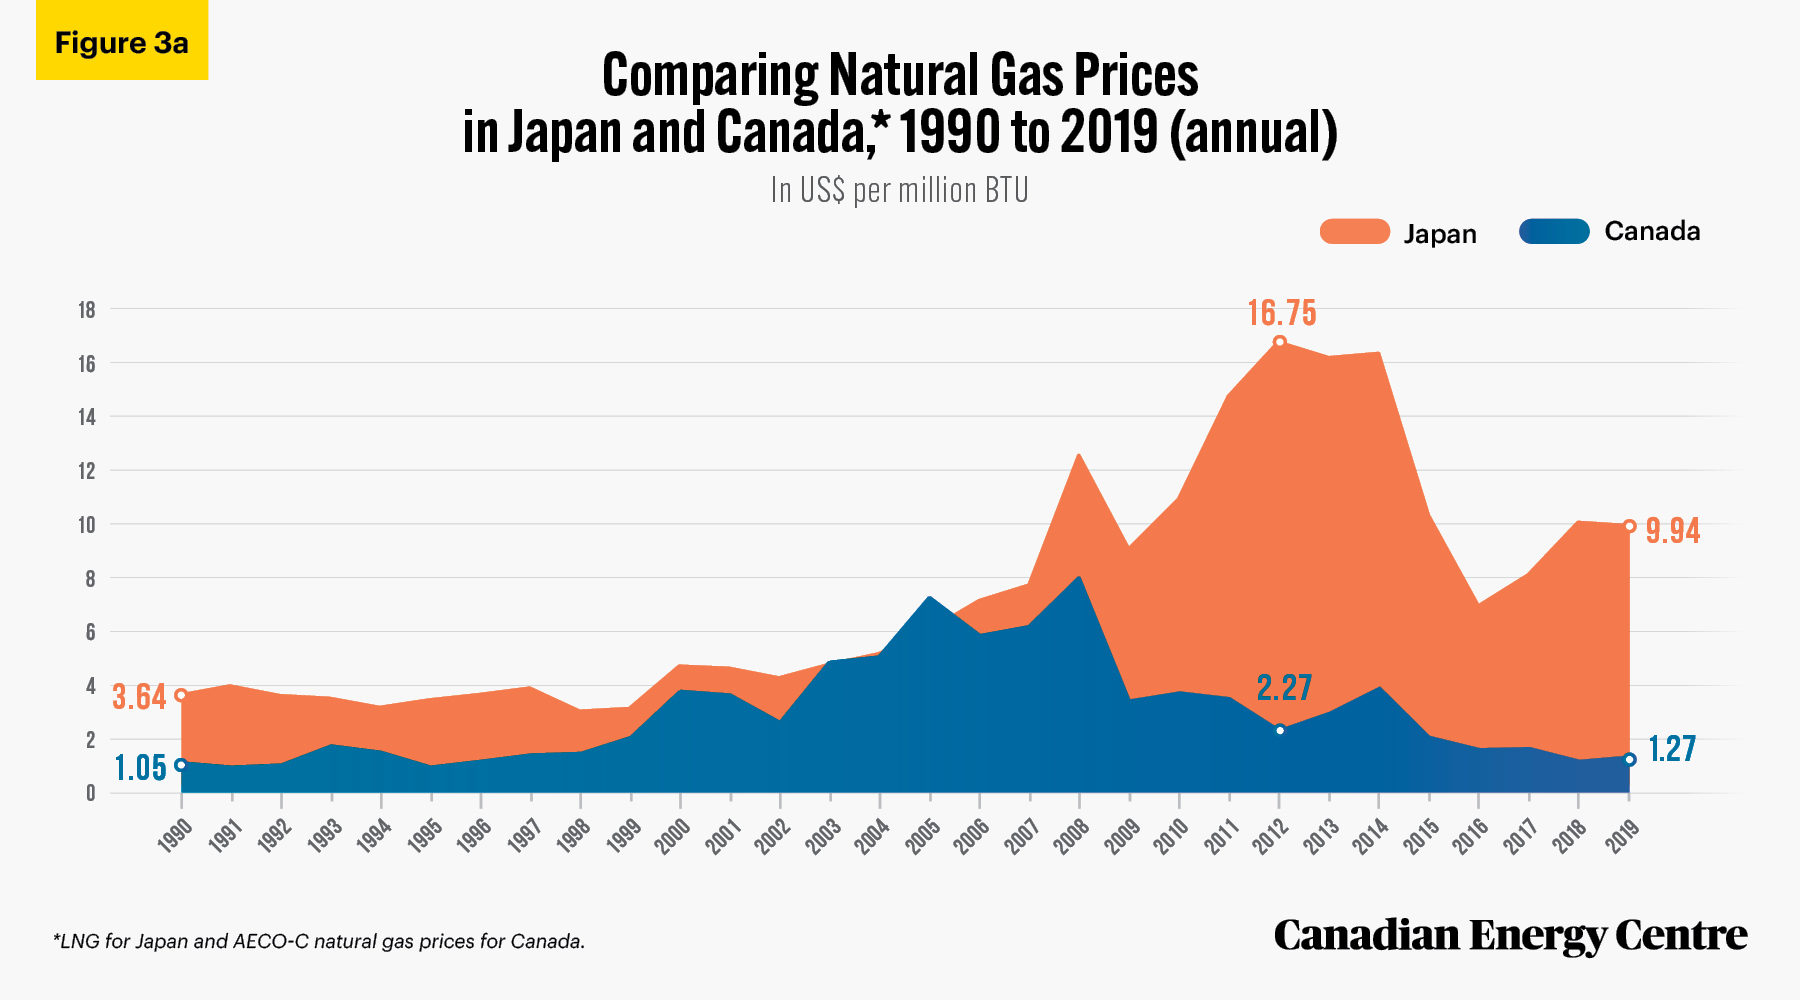
Source: BP Statistical Review (2020).
Source: BP Statistical Review (2020).
Canada’s natural gas advantages
Of note, Western Canada currently has a cost advantage over other LNG exporting countries such as Qatar and Australia.
• That is due in part to lower ambient temperatures in Canada’s western provinces (cooler temperatures help lower liquefaction costs). Specifically, British Columbia’s temperature is cooler than that of other major LNG producing regions such as Qatar, Australia, and the US Gulf Coast. (British Columbia has an energy efficiency advantage of 34 per cent over Australia, 32 per cent over Qatar, and 26 per cent over the US Gulf Coast for LNG liquefication.)
• Shipping costs to Japan from Canada are estimated at between 99 cents and $1.09 per million BTU. Shipping costs to Japan from Qatar are estimated at between $1.50 and $1.54 per million BTU. Shipping costs to Japan from US Gulf of Mexico are estimated at between $2.40 and $2.45 per million BTU.
• Also, Canada’s west coast is closer to Japan than is Qatar, which is 11,773 kilometres away from the Japanese port of Himeji and 12,056 kilometers away from the port at Sodegaura. Canada’s westernmost port (Kitimat) in British Columbia is 7,698 kilometres away from Himeji and 7,322 kilometers away from Sodegaura. These distinct Canadian advantages offer a compelling case for Canadian LNG exports to the Asia Pacific.
Summary
The above data on the liquefaction process and shipping costs, coupled with the lower cost of the natural gas itself in Western Canada, translate into relatively lower LNG prices in Canada, and help make Canadian LNG significantly more competitive and thus attractive to the Asia Pacific market. The natural gas price differentials and Canada’s natural advantages give Western Canada a good opportunity to supply natural gas to the Asia-Pacific markets at competitive prices. Canadian LNG could be a strong competitor to the traditional natural gas exporting countries now serving the Asia-Pacific LNG market.
Natural gas pricing: A primer
Many factors influence global natural gas prices, including supply and demand, production and exploration levels, the location and size of storage facilities, weather patterns, and buyers’ and sellers’ views of future trends.
Benchmark oil prices, such as Brent crude or West Texas Intermediate (WTI) are available for global markets. However, there are no comparable significant international benchmark prices for natural gas.
Spot prices for natural gas are region-centric. For example, Henry Hub is the benchmark price for North American natural gas. In Alberta, it is NOVA/AECO-C; in the UK, it is the National Balancing Point (NBP); in the Netherlands, the Title Transfer Facility (TTF); and in Asian-Pacific LNG market, the Japan/Korea Marker (JKM). Other regions in Canada with their own spot prices include Station 2, Alliance ATP, and Dawn in Ontario.
The AECO-C is the spot trading price for Alberta gas. The Alberta AECO-C hub is Canada’s largest natural gas trading hub, and the AECO-C price serves as a benchmark for Alberta wholesale natural gas transactions.
The AECO-C natural gas price is discounted compared to the benchmark price for natural gas in North America, the Henry Hub price. Henry Hub is the central pricing point for natural gas produced in the United States. The AECO-C and Henry Hub price differential narrowed in 2019 to US$1.29 per million BTU, down from US$1.95 per million BTU in 2018.
The discount for Canadian natural gas relative to Henry Hub exists in part because Alberta and other western Canadian natural gas fields are further away from US markets than are American suppliers and Canadian transportation costs are thus higher. This, combined with the fact that the US is currently the only market for Canada’s natural gas—Canada has yet to complete a single LNG export terminal, though one is under construction at Kitimat, British Columbia—means that AECO-C natural gas has traded at a discount of more than US$2.00 per million BTU in recent years, or about 60 per cent of the Henry Hub price.
However, lower natural gas prices in Western Canada can be beneficial for upcoming liquefied natural gas (LNG) projects designed to transport natural gas to Asia-Pacific markets because they will reduce the LNG plants’ input cost.
There is no standard global LNG pricing system. LNG contract prices are linked to international oil index prices, like Brent, and some are linked to regional natural gas indexes, such as Henry Hub. In recent years, a new benchmark has been developed for LNG
in Asia-Pacific markets—the Platts Japan/Korea Marker (JKM)—which is now the benchmark price for LNG deliveries in Japan and Korea. These two countries are currently the largest LNG importers globally, accounting for 33 per cent of the world’s LNG imports.
The price difference between North America’s leading benchmark Henry Hub spot price and LNG Asia spot prices was more than US$18 per million BTU at the beginning of 2021.⁴
Canada is a late entrant into the LNG market. Currently, 13 LNG projects are proposed and one is under construction in BC. Given that the demand for LNG in the Asia-Pacific market is currently being filled by traditional players such as Qatar and Australia, the entry of new players, such as Canada, will create a new dynamic in the coming years. The AECO-C benchmark natural gas price is lower than the Asia-Pacific benchmark LNG price, which could mean that buyers in the Asian-Pacific might turn to Canadian LNG, assuming the near-term completion of LNG projects in Canada.
4. Many factors influence final LNG prices. LNG pricing is not as transparent as oil pricing, as it involves many additional costs including the cost of feedstock (i.e., the natural gas cost), and liquefaction and shipping costs. The selling cost also must cover the seller’s capital and operating costs. Several studies have explored the viability of LNG projects and noted that the main drivers for LNG projects are capital costs, the availability of cheap natural gas feedstock, pipeline transportation costs, and operating costs.
Notes
This CEC Fact Sheet was compiled by Ven Venkatachalam and Mark Milke at the Canadian Energy Centre (www.canadianenergycentre.ca). All percentages in this report are calculated from the original data, which can run to multiple decimal points. They are not calculated using the rounded figures that may appear in charts and in the text, which are more reader friendly. Thus, calculations made from the rounded figures (and not the more precise source data) will differ from the more statistically precise percentages we arrive at using source data. The authors and the Canadian Energy Centre would like to thank and acknowledge the assistance of Dennis Sundgaard in reviewing the data and research for this Fact Sheet. Image credits: Seoul, South Korea, by Sesinando from Pexels.com
References (All links live and updated as of April 5, 2021)
AER (June 2020), Natural Gas Prices: Highlights of 2020 <https://bit.ly/3tzznnL>; BP (2020), Statistical Review of World Energy 2020 (69th edition) <https://on.bp.com/3s1sHhZ>; BP (n.d.), Outlook for Gas is More Resilient than for Either Coal or Oil <https://on.bp.com/30UY01V>; Canadian Energy Regulator (2017), Market Snapshot: LNG Projects have an Energy Efficiency Advantage Compared to Other LNG Producers in Warmer Locations <https://bit.ly/3djCr0O>; Canada Revenue Agency (n.d.), Definitions Related to the Fuel Charge <https://bit.ly/3rHgZbf>; EIA (2020, June 19), Higher Western Canada Spot Prices Limit U.S. Natural Gas Imports from Canada <https://bit.ly/3wifjIz>; International Monetary Fund (2021), Global price of LNG, Asia [PNGASJPUSDM], retrieved from FRED, Federal Reserve Bank of St. Louis< https://bit.ly/2RdCJyY>; IEA (2021), Gas Market Report Q1-2021 <https://bit.ly/30XrqMM>; IEA (2020), Gas 2020 <https://bit.ly/3f0Ns9A>; IEA (n.d.), Gas <https://bit.ly/3cdf49H>; Natural Resource Canada (n.d.), Natural Gas Facts <https://bit.ly/3eRSF3w>; J. Peter Findlay (2019), Canadian LNG Competitiveness, Oxford Institute of Energy Studies <https://bit.ly/3d2nr7u>; Claudio Steuer (2019), Outlook for Competitive Energy Supply, Oxford Institute of Energy Studies <https://bit.ly/3gGVl38>; Ven Venkatachalam and Mark Milke (2021), MIA – $130 Billion in LNG: The Global LNG Trade and Canada’s Missed Opportunities <https://bit.ly/2Qax7ow>.
Creative Commons Copyright
Research and data from the Canadian Energy Centre (CEC) is available for public usage under creative commons copyright terms with attribution to the CEC. Attribution and specific restrictions on usage including non-commercial use only and no changes to material should follow guidelines enunciated by Creative Commons here: Attribution-NonCommercial-NoDerivs CC BY-NC-ND.