This Fact Sheet (which can be downloaded here as a pdf) compares Canada and the United States on pipelines built from 2014 to 2020 and offers an international comparison on pipelines under construction as of early 2020. In both comparisons, the data are clear: development in Canada has stagnated while the rest of the world expands.
This lack of new capacity growth in Canada not only has dampened the benefits of investment in pipelines (creating jobs and incomes). It also restricts both the volume of exports and the price Canadian-based companies receive for oil and gas exports. In addition, the stagnation of pipeline construction has led to foregone government revenues in the tens of billions of dollars. Meanwhile, other countries have continued to see significant investment in pipeline construction, with a concurrent rise in oil and gas exports.
Background: The Coronavirus, current demand destruction, and forecasts
The Coronavirus pandemic has affected worldwide demand for oil and natural gas. However, historical trends are useful to place the current demand downturn in perspective. Data available back to the early 1970s for oil (Table 1) show that world oil consumption initially slumped in periods of recession, but post-recession resumed and increased ever higher.
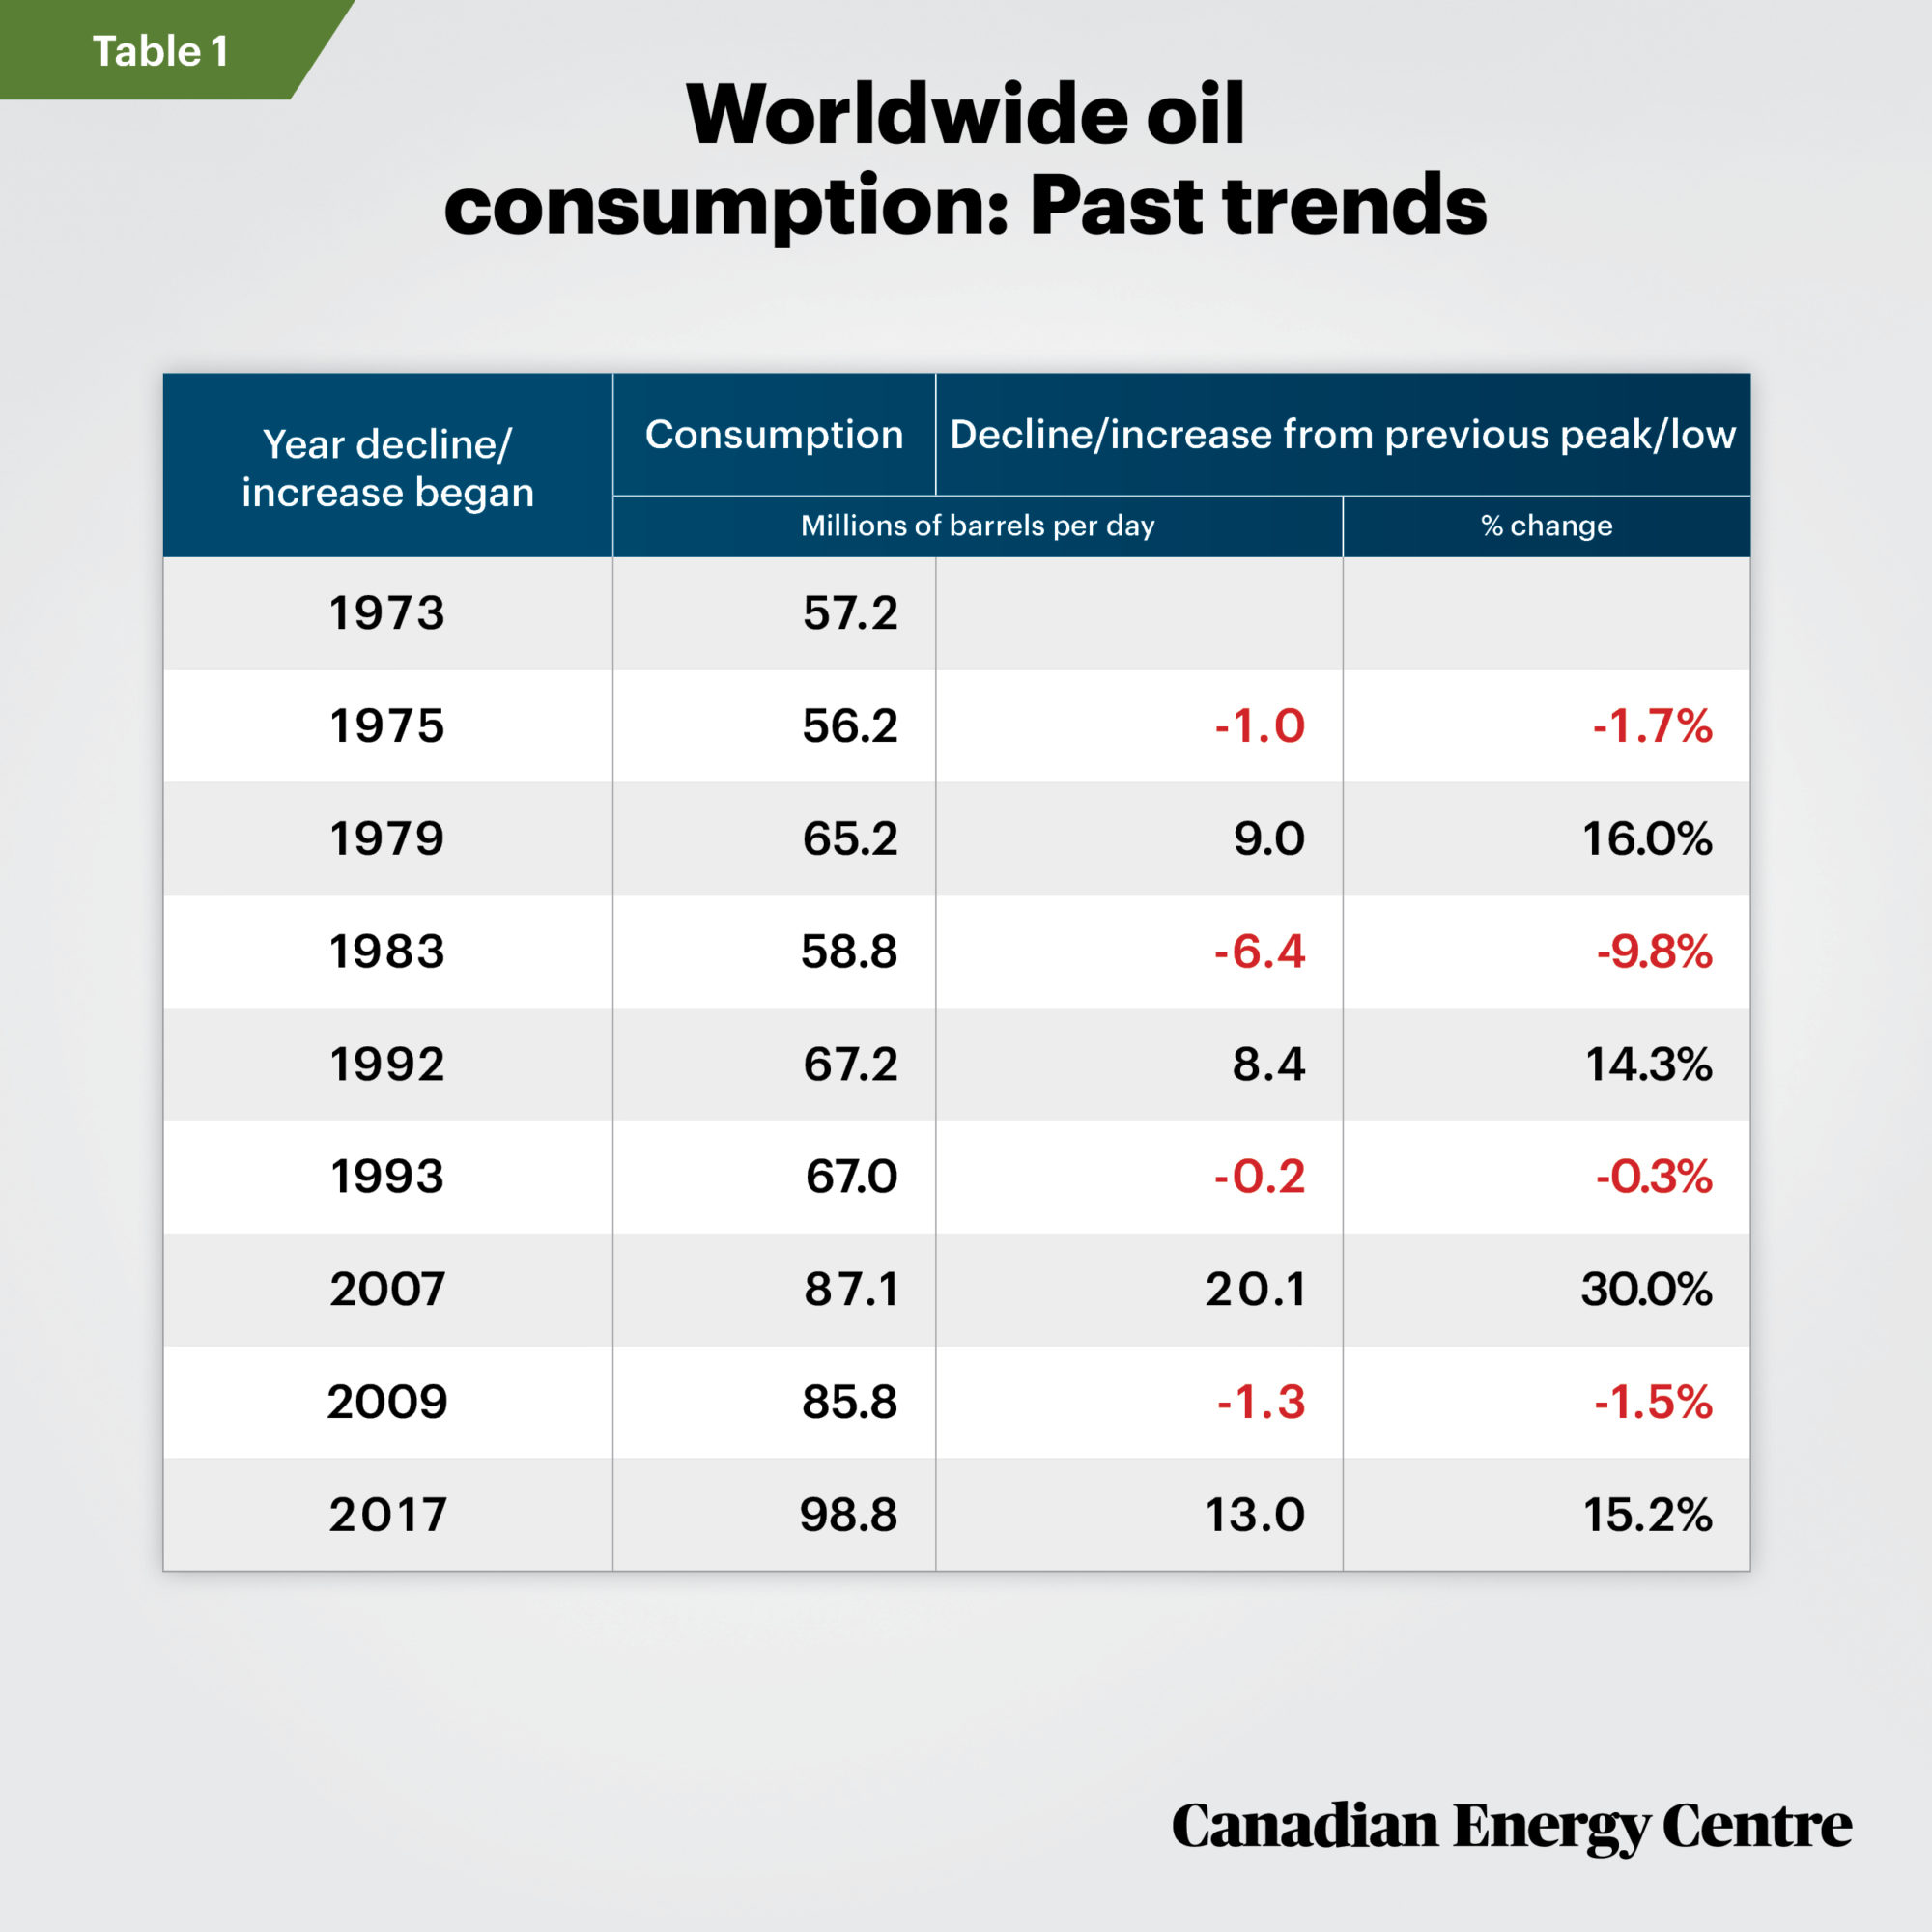
Source: U.S. Energy Information Administration, International Statistics, Crude Oil Consumption
For natural gas (with data available since 2000), world consumption declined only during the 2008/09 recession, and then resumed its upward trajectory.
There is no guarantee that past demand trends for oil and natural gas will repeat themselves in the future. Current estimates from the International Energy Agency (IEA) are that worldwide petroleum consumption could decline by nine per cent in 2020 (by 9.3 million barrels per day) compared with 2019 levels. The IEA expects oil demand to recover gradually in the second half of the year, nearing pre-pandemic levels by December. The IEA notes that natural gas demand could decline year-over-year by five per cent or just 2.7 per cent should the Coronavirus lockdowns end earlier than expected.
In its recent forecast, the IEA did not offer a 2021 demand outlook for oil or natural gas. However, the U.S. Energy Information Administration currently forecasts a recovery in oil demand, worldwide, of 6.4 million barrels in 2021 or a 6.7 per cent increase relative to 2020. On natural gas, the U.S. Energy Information Administration does not offer a worldwide forecast for 2021, but it expects domestic natural gas consumption to fall further, with a total decline from 2019 to 2021 of 3.7 per cent.
Figure 1: Oil and natural gas pipelines built between 2014 to 2020, Canada and the United States
With that context in mind, Figure 1 shows data on pipeline completion from 2014 to 2020 in Canada and the United States. (Data on total pipeline construction completed worldwide for those years is not available.)¹
- Oil: In Canada, just two oil pipelines were completed between 2014 and 2020, compared to 32 oil pipelines completed in the United States over the same period.
- Natural gas: No new natural gas pipelines were built in Canada in those years, while 33 natural gas pipelines were completed in the United States.
1. As an example of one completed pipeline in another part of the world, the Power of Siberia
pipeline, a US$55 billion, 3,000-kilometre natural gas pipeline project that runs from Siberia
to northeast China, was placed into service as of December 2019.
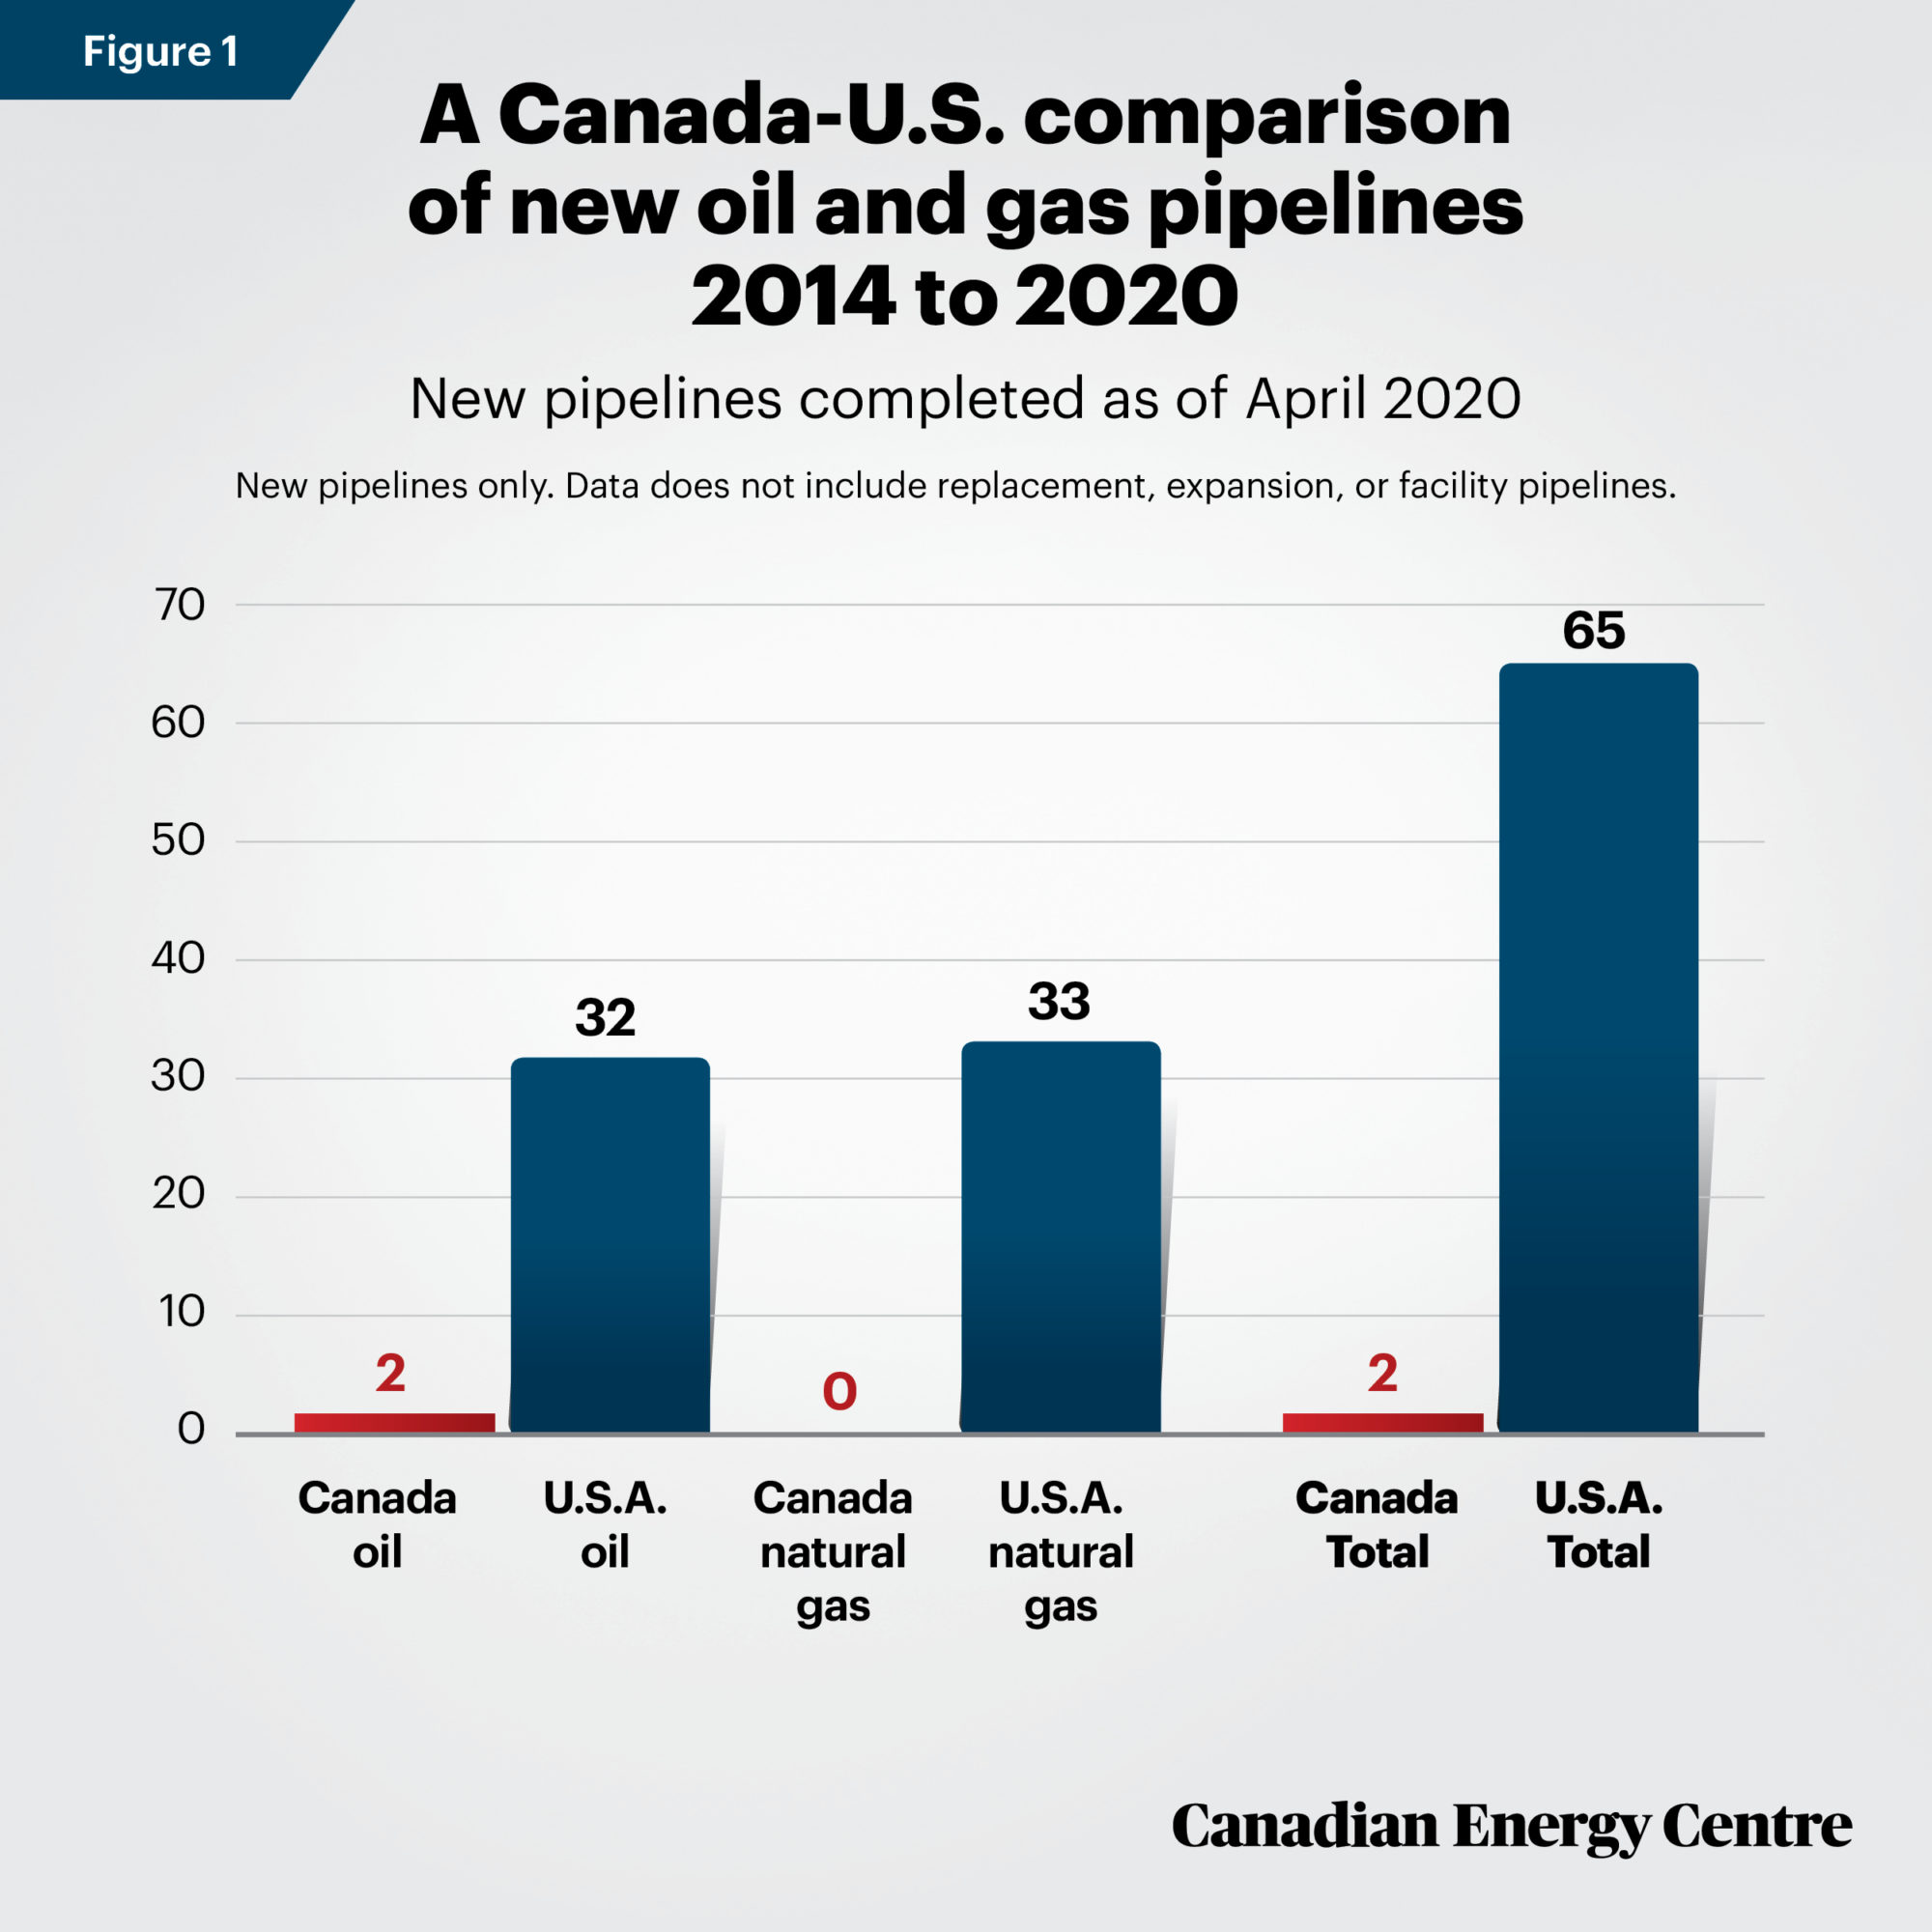
Sources: CAPP; International Energy Agency.
Figure 2: Oil and natural gas pipelines under construction in early 2020
Similar to the Canada-U.S. comparison, the rest of the world has continued to plan and construct oil and natural gas pipelines while activity in Canada has stagnated. As of February 2020, there were nearly 50,000 miles of oil and natural gas pipelines under construction worldwide: Canada’s share was just under 2,000 miles or four per cent, compared with more than 37,000 miles, or over 75 per cent of activity, in the United States and Asia-Pacific region combined.
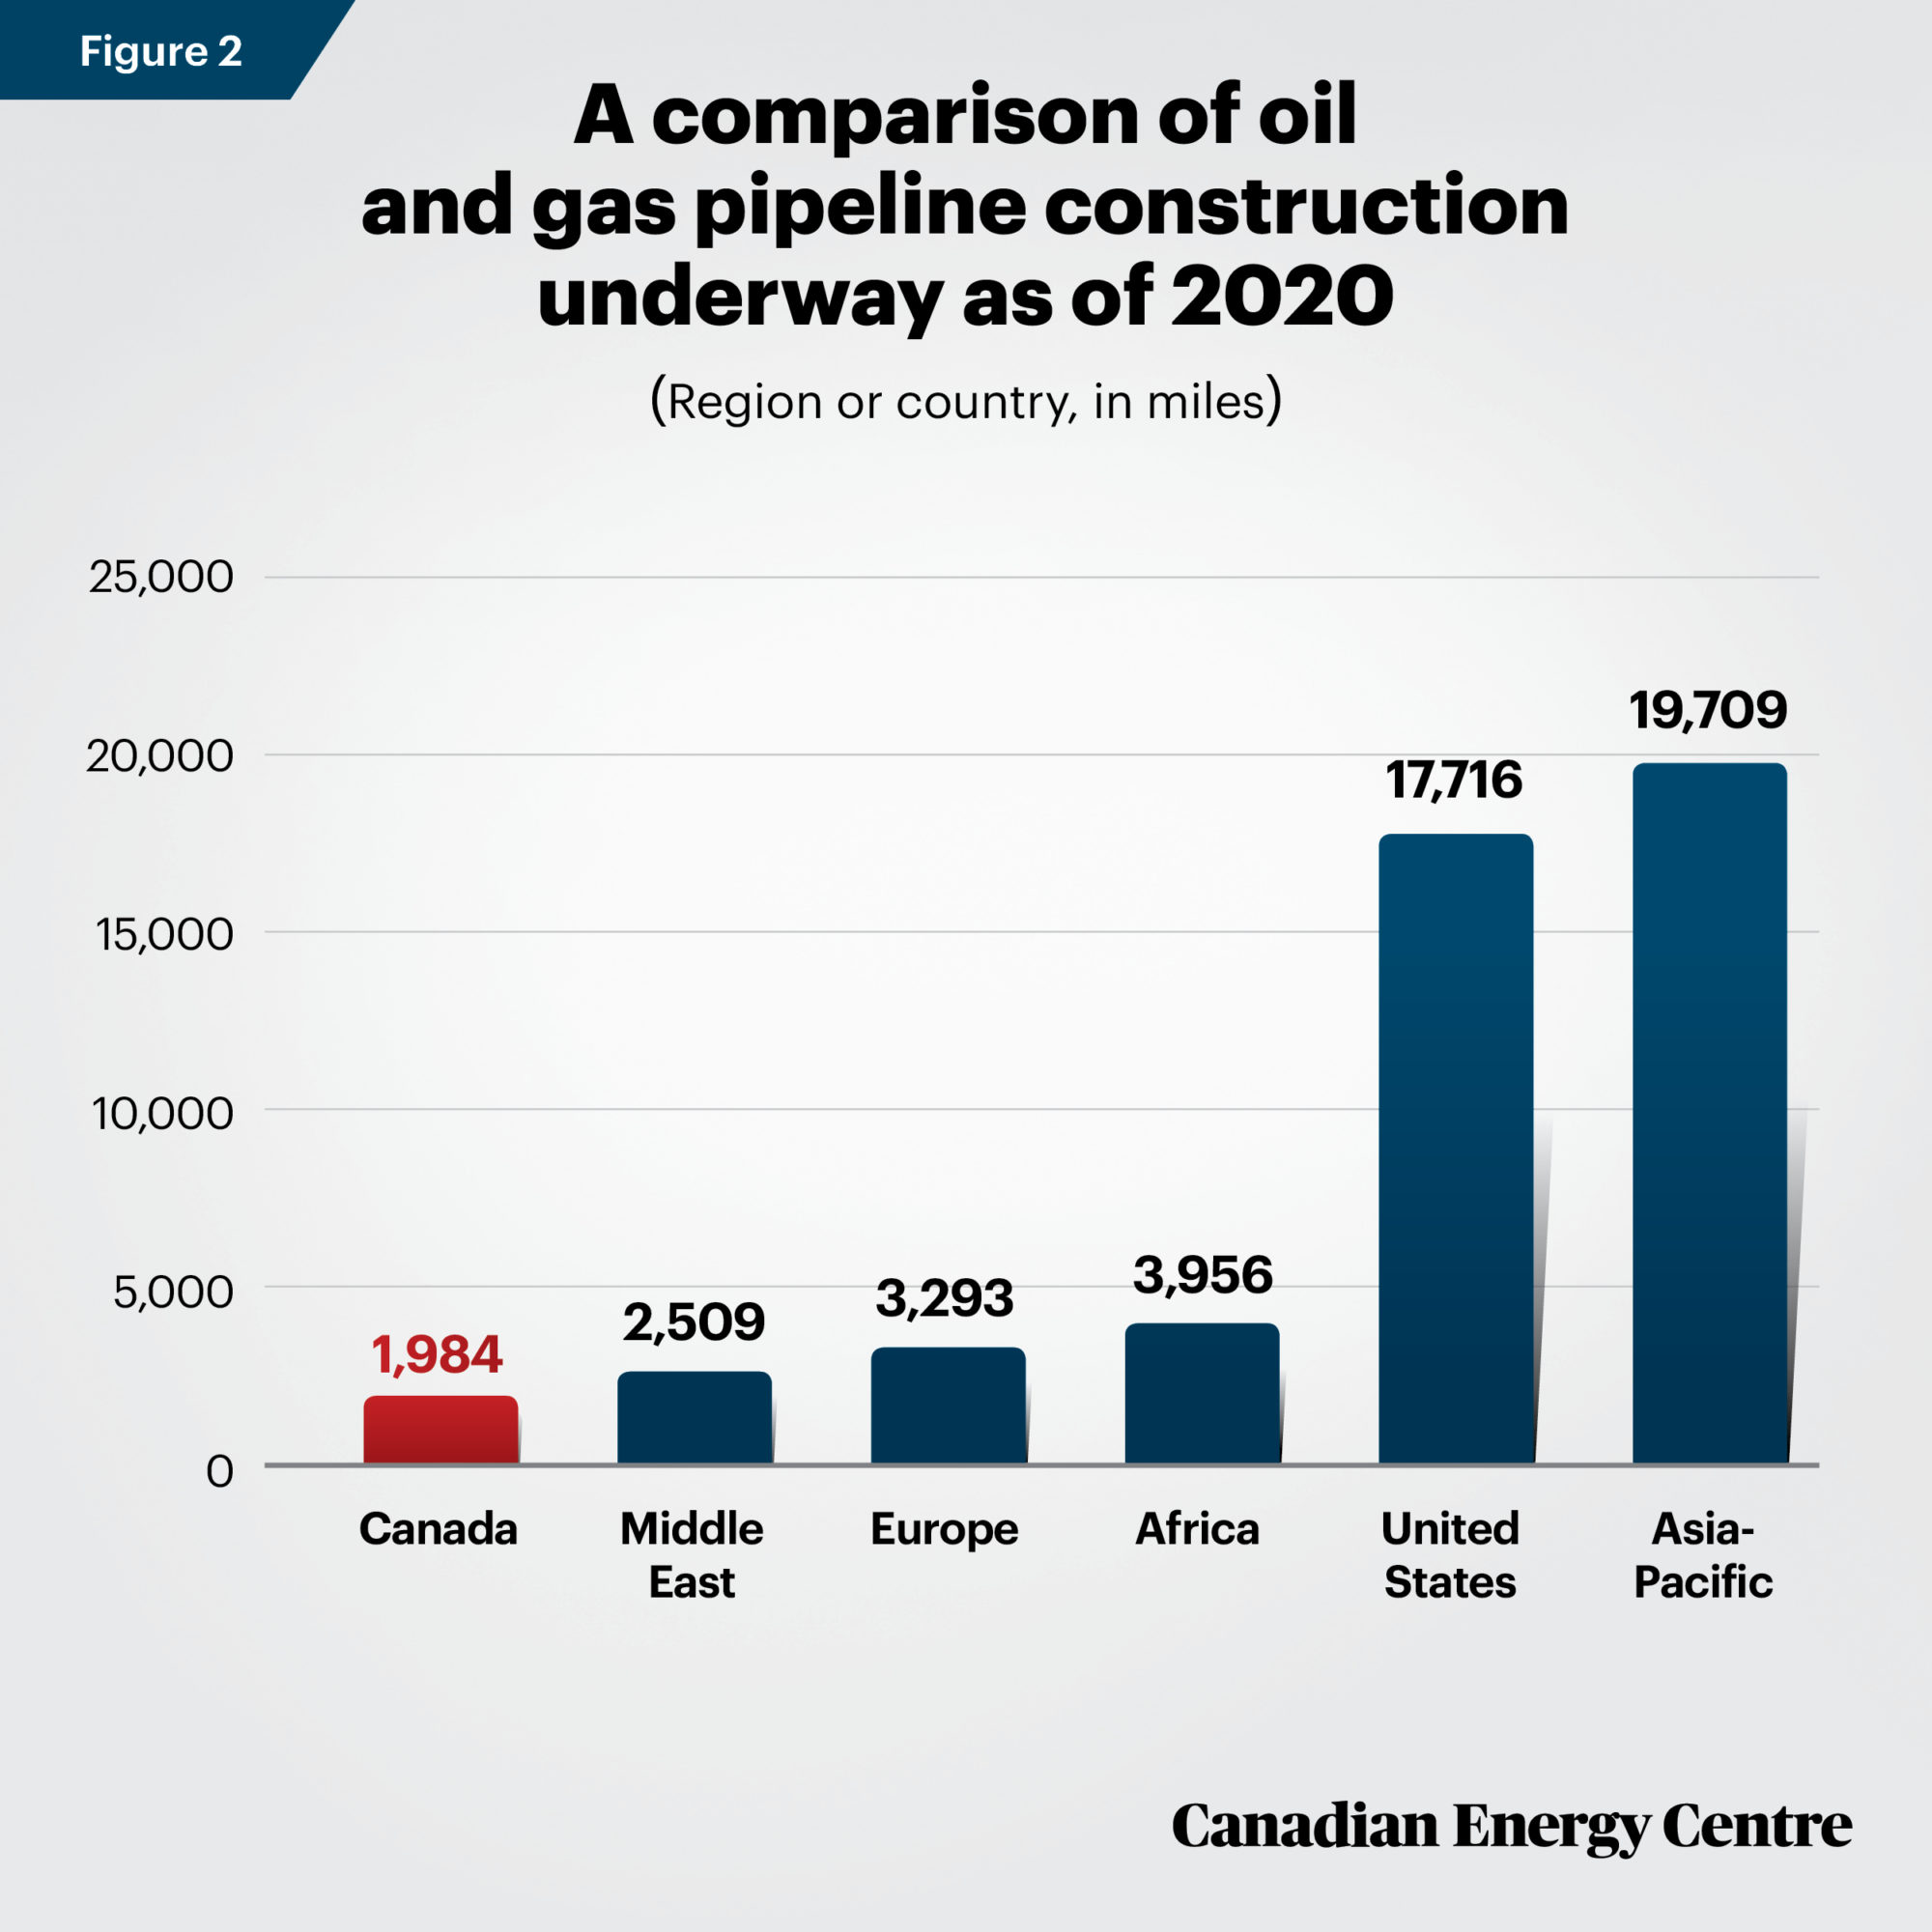
Source: Christopher E. Smit (2020)
Implications for Canada: Foregone tax revenues and shrinking market share
Oil: While Canadian oil exports have risen in recent years, the lack of increased pipeline capacity has exacerbated “differentials” in pricing, i.e., a lower price for Western Canadian Select (WCS) compared to West Texas Intermediate (WTI). The difference in price reflects the heavier quality of WCS relative to WTI, and the additional costs associated with transportation to U.S. refining hubs. Wider discounts have occurred in recent years as pipeline constraints have prevented Canada from transporting additional oil to markets in the United States and Asia.
In a 2019 policy brief from the University of Calgary’s School of Public Policy, authors Tim Hearn and Robert Mansell estimated that Alberta alone lost $40 billion in revenue since 2013 due to the pipeline challenge. The Government of Alberta estimates that without new pipeline export capacity—some of which is now underway but could yet be stalled—Canadian producers and governments would forego more than $43 billion in lost income by 2023, or almost $9 billion per year. The lost income would translate into the loss of about 35,000 jobs per year across Canada.
Natural gas: Canada’s natural gas producers are highly dependent on exports to the American market. U.S. domestic natural gas production has soared in recent years, leading to reduced requirements for Canadian production. The result has been weakened prices and revenue for Canadian producers and governments.
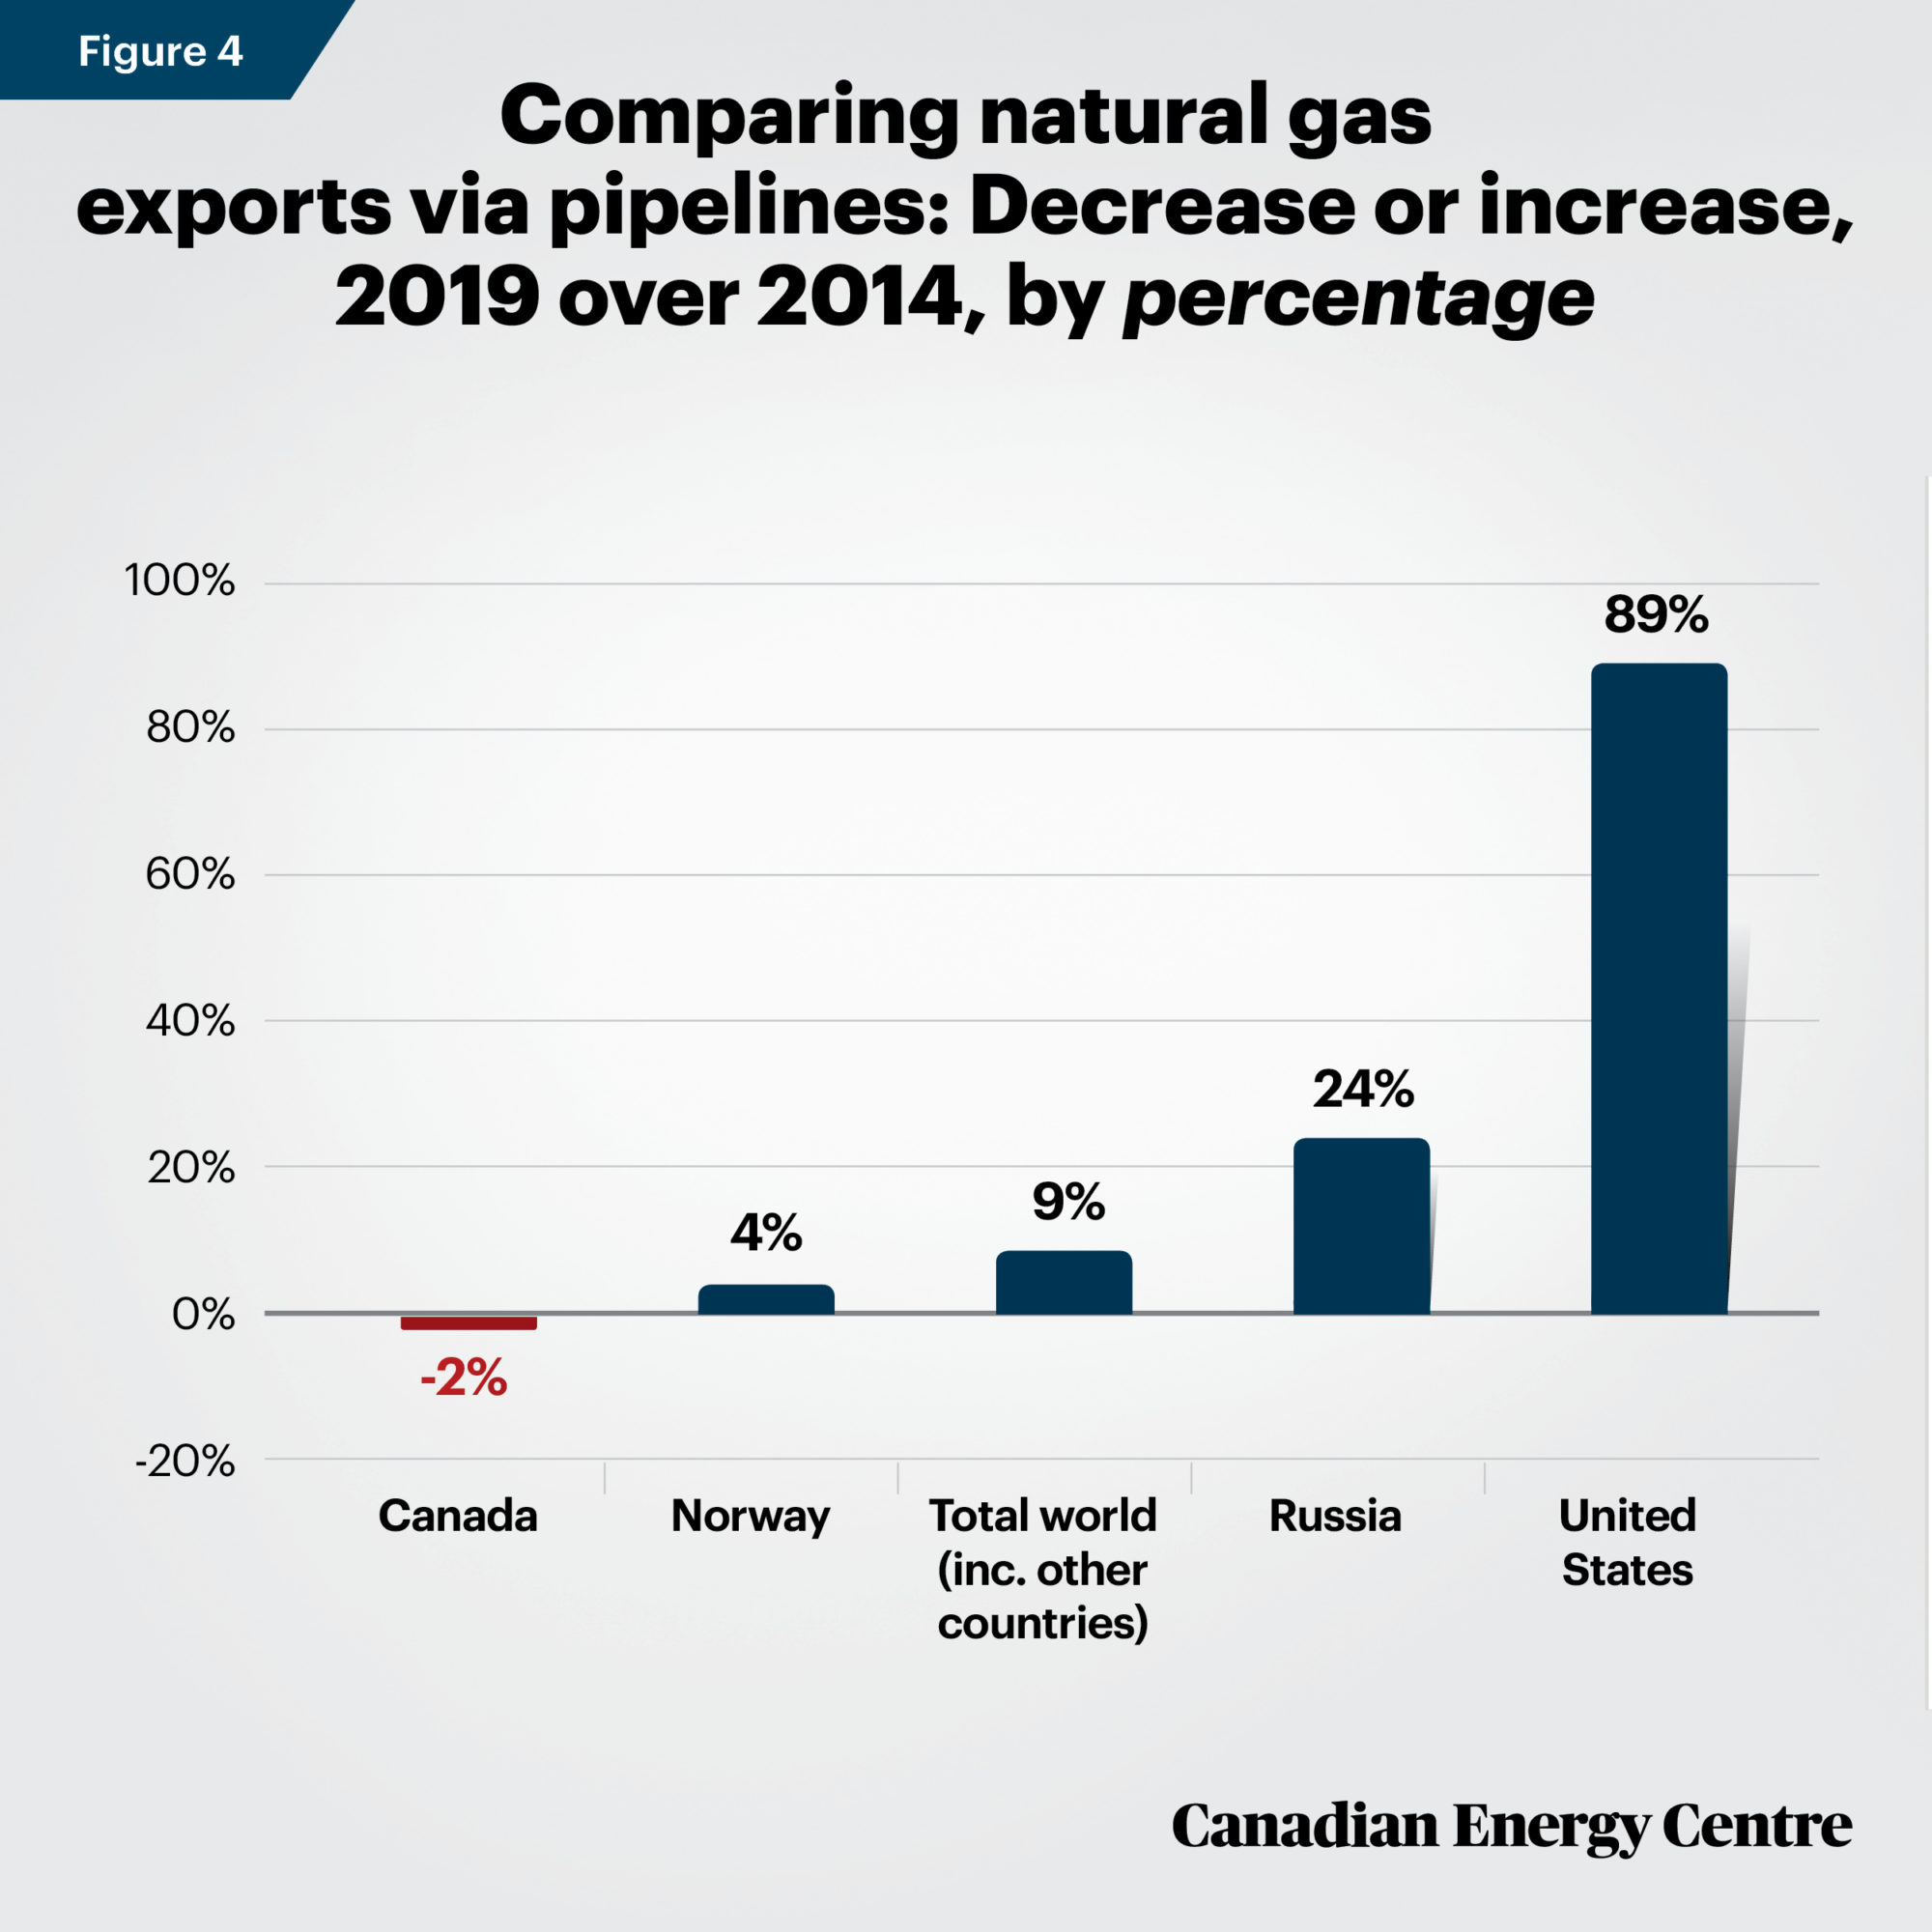
capacity to the west coast to access new markets such as the high demand-growth Asia-Pacific region would have enabled increased Canadian natural gas exports, fetching higher prices and providing greater returns. Instead, Figures 3 and 4 show the decline in natural gas exports through pipelines from Canada between 2014 and 2019. While Canada’s exports through pipelines declined, other major natural gas producing countries saw their natural gas exports through pipelines soar.
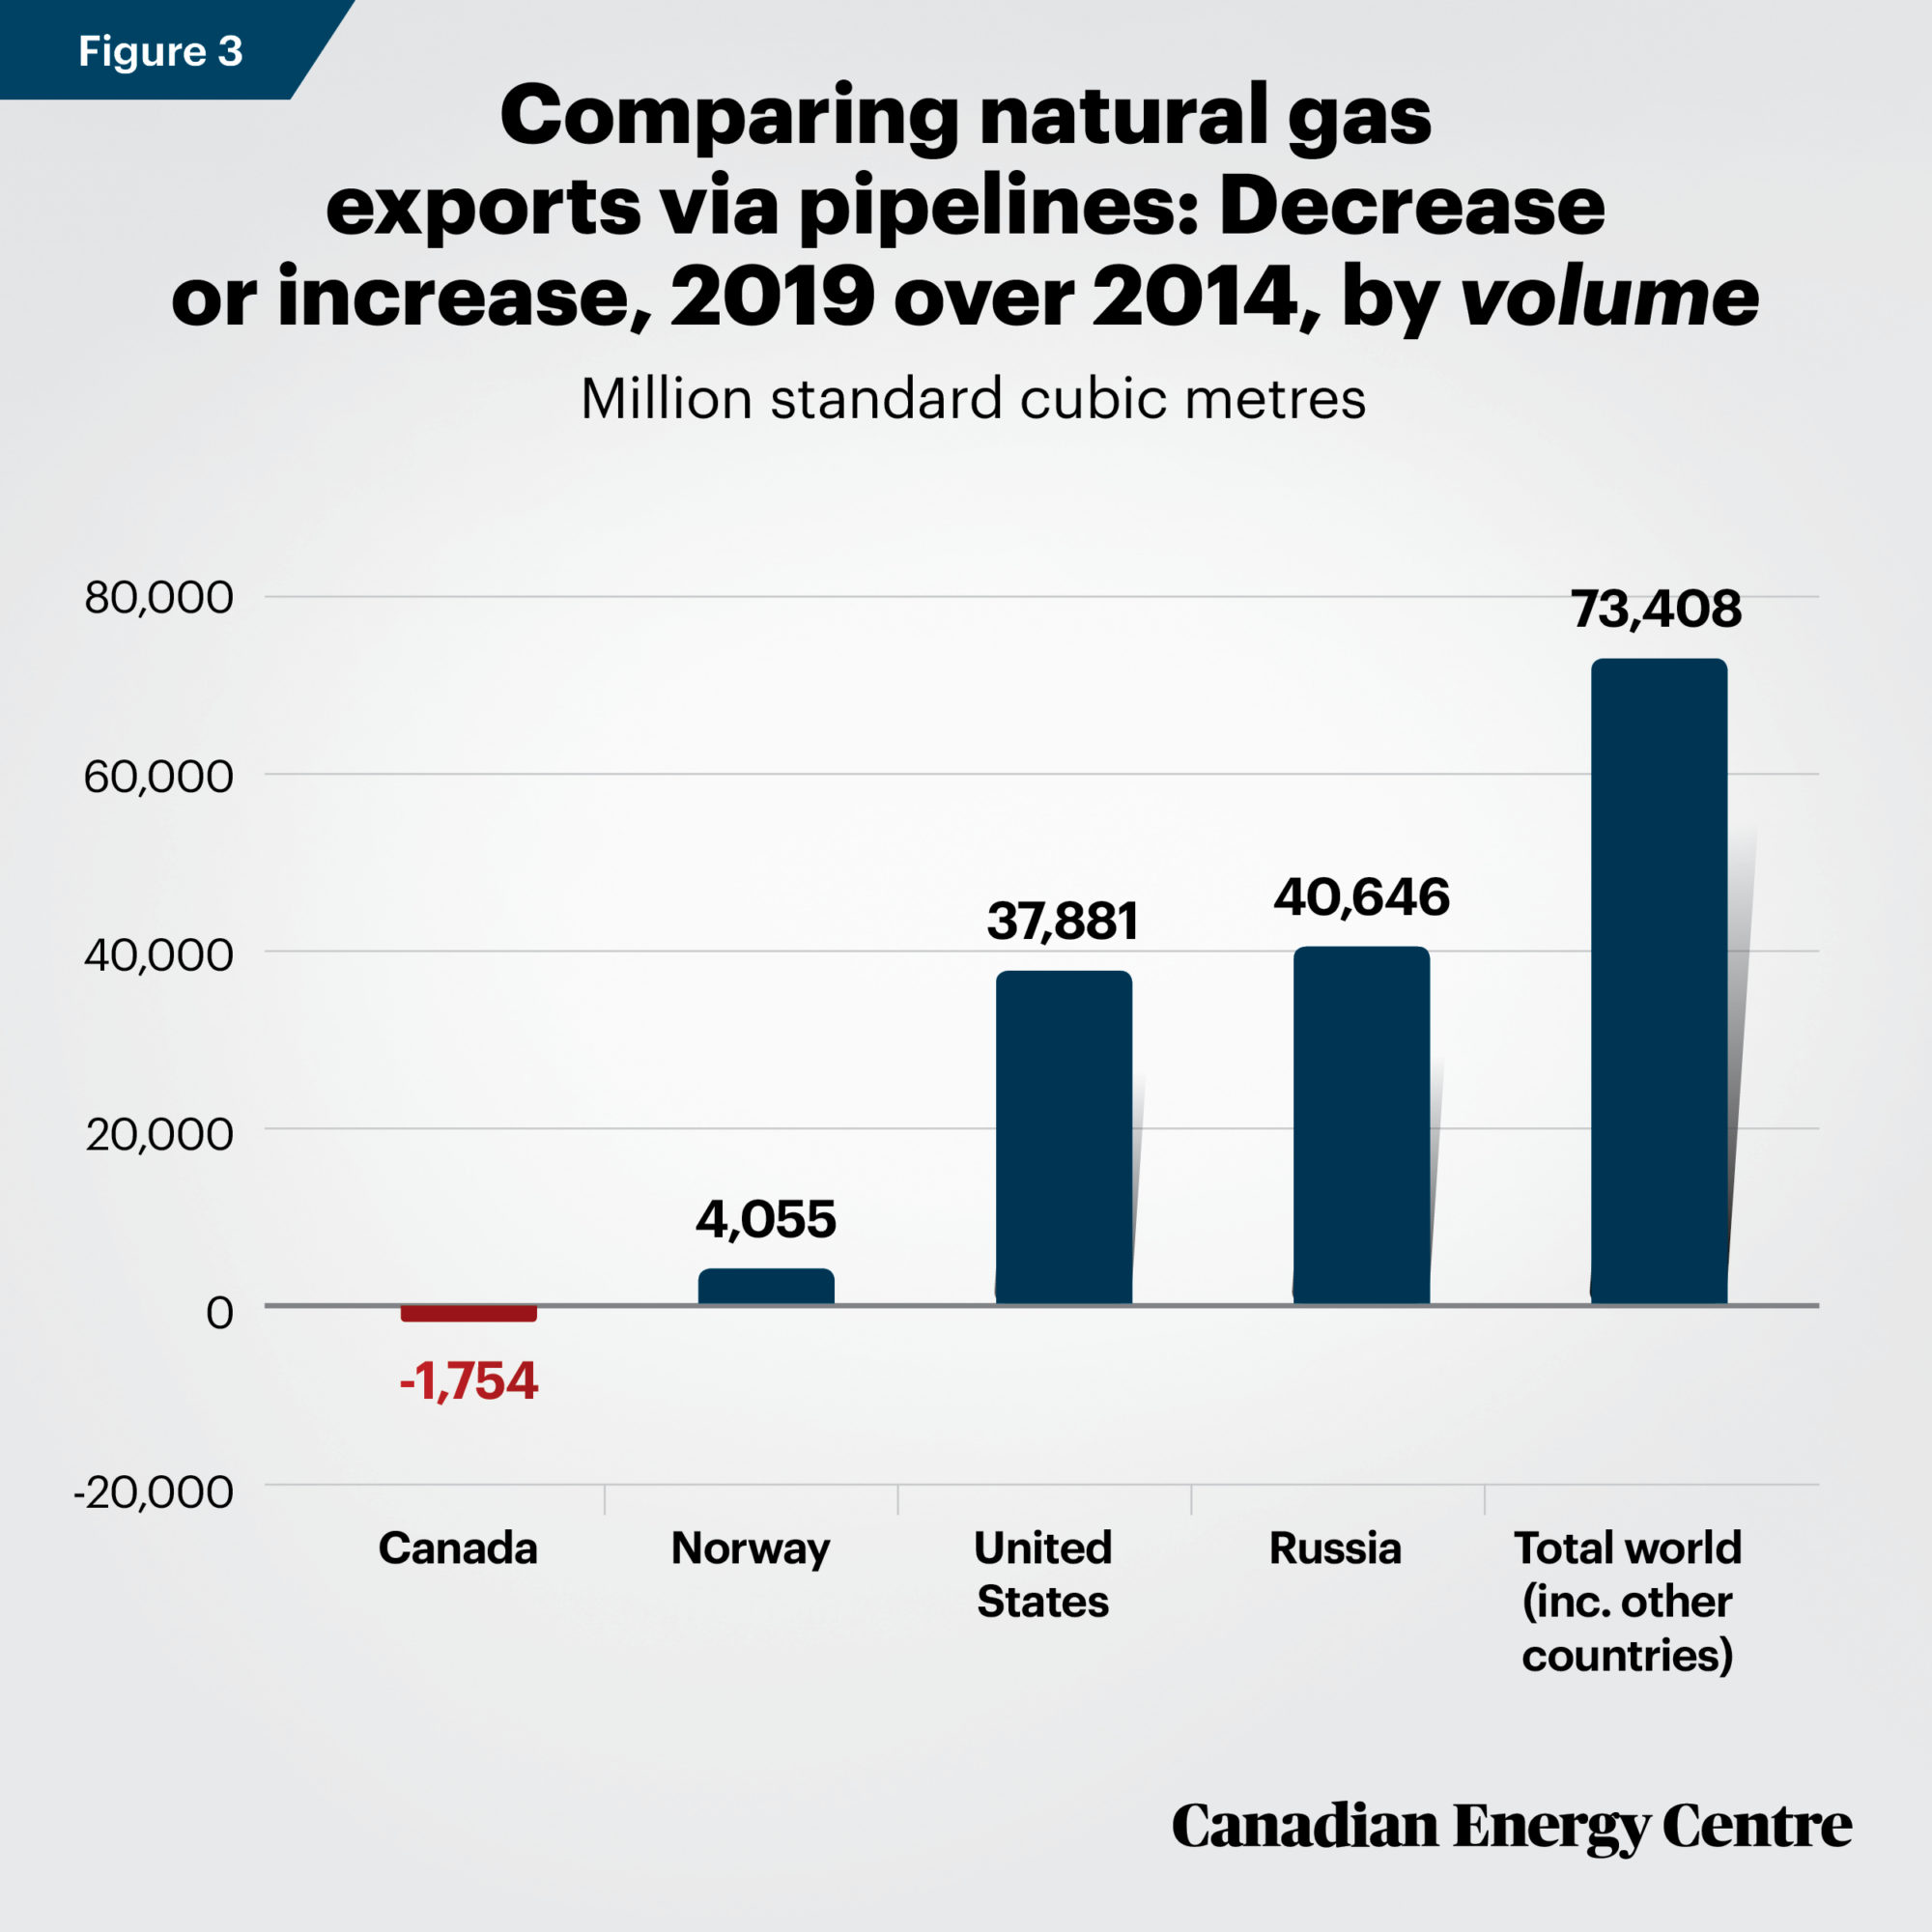
Source: Authors‘ calculations from United Nations Conference on Trade and Development (UNCTAD)
Trade Statistics.
Source: Authors‘ calculations from United Nations Conference on Trade and Development (UNCTAD)
Trade Statistics.
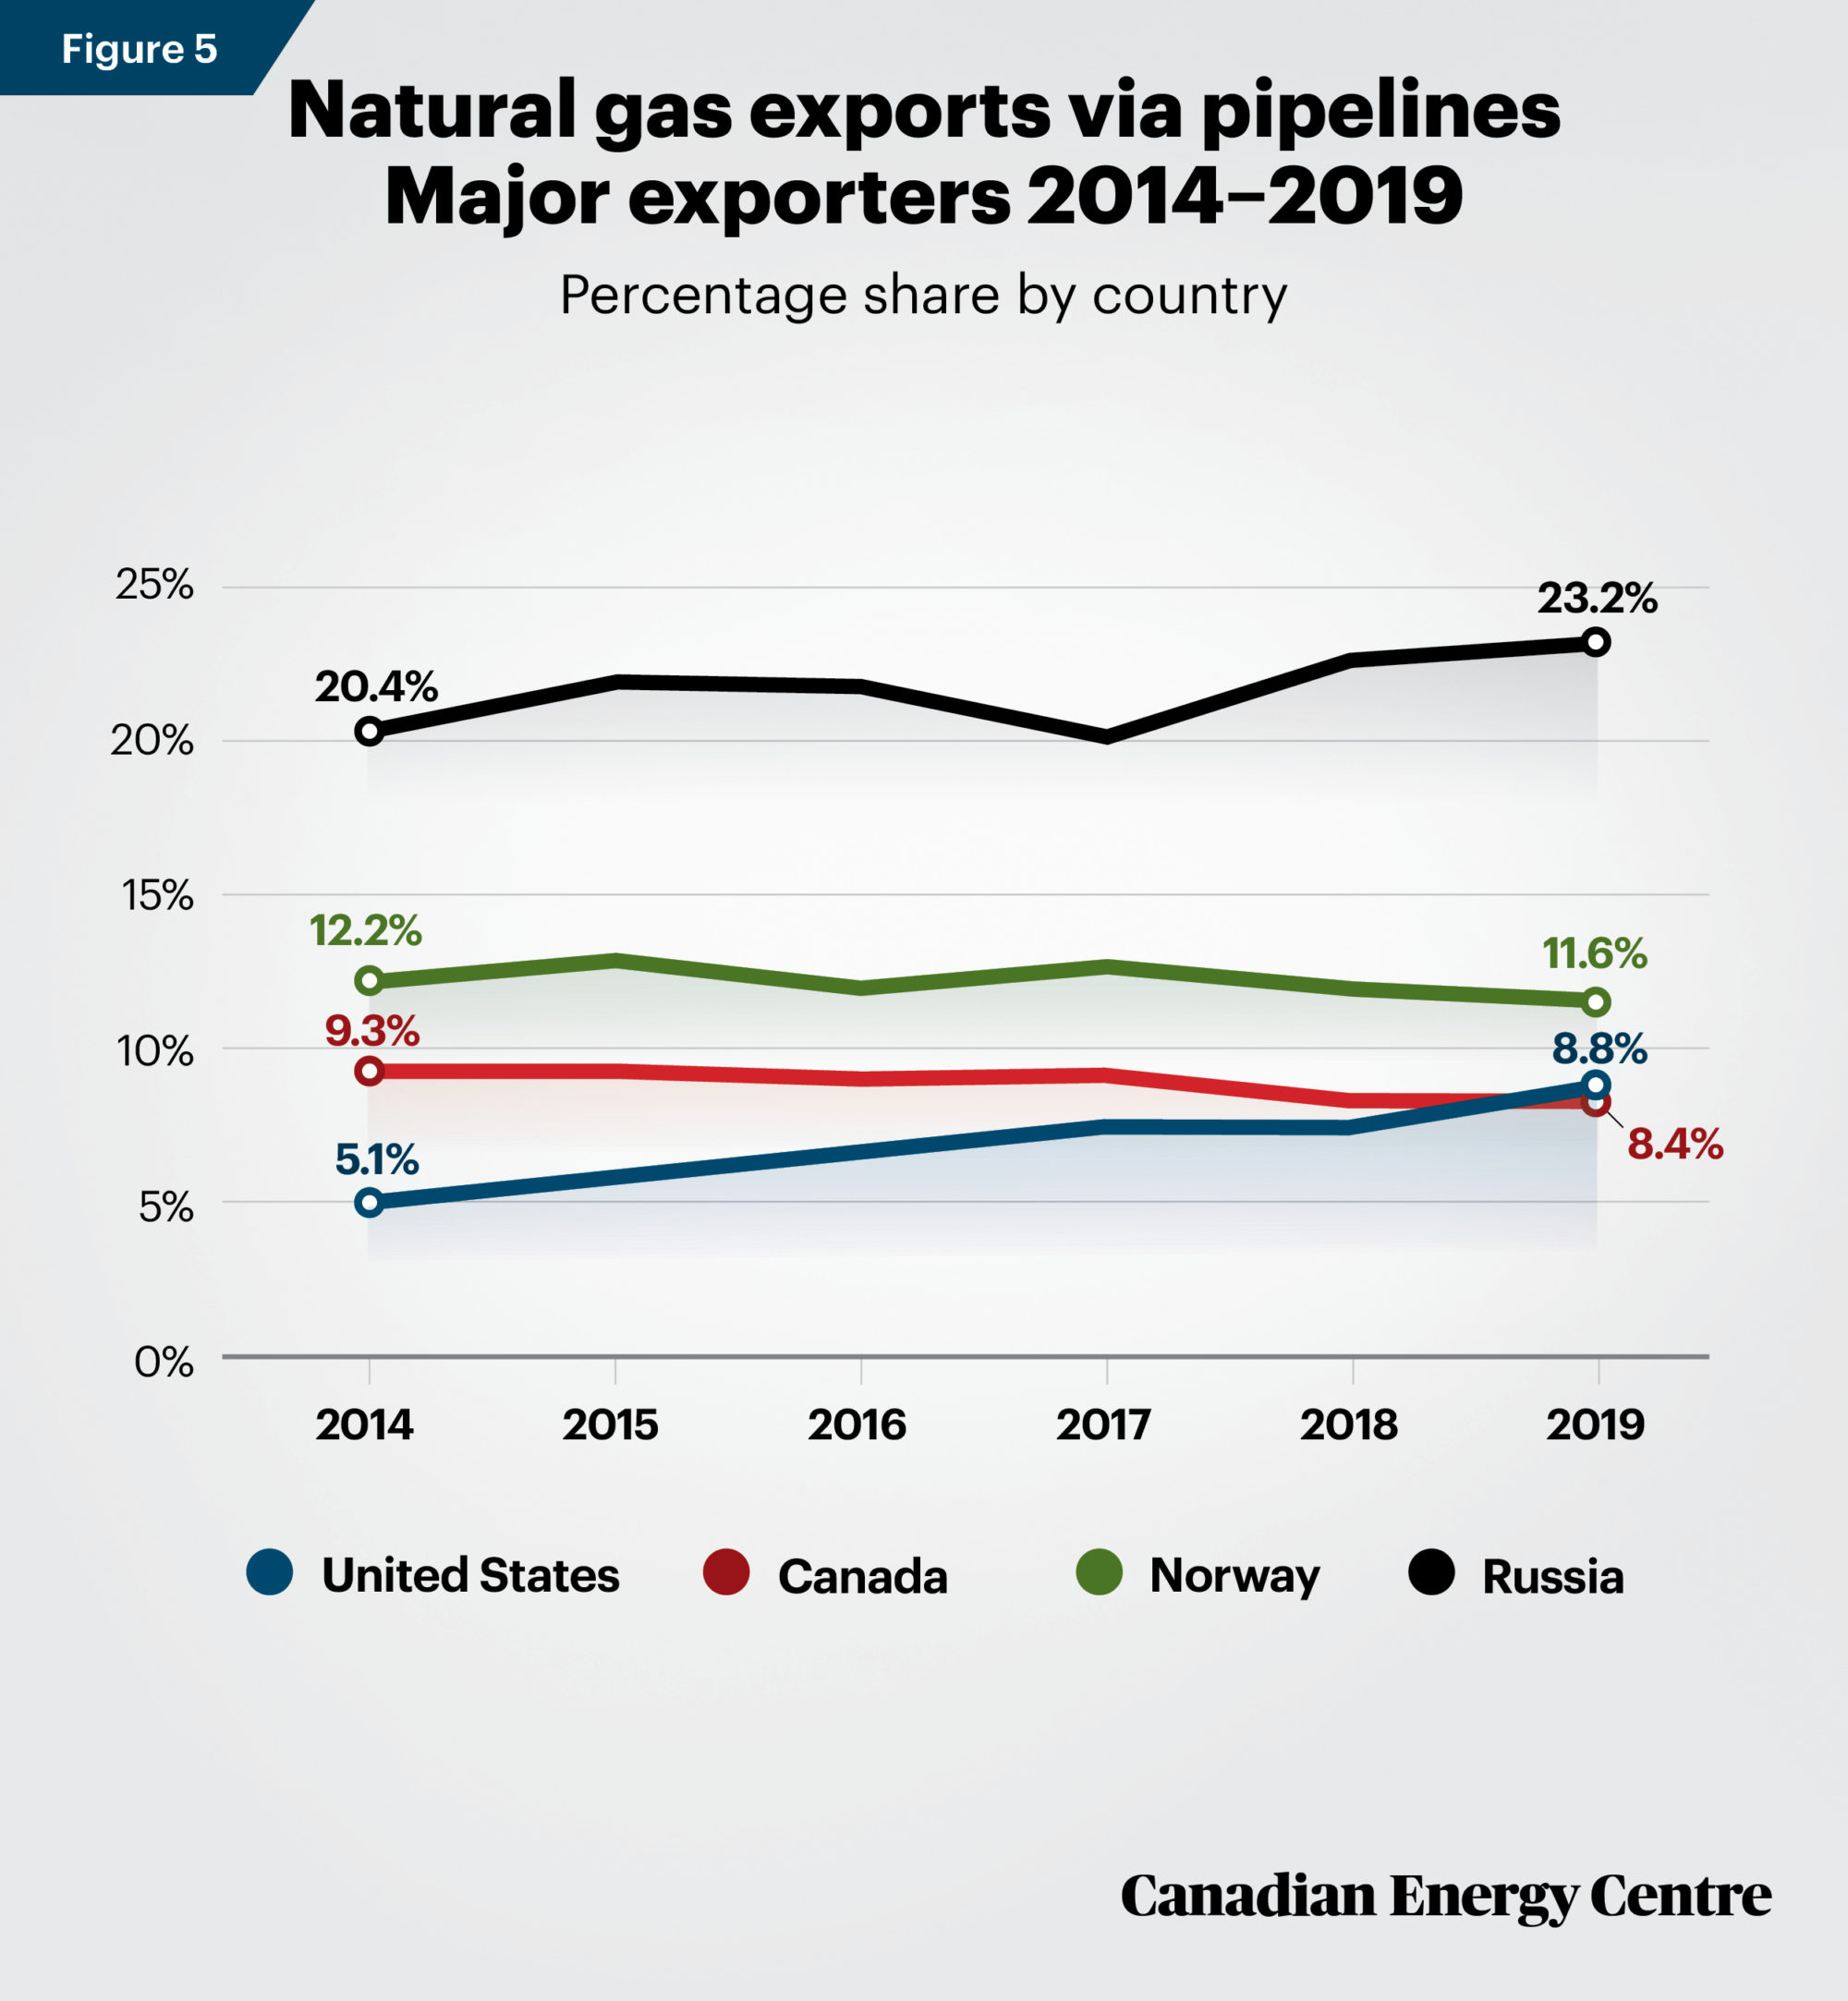
Finally, as Figure 5 shows, Canada has been losing market share in global natural gas production that is exported through pipelines, down to 8.4 per cent in 2019 from 9.3 per cent in 2014. Norway’s market share also declined slightly, to 11.6 per cent from 12.2 per cent. Russia and the United States have both seen a significant rise in their share of natural gas exports through pipelines, rising to 8.8 per cent for the United States in 2019 from 5.1 per cent in 2015, while Russia’s share increased to 23.2 per cent from 20.4 per cent.
Source: Authors‘ calculations from United Nations Conference on Trade and Development (UNCTAD)
Trade Statistics.
The takeaway: 35,000 jobs at stake
While few Canadian-origin pipelines have been built in recent years, a significant number of new oil and natural gas pipelines have continued to be built in other countries including one of Canada’s main competitors for energy investment, the United States. Alberta alone has lost an estimated $40 billion in revenue since 2013 due to a lack of new and expanded pipelines.
More positively, and “flipping” the caution against sacrificing new pipeline capacity in the future with the benefits of new pipeline export capacity, Canadian producers and governments stand to gain more than $43 billion in income by 2023, or almost $9 billion per year. The potential for job growth is about 35,000 new jobs per year across Canada.
Notes
This CEC Fact Sheet was compiled by Ven Venkatachalam and Mark Milke at the Canadian Energy Centre: www.canadianenergycentre.ca. The authors and the Canadian Energy Centre would like to thank and acknowledge the assistance of Philip Cross and an anonymous reviewer for their review of the data and research for this Fact Sheet. Image credit: “Pipeline being installed in forest” by William Taufic.
Sources (Links live as of April 30, 2020)
Alberta Treasury Board and Finance (2019). Alberta Budget 2019, <https://bit.ly/3an0lox>; CAPP (2020). Personal correspondence with authors; Victor Ferreira (2019). “While Canada hesitates, Russia builds 3,000 KM gas pipeline to China.” Financial Post, December 3, 2019. <https://bit.ly/3brRfbH>; Government of Alberta (2019). Budget 2019, https://bit.ly/2Ksosrk, 39; Tim Hearn and Robert Mansell (2019). “How is the Federation Working Today? A Scorecard.” School of Public Policy, University of Calgary; <https://bit.ly/2yzsXxA>; International Energy Agency (2019). Gas 2019, <https://bit.ly/2Vw51mT>; International Energy Agency (2020). Global Energy Review 2020. <https://bit.ly/35kyvbV>; Christopher E. Smit (2020). “Asia-Pacific leads 2020 pipeline construction growth.” Oil and Gas Journal, February 3, 2020. <https://bit.ly/3alu2GB>; U.S. Energy Information Administration (2020). Global Liquid Fuels. <https://bit.ly/2RJ5918>; U.S. Energy Information Administration (undated). International Statistics, Crude Oil Consumption, <https://bit.ly/34F3cYW>; U.S. Energy Information Administration (2019). International Energy Outlook, 2019, <https://bit.ly/2VfJWxT>; US Energy Information Administration (2020). International: Natural Gas. <https://bit.ly/2vKxGv8>; US Energy Information Administration (2020). Short-Term Energy Outlook. <https://bit.ly/3aOznGQ>; United Nations Conference on Trade and Development (undated). Trade Statistics, (calculation by authors) <https://bit.ly/2RmTYLo>.
Creative Commons Copyright
Research and data from the Canadian Energy Centre (CEC) is available for public usage under creative commons copyright terms with attribution to the CEC. Attribution and specific restrictions on usage including non-commercial use only and no changes to material should follow guidelines enunciated by Creative Commons here: Attribution-NonCommercial-NoDerivs CC BY-NC-ND.