To sign up to receive the latest Canadian Energy Centre research to your inbox email: [email protected]
Download the PDF here
Download the charts here
Overview: Canada’s advantage on LNG exports
Global production of electricity increased from 21,577 terawatt-hours (TWh) in 2010 to 26,979 TWh in 2020 and estimates are that global demand for electricity will rise to 35,000 TWh by 2040.¹
Electricity generation jumped by six per cent, or 980 TWh, in 2021 alone due to surging global demand. Coal-powered electricity generation increased by nine per cent, representing more than half of the increase in additional electricity demand in 2021.
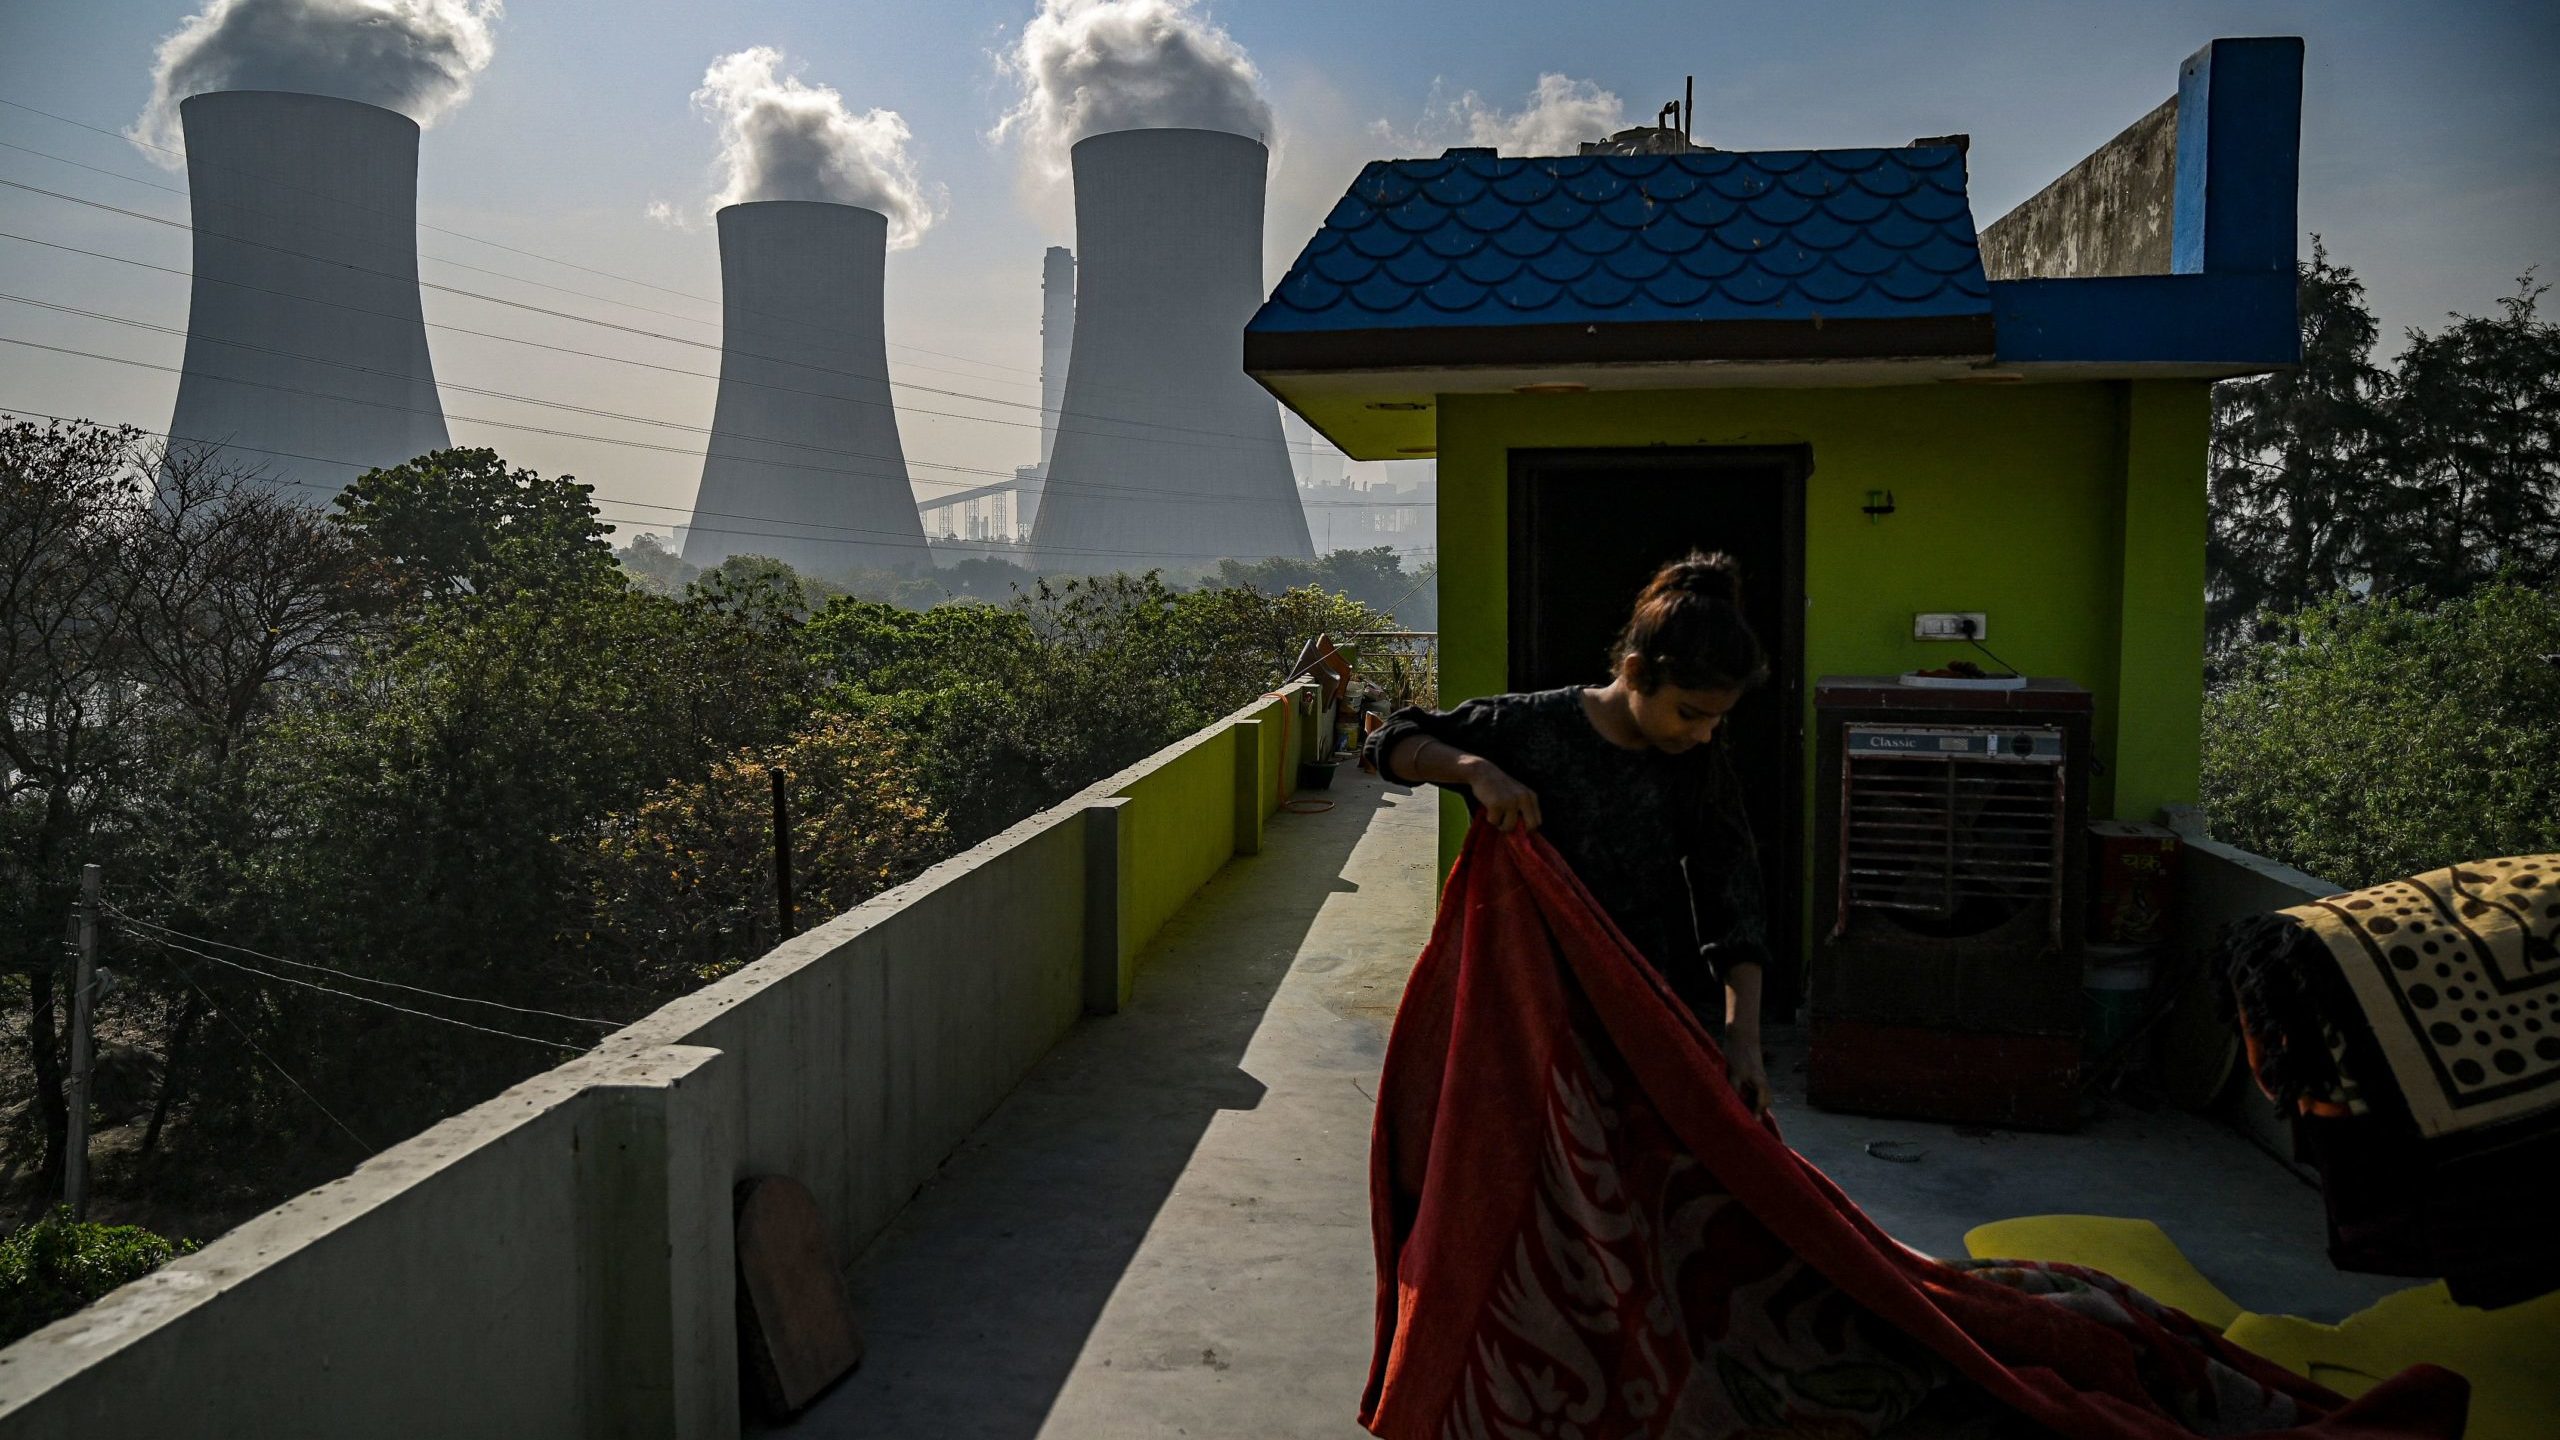
Coal continues to maintain its position as the world’s largest source of fuel for electricity generation, with approximately 9,542 terawatt-hours of electricity generated by coal-fired plants in 2020. In recent years, electricity generated from the combustion of coal declined in Canada, the United States, and Europe. However, its growth has continued in China, India, and other parts of Asia.
Currently,
- 29 per cent of Japan’s electricity comes from its 91 coal plants;
- 36 per cent of South Korea’s electricity comes from its 23 coal plants;
- 63 per cent of China’s electricity comes from its fleet of 1,110 coal-fired plants; and
- 72 per cent of India’s electricity comes from its 285 coal plants.
Natural gas exports from Canada can help facilitate the coal to natural gas conversion and thus help reduce CO2 emissions in Asia. Canada’s first export project, LNG Canada, is currently under construction and at least four additional facilities are proposed in British Columbia including Woodfibre LNG, Tilbury LNG, Cedar LNG and Ksi Lisims LNG.
Importantly, LNG exported from Canada’s west coast enjoys a competitive advantage over that shipped from American ports given the shorter shipping distance to select ports in Asia. For example, the distance from the U.S. Gulf Coast to the Japanese ports of Himeji or Sodegaura is more than 9,000 nautical miles compared to less than 4,200 nautical miles between the coast of British Columbia and those two Japanese ports.
The development of Canadian LNG projects not only creates economic opportunity in British Columbia and across the country; supplying Canadian natural gas to the Asia-Pacific region will displace coal-fired power and help reduce global carbon emissions.
1. The IEA’s Electricity Market Report 2022 states that nearly all of the increase is attributable to growing electricity consumption in developing countries across southeast Asia and Africa.
Background: Electricity generation from coal-fired plants
Electricity is currently generated using a variety of energy sources including oil, natural gas, nuclear, coal, hydropower, and renewables (wind, solar, and other). Coalpowered generation currently represents about 35 per cent of the world’s installed power generation capacity (see Table 1).

Source: BP Statistical Review of World Energy database.
A comparison of greenhouse gas emissions in Canada and select Asian countries
Total worldwide energy-related CO2 emissions were 35.1 gigatonnes (Gt) in 2020. Of that total, Canada’s total energy-related CO2 emissions were 0.57 Gt, or 1.6 per cent of the global total.
That compares to emissions of 0.64 Gt in South Korea, 1.1 Gt in Japan, 2.4 Gt in India, and 11.7 Gt in China (see Figure 1). Canada’s energy-related carbon emissions were 3.6 per cent of those four countries’ 15.8 Gt energy-related carbon emissions.

Source: IEA World Energy Statistics database and Enerdata.
Gigatonnes of CO2 emissions from coal-fired power plants
Coal-fired power plants accounted for 11.9 Gt, or 34 per cent of global energy-related CO2 emissions in 2020. Most of that generation occurred in Asia, with China, India, Japan, and South Korea accounting for 6.17 Gt, or half of all coalfired CO2 emissions worldwide (see Figure 2).

Source: IEA World Energy Statistics database and Enerdata.
Carbon emissions from coal-fired power by country as a percentage of total coal-fired CO2 worldwide
As a percentage of total global emissions from coal-fired power, the level of carbon emissions that each country produces from that method of power production varies. In 2020, South Korea was responsible for 2 per cent and China 54.1 per cent. Canada, by contrast, accounted for 0.3 per cent of global emissions from coal-fired electricity generation (see Figure 3).
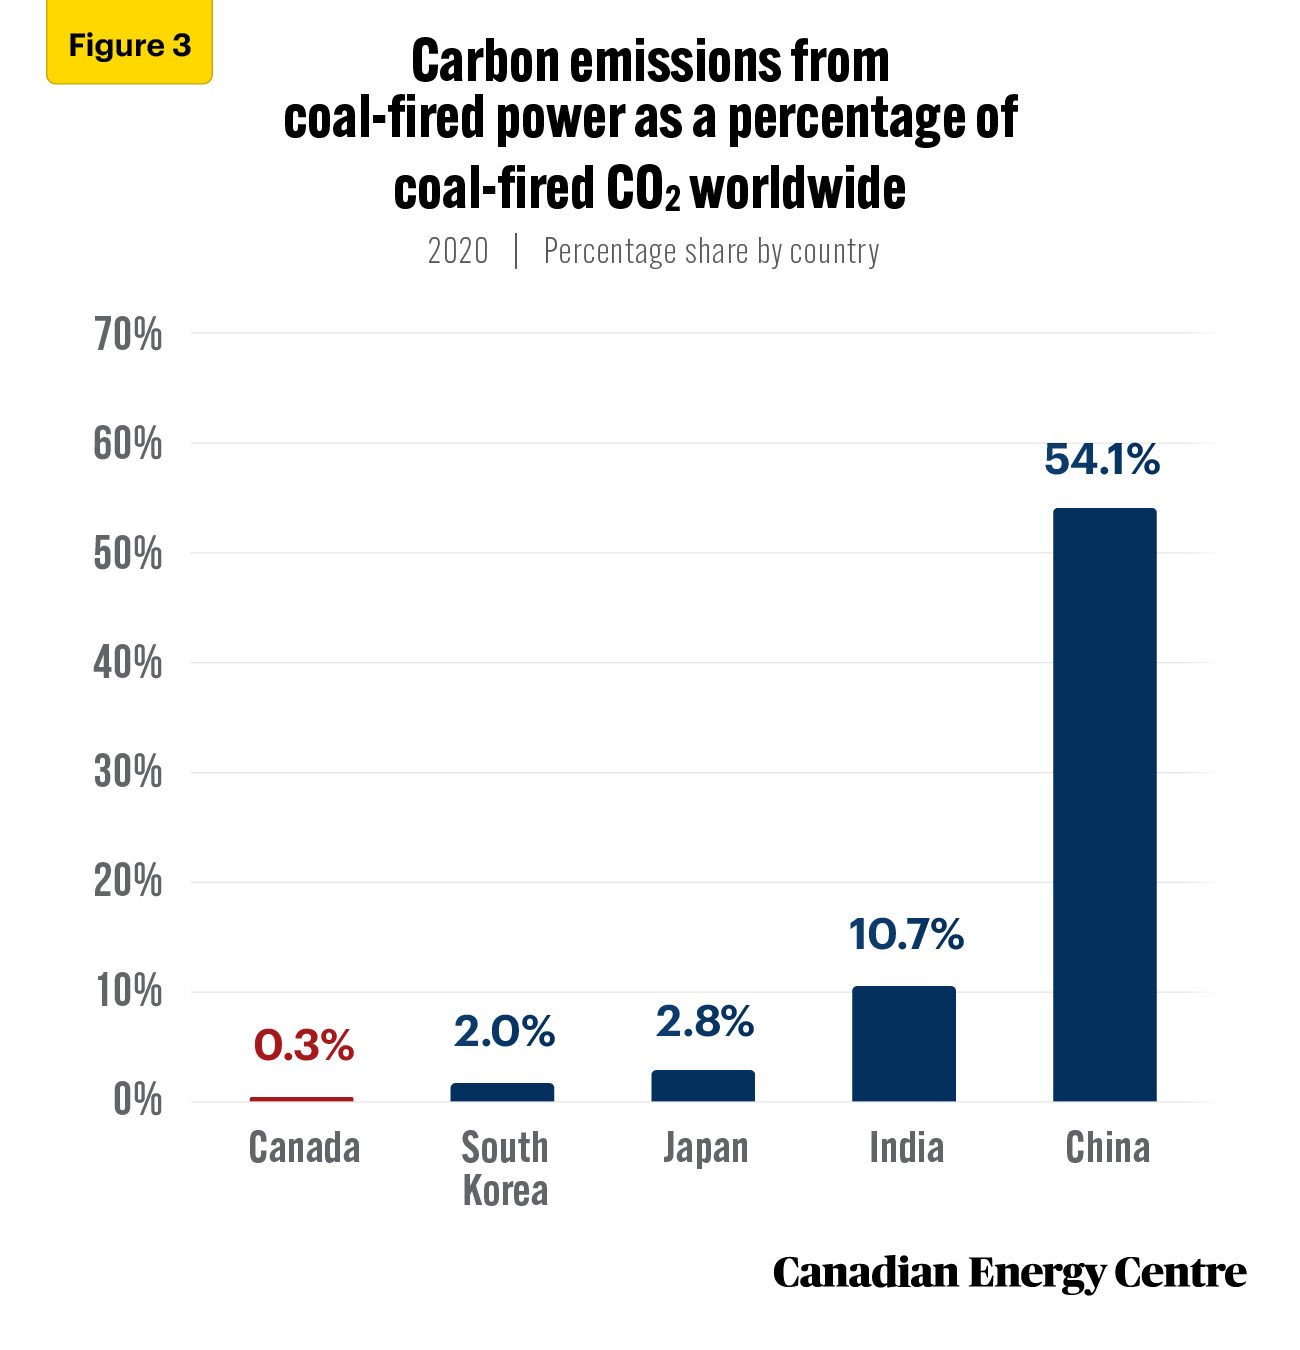
Source: Authors’ calculations from the IEA World Energy Statistics (database) and Enerdata.
Energy-related carbon emissions from Canada compared to that from other countries
To consider Canada’s carbon emissions in context, this country’s total energy-related emissions (0.57 Gt in 2020) were about one-half of India’s coal-fired emissions alone, and about one-tenth of China’s coal-fired emissions (see Figure 4).

Source: Authors’ calculations from the IEA World Energy Statistics database and Enerdata.
The future of coal-fired carbon emissions: More than 50% of new electricity capacity under construction in China and India is from coal plants
The ongoing economic recovery from the COVID-19 pandemic has highlighted the general worldwide demand for electricity and has put the spotlight on Asia’s demand in particular. The increased demand for electricity in China, India, and other countries has led to a greater reliance on coal as a power source for some electricity producing plants.
According to IEA data (2022a), China’s electricity demand grew by 10 per cent in 2021, faster than its economic growth of 8.1 per cent that year. Coal plants provided more than half of the 700 TWh of increased electricity demand in China in 2021. In India, electricity generation from coal-fired plants increased by 13 per cent in 2021 from the 2020 level.
At present, more than 199 gigawatts (GW) of electricity will be added to the power grid each year from various coal-fired power plants under construction worldwide.² Predominantly, this includes 51 GW in India and 91 GW in China (see Figure 5a).
2. Each electricity plant uses different technology, so converting electricity produced (in gigawatts) to CO2 emissions (in Gt) is not a measurement that is currently available.

Source: Enerdata (2022)
Fifty-four per cent of new electricity generation in China will come from coal-powered plants, as will 69 per cent of India’s new electricity generation, and 33 per cent of South Korea’s. Across the world, 28 per cent of new electricity generation capacity added will be from coal-fired power plants (see Figure 5b).
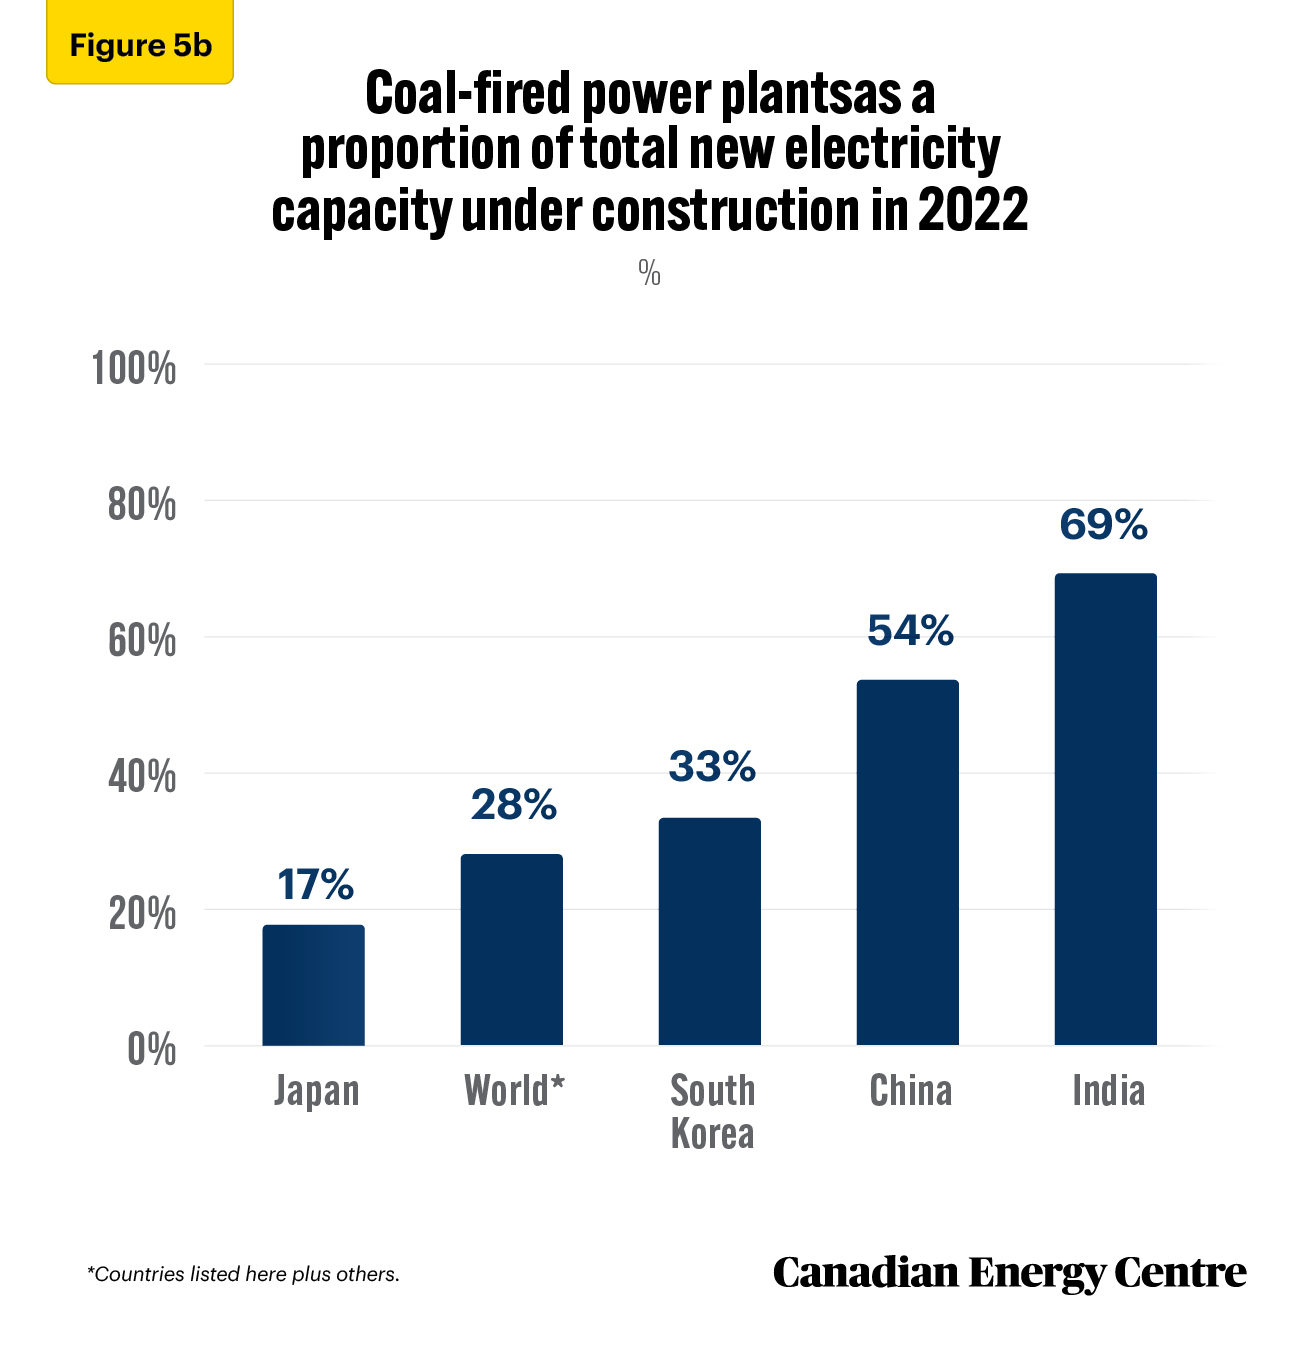
Source: Enerdata (2022)
Point One: Canada’s total energy-related carbon emissions are minimal relative to those from Asia’s coal-fired power plants
As the IEA notes,
[The]power grid in Asia Pacific is very carbon intensive due to reliance on coal for electricity generation. With an estimated CO2 intensity of over 580 g CO2 /kWh in 2021, the region is 28% above the world average of about 460 g CO2 /kWh. (2022b)
The increased emissions from new coal-fired power plants worldwide will negate any reductions in Canada’s energy-related carbon emissions as to make them practically meaningless.
The coal-fired power plants currently being constructed in Asia will produce close to Canada’s entire current energy-related carbon emissions. Those emissions don’t include the planned, future power plants in the region that are not yet under construction.
Point Two: Opportunities exist for Canadian natural gas exports
China and India are ranked as the first and the second largest coal producers in the world. The increase in new coal-fired electricity generation in China and India is occurring in part because of the abundance of inexpensive coal reserves in both countries.
However, coal-fired power plants are significantly more carbon intensive than those that use natural gas. One way to help reduce emissions worldwide while benefitting the Canadian economy is to export liquefied natural gas (LNG) to countries now dependent on coal for power generation.
Natural gas is considered a relatively clean-burning fossil fuel as it produces fewer GHG emissions per unit of energy compared to coal. Carbon emissions from natural gas-fired power are about half the rate of coal-fired power per kilowatt-hour (KWh) of electricity generated. Natural gas is also more energy efficient as a fuel for power plants.
- On average, a typical coal-fired power plant is about 33 per cent efficient in converting heat energy into electric power;
- Most coal-powered plants can be converted to natural gas. A gas-fired plant is about 42 per cent efficient; and
- Natural gas combined cycle power plants—in which waste from natural gas turbines is used to generate steam—can be designed with an efficiency as high as 60 per cent.
Switching from coal to natural gas provides power plants with the opportunity to use existing infrastructure to deliver the same energy services with lower emissions. According to the IEA (2019), since 2010 switching from coal to natural gas has reduced global emissions by approximately 0.5 Gt. Also, in many Asian countries, demand for natural gas has risen in recent years as a result of a major policy push to improve air quality by reducing particulate matter.³
As the IEA noted in 2019,
Given the time it takes to build new renewable generation capacity and to implement energy efficiency improvements, coal-to-gas switching also represents a potential quick win for emissions reductions. There is potential in today’s power sector to reduce up to 1.2 Gt of CO2 emissions by switching existing coal-fired plants to natural gas, with the support of relative prices and regulation.
3. In countries such as India, the wholesale switch from coal to natural gas has been held back by supply constraints and affordability issues, and by a lack of infrastructure.
Conclusion
Despite the various pledges in Glasgow (COP26) by countries for the phase-out of coal plants and a zero-emission target by 2050, the use of coal in electricity generation increased by nine per cent in 2021. With 48 per cent of the electricity in Asia generated by coal-fired plants, the possibility exists for a transition from coal- to gas-fired electricity generation in the region. The corollary is that a potential market in Asia for natural gas extracted in and exported from Canada also exists. Canada has an opportunity to play a useful role in the global natural gas market.
Notes
This CEC Fact Sheet was compiled by Ven Venkatachalam and Lennie Kaplan at the Canadian Energy Centre (www.canadianenergycentre.ca). The authors and the Canadian Energy Centre would like to thank and acknowledge the assistance of an anonymous reviewer in reviewing the data and research for this Fact Sheet. Image credits: Getty Images (Coal-fired power station in Shanghai, China).
References (All links live as of April 8, 2022)
British Petroleum Company (2021), BP Statistical Review of World Energy in 2021 <https://on.bp.com/3NX4ZPa>; Enerdata (2022), Power Plant Tracker Database <https://bit.ly/3xfgOdF>; IEA (2022a), Electricity Market Report – January 2022 <https://bit.ly/3M0723j>; IEA (2022b), IEA World Energy Statistics Database <https://bit.ly/31ca8fp>; IEA (2021) World Energy Outlook 2021 <https://bit.ly/3voERo7>; IEA (2020), Coal-Fired Power <https://bit.ly/34kRGTM>; IEA (2019), The Role of Gas in Today’s Energy Transitions <https://bit.ly/3ulJUpV>; National Academy of Sciences (undated), “Natural Gas,” What You Need to Know about Energy <https://bit.ly/355Z1FY>; Steve Inskeep and Ashley Westerman (2019, April 29), “Why Is China Placing A Global Bet on Coal?” NPR <https://n.pr/3dukpsp>; U.S. Department of Energy, Energy Information Administration (2020, June 15), “Global Electricity Consumption Continues to Rise Faster than Population,” Today in Energy <https://bit.ly/2IzIK4L>.
Creative Commons Copyright
Research and data from the Canadian Energy Centre (CEC) is available for public usage under creative commons copyright terms with attribution to the CEC. Attribution and specific restrictions on usage including non-commercial use only and no changes to material should follow guidelines enunciated by Creative Commons here: Attribution-NonCommercial-NoDerivs CC BY-NC-ND.