To sign up to receive the latest Canadian Energy Centre research to your inbox email: [email protected]
Download the PDF here
Download the charts here
Environmental spending in Canada
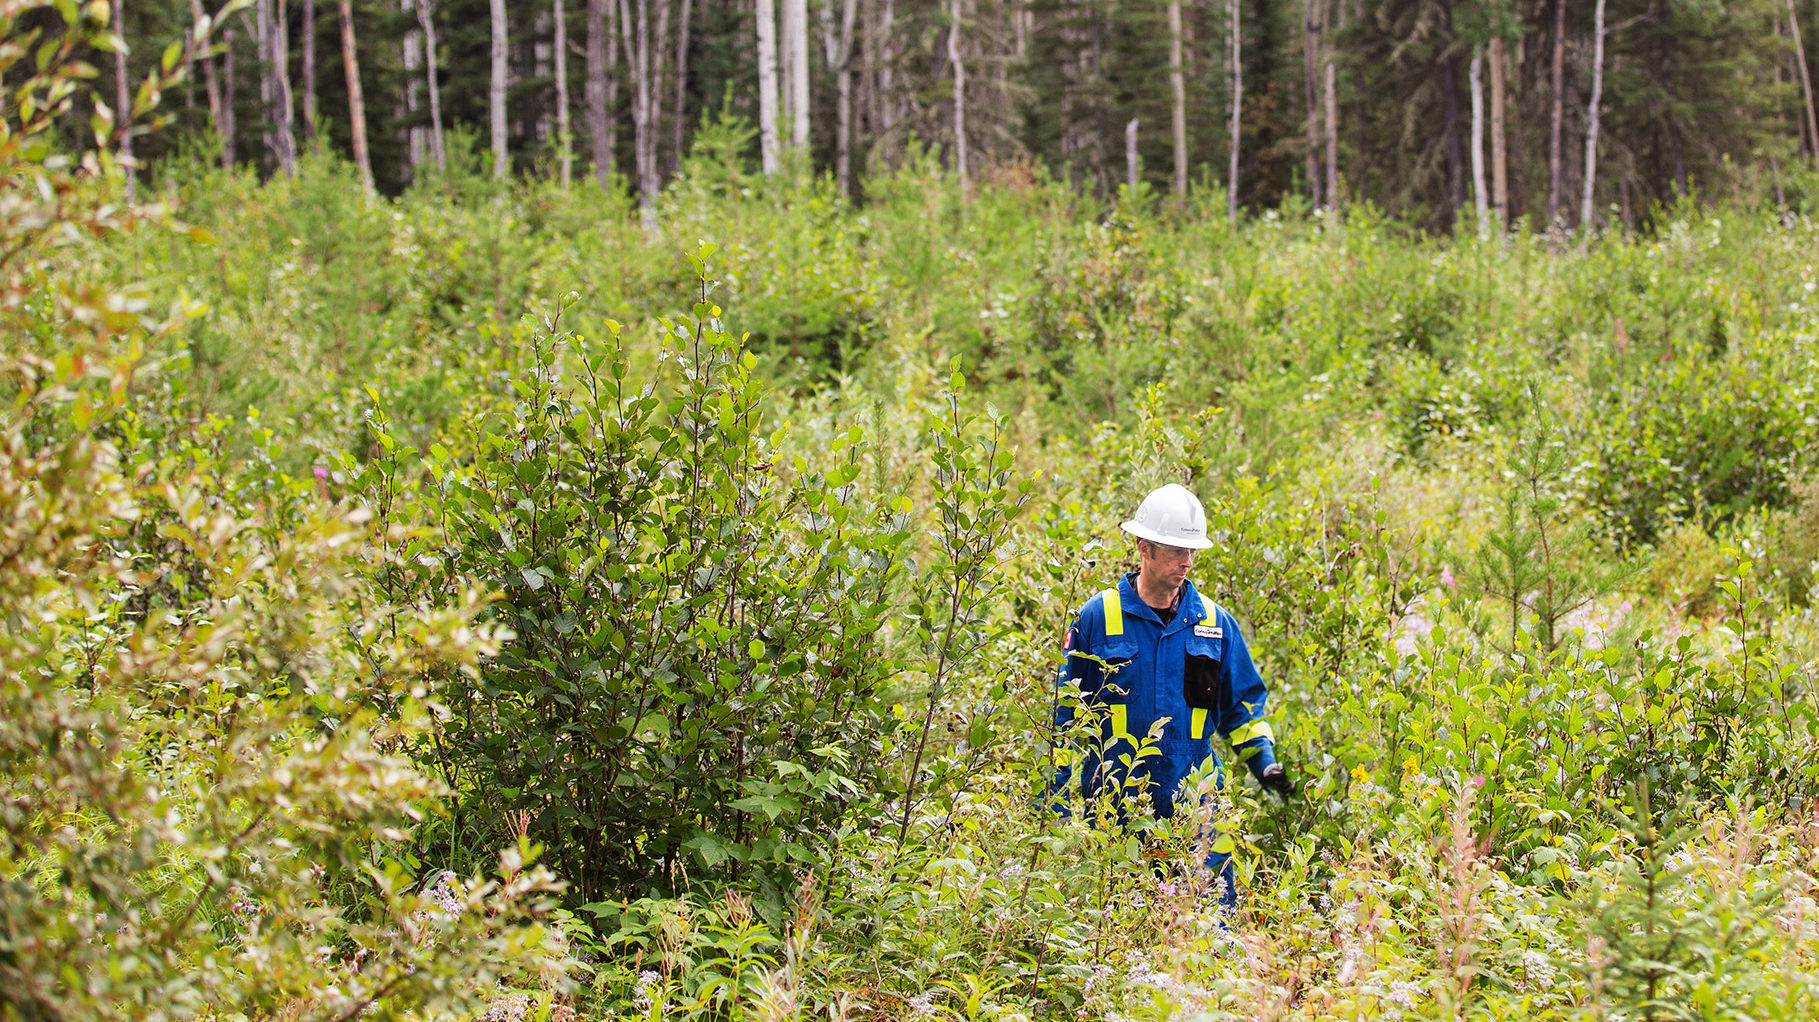
This Fact Sheet details spending on environmental protection by the oil and gas sector, other industries, and provincial governments. The comparisons are made using the most recent data from Statistics Canada. For industry expenditures, data from 2006 to 2018 are available but only on a bi-annual basis. For provincial government spending, data are available from 2008 to 2019 on an annual basis.
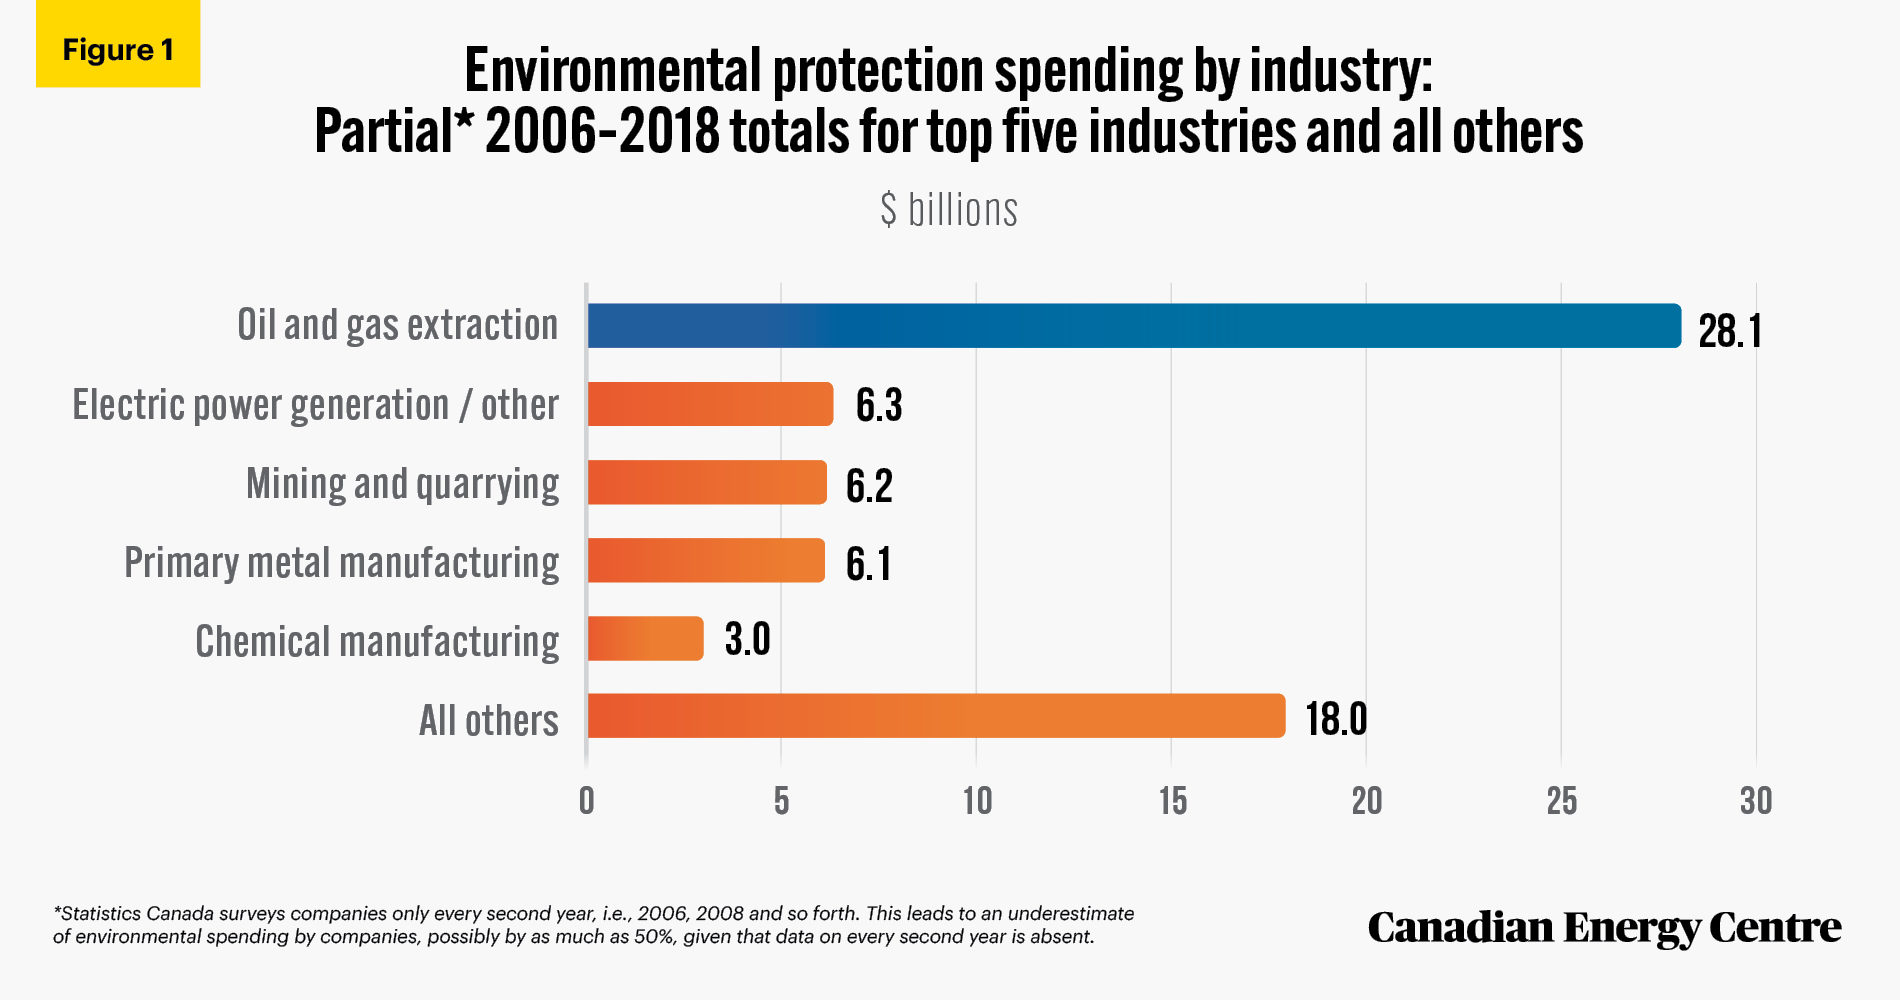
As the data makes clear, Canada’s oil and gas sector spent the most of any industry — $28.1 billion or more than four times the next highest industry, electric power generation at $6.3 billion.
As for governments, Alberta spent $20.1 billion on environmental protection between 2008 and 2019. Measured per capita, Alberta’s spending on environmental protection regardless of the party in power was higher than the average of the other nine provinces every year. For example, in the most recent year for which data is available, Alberta spent $434 per capita in 2019 on environmental protection; that was 171 per cent of the nine-province average of $253 per capita.
Comparison One: Environmental protection spending by industry
Figures 1 and 2 show a partial estimate of industry spending based on Statistics Canada data, which is only reported every second year.
- For total spending, i.e., when capital and operating expenses on environmental protection in Canada are combined, out of $67.7 billion spent in total between 2006 and 2018The oil and gas sector spent $28.1 billion or 41.5 per cent, while all other industries combined spent $39.6 billion or 58.5 per cent.
° Those other major industries include electric power generation ($6.3 billion or 9.3 per cent), mining and quarrying (nearly $6.2 billion or 9.1 per cent), primary metal manufacturing ($6.1 billion or 9.1 per cent) and chemical manufacturing ($3 billion or 4.5 per cent).
° In 2018, the oil and gas sector spent $3.6 billion on environmental protection, which constituted 37 per cent of all Canadian business environmental spending that year
Source: Statistics Canada Table 38-10-0042-01 and Table: 38-10-0130-01
Breakdowns by capital and operating
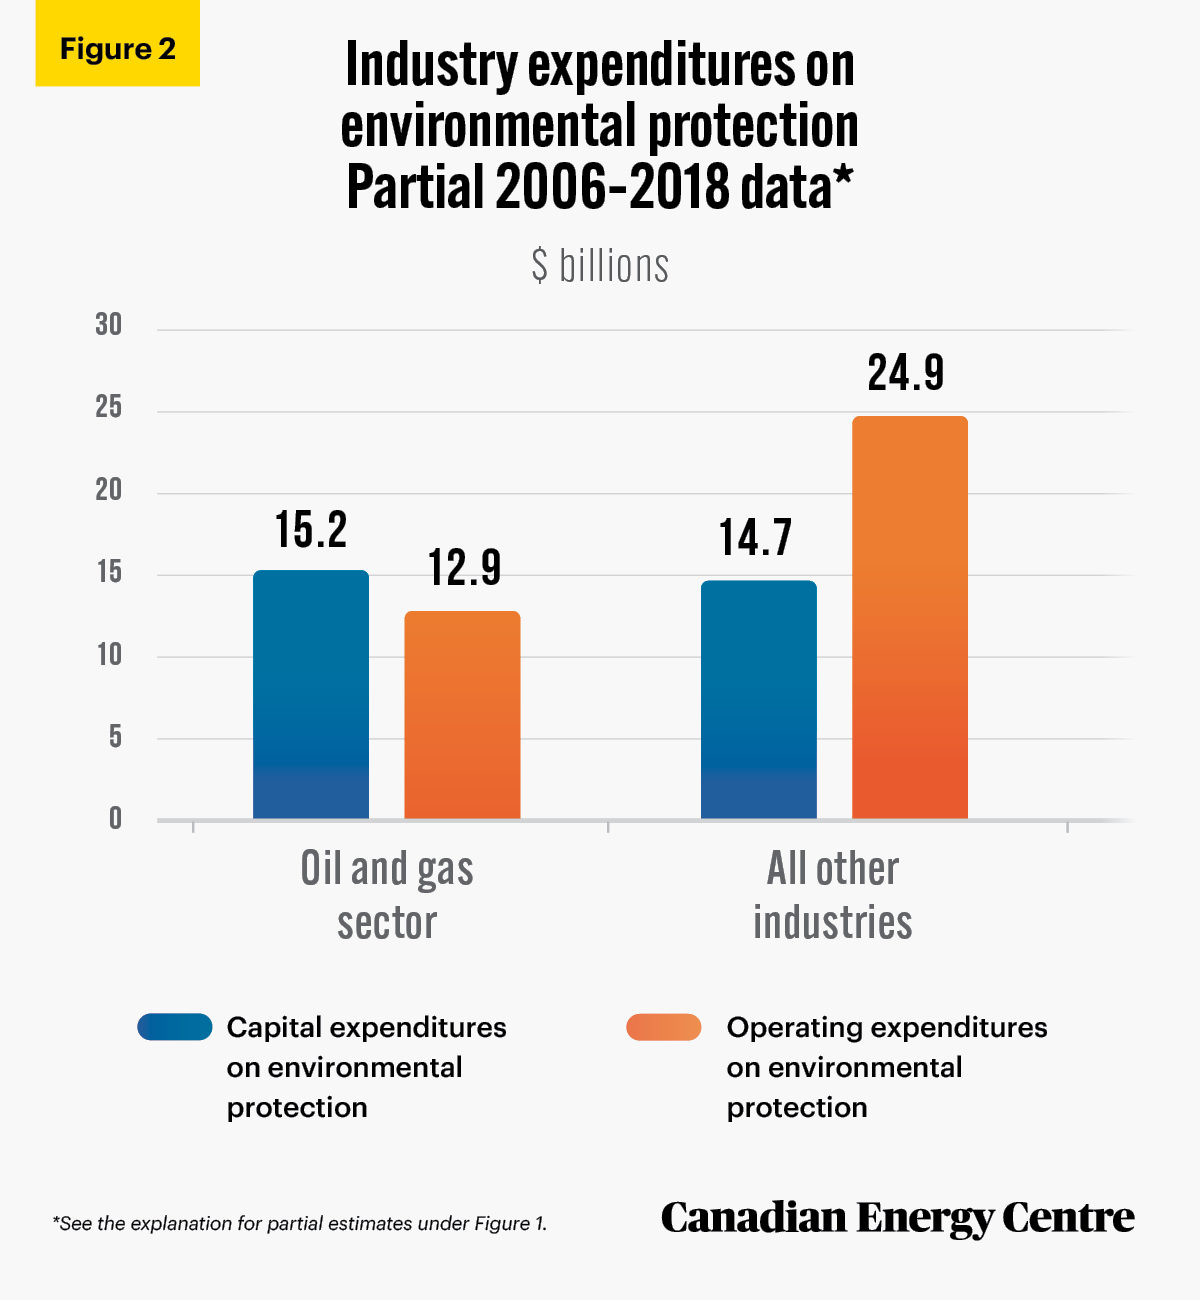
- Capital spending:¹ The oil and gas sector was responsible for 51 per cent ($15.2 billion) of all capital spending for environmental protection compared with 49 per cent for all other industries together ($14.7 billion);
- Operating spending:² The oil and gas sector was responsible for 34 per cent ($12.9 billion) of all operating expenditures for environmental protection compared with 66 per cent for all other industries together ($24.9 billion).
1. Capital spending includes outlays on machinery and equipment and for the construction of non-residential facilities, among other expenditures.
2. Operating spending includes expenses incurred for labor, materials and supplies, maintenance and repair, among other expenditures.
Source: Statistics Canada Table 38-10-0042-01 and Table: 38-10-0130-01
Comparison Two: Environment spending by the provinces, 2008-2019
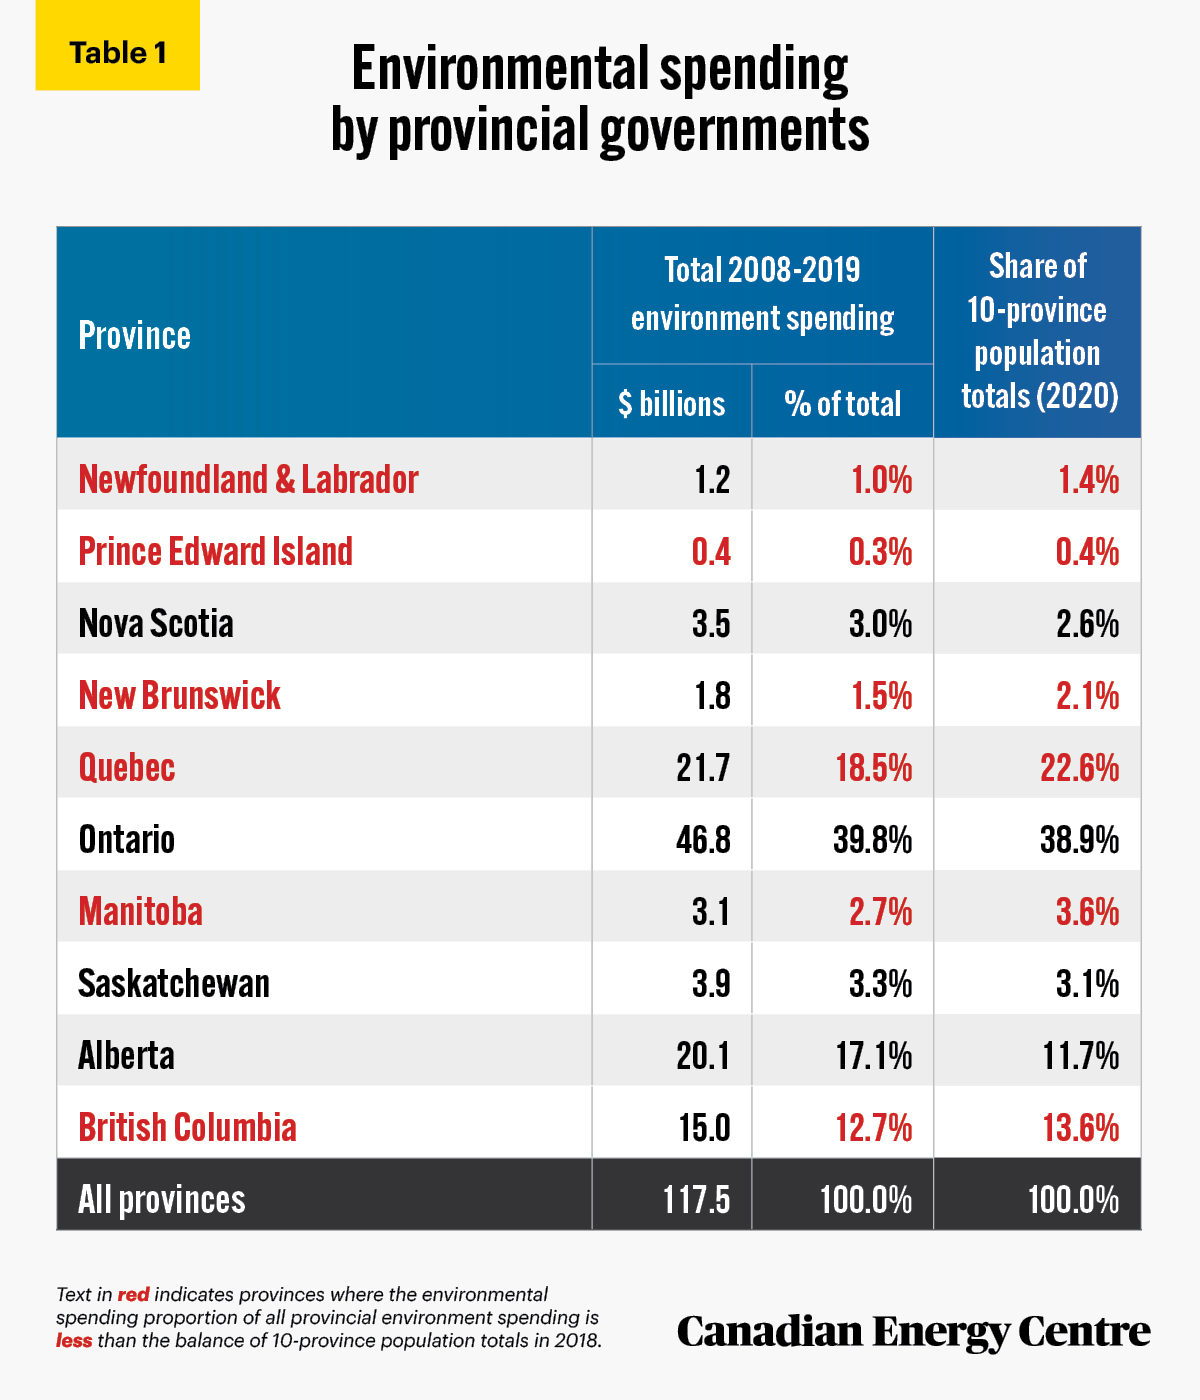
Governments, as well as industries, incur environmental protection spending. Table 1 shows total provincial government environment spending between 2008 and 2019 to be nearly $117.5 billion. (The federal government and the territories are excluded in this comparison.) As a proportion of all environmental spending, four provinces spent more relative to their share of population totals:
- Alberta spent $20.1 billion or 17.1 per cent of all provincial expenditures on the environment, while its proportion of the (10-province) population was 11.7 per cent as of 2020.
- Ontario spent $46.8 billion or 39.8 per cent of all provincial expenditures, while its proportion of the population was 38.9 per cent as of 2020.
- The other two provinces that spent a higher proportionon the environment relative to population were Nova Scotia and Saskatchewan.
- Six provinces spent less on the environment than their share of the population: Quebec, British Columbia, Manitoba, New Brunswick, Prince Edward Island, and Newfoundland & Labrador. In particular, the Quebec government spent just 18.3 per cent of all provincial environment expenditures between 2008 and 2019, significantly below its 22.6 per cent share of the (provinces’) population in 2020.
Sources: Statistics Canada Table 10-10-0005-01 and Table 17-10-0005-01.
A per capita look at provincial spending on the environment
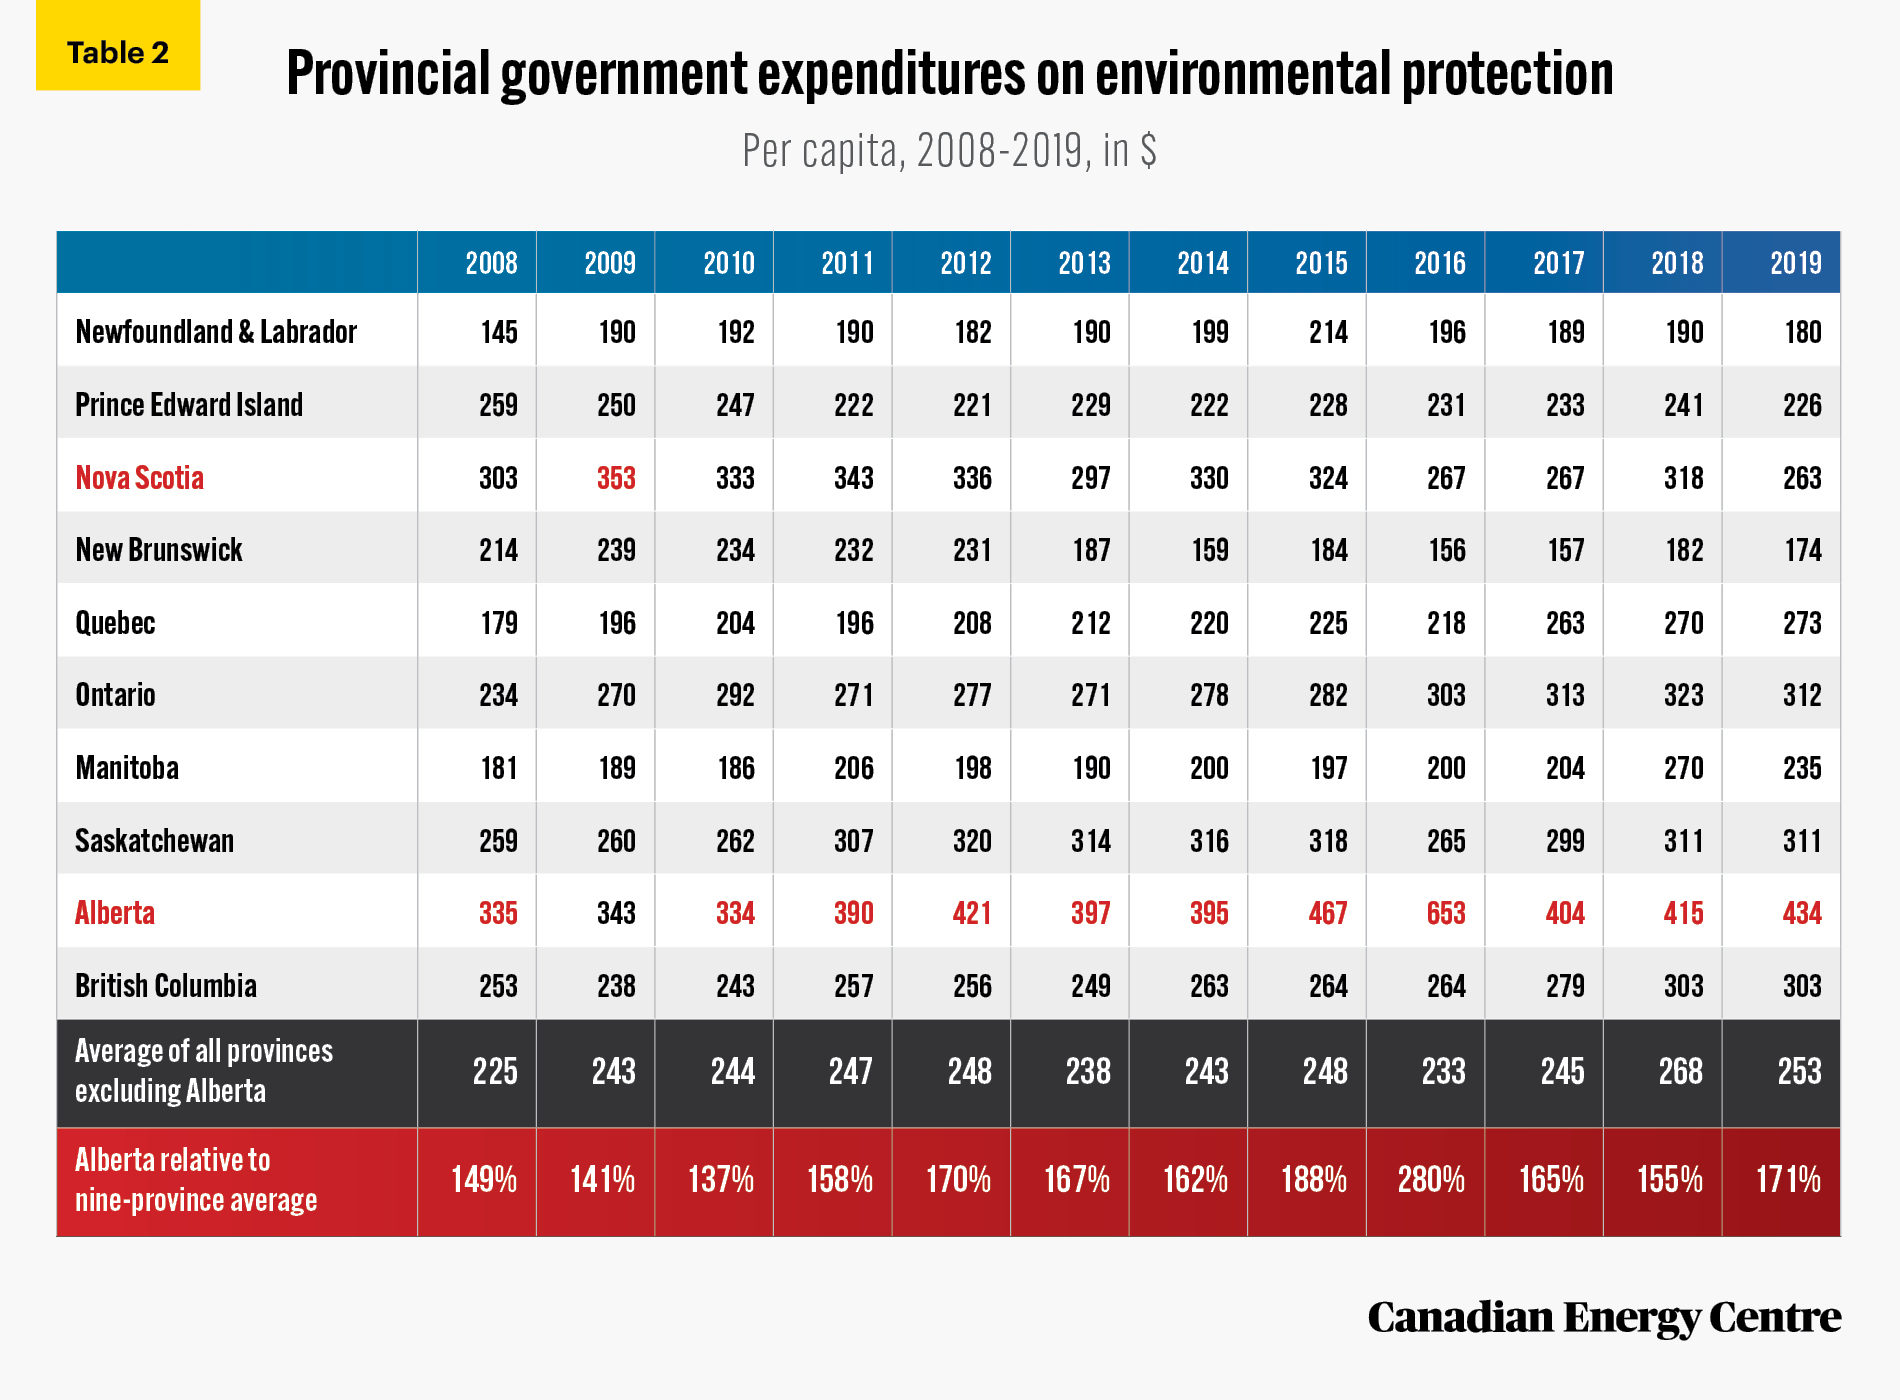
Table 2 illustrates all provincial spending on environmental protection between 2008 and 2019 inclusive. Of note:
- Alberta spent more per capita on environmental protection than any other province every year except for one year: Nova Scotia in 2009.
- When the other nine provinces annual average is compared, Alberta spent substantially more than the annual average of all the other provinces on environmental protection every year.
Sources: Statistics Canada Table 10-10-0005-01 and Table 17-10-0005-01.
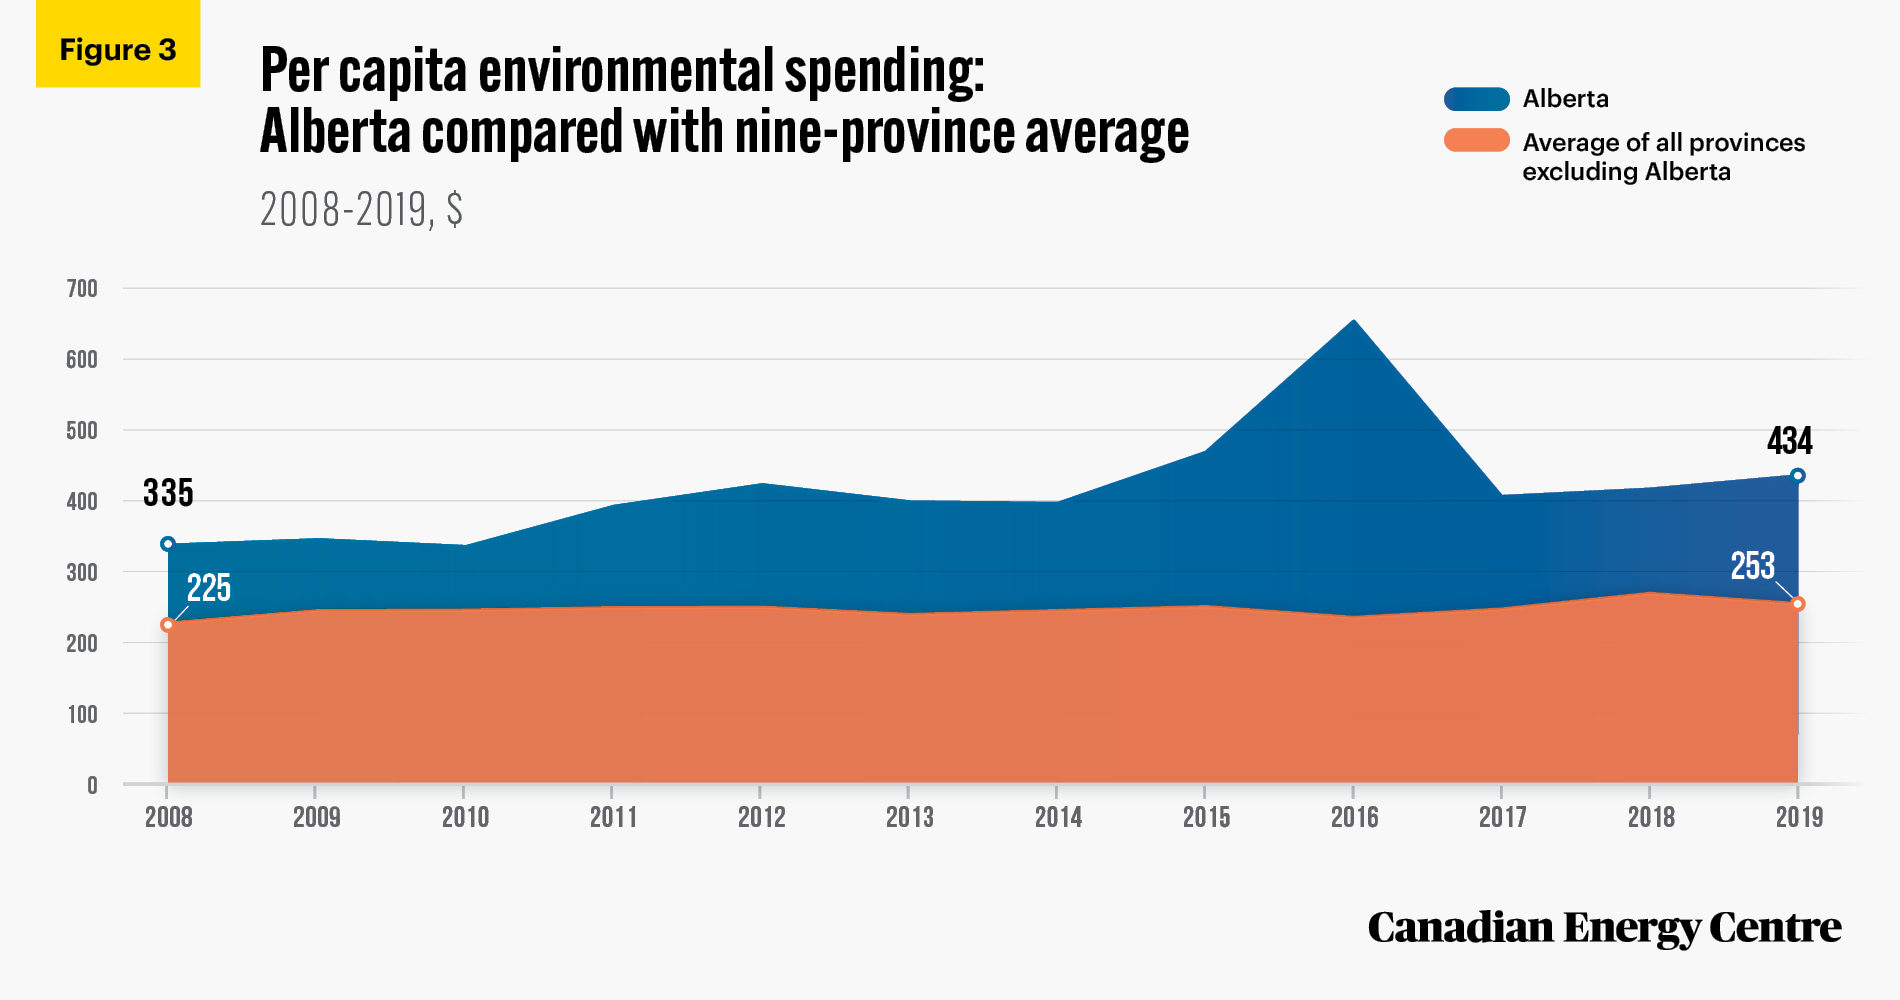
Table 2 and Figure 3 also show the following:
- In 2019, Alberta’s spending on the environment at $434 per capita was 139 per cent of the amount spent by Ontario ($312): 143 per cent of that spent by British Columbia ($303); 171 per cent of the nine-province average ($253); and 159 per cent of what was spent by Quebec spent ($273).³
3. The spike in environmental spending in Alberta in 2016 was due to $1.1 billion in new spending from the province’s Climate Leadership Plan. (Source: Statistics Canada 2018.)
Sources: Statistics Canada Table 10-10-0005-01 and Table 17-10-0005-01.
The takeaway: Environment spending highest by oil and gas industry and by Alberta
When measured as a proportion of $67.7 billion in all industry spending on environmental protection between 2006 and 2018, not including “gap” years in Statistics Canada data, Canada’s oil and gas sector spent $28.1 billion, or 41.5 per cent. All other industries in Canada were responsible for $39.6 billion or 58.5 per cent of such spending.
When provincial government spending is examined, with data available from 2008 to 2019, Alberta spent significantly more than its share of Canada’s population ($20.1 billion or 17.1 per cent of all provincial spending with a population at 11.7 per cent of provincial totals). This is also true when per capita spending is examined: Alberta’s environmental protection spending was significantly higher than the other nine provinces’ average for the entire 2008-2019 period.
Notes
This CEC Fact Sheet was compiled by Ven Venkatachalam and Mark Milke at the Canadian Energy Centre: www.canadianenergycentre.ca. The authors and the Canadian Energy Centre would like to thank and acknowledge the assistance of Philip Cross in reviewing the data and research for this Fact Sheet. All percentages in this report are calculated from the original data, which can run to multiple decimal points. They are not calculated using the rounded figures that may appear in charts and in the text, which are more reader friendly. Thus, calculations made from the rounded figures (and not the more precise source data) will differ from the more statistically precise percentages we arrive at using source data. Image credits: Lukas Kloeppel from Pexels.com
References (All links live as of February 21, 2021)
Statistics Canada (2020). Table 38-10-0042-01 <https://bit.ly/2Y65iQi>, Table : 38-10-0130-01 <https://bit.ly/3qMWJoQ>; Table 10-10-0005-01 <https://bit.ly/2ZEkp2W> ; Table 17-10-0005-01 <https://bit.ly/3d03wV5> ; Statistics Canada (2018). Government Expenditures in Alberta. A presentation to deputy ministers in Alberta, Anil Arora, February 12, 2018. <https://bit.ly/3svYAyP>
Creative Commons Copyright
Research and data from the Canadian Energy Centre (CEC) is available for public usage under creative commons copyright terms with attribution to the CEC. Attribution and specific restrictions on usage including non-commercial use only and no changes to material should follow guidelines enunciated by Creative Commons here: Attribution-NonCommercial-NoDerivs CC BY-NC-ND.
The unaltered reproduction of this content is free of charge with attribution to Canadian Energy Centre Ltd.