
To sign up to receive the latest Canadian Energy Centre research to your inbox email: [email protected]
Download the PDF here
Download the charts here
Introduction
Despite much discussion in their nations about energy security and leadership in environmental protection, including aggressive greenhouse gas emission reduction targets such as net zero emissions, European Union (EU) countries continue to import significant quantities of crude oil from autocracies and tyrannies.
In this CEC Fact Sheet, we examine trends in the volume (expressed in barrels) and total value (expressed in euros) of crude oil imports by the EU from Not Free, Partly Free, and Free countries between 2005 and 2019.
The terms “Not Free,” “Partly Free,” and “Free” are broad rankings that come from the Washington DC-based think tank Freedom House, which has measured and ranked countries and territories by their degree of freedom since 1973. Not Free countries are those where civil and other rights often fall far below those of Free countries.¹
Total EU crude oil imports, 2005-2019
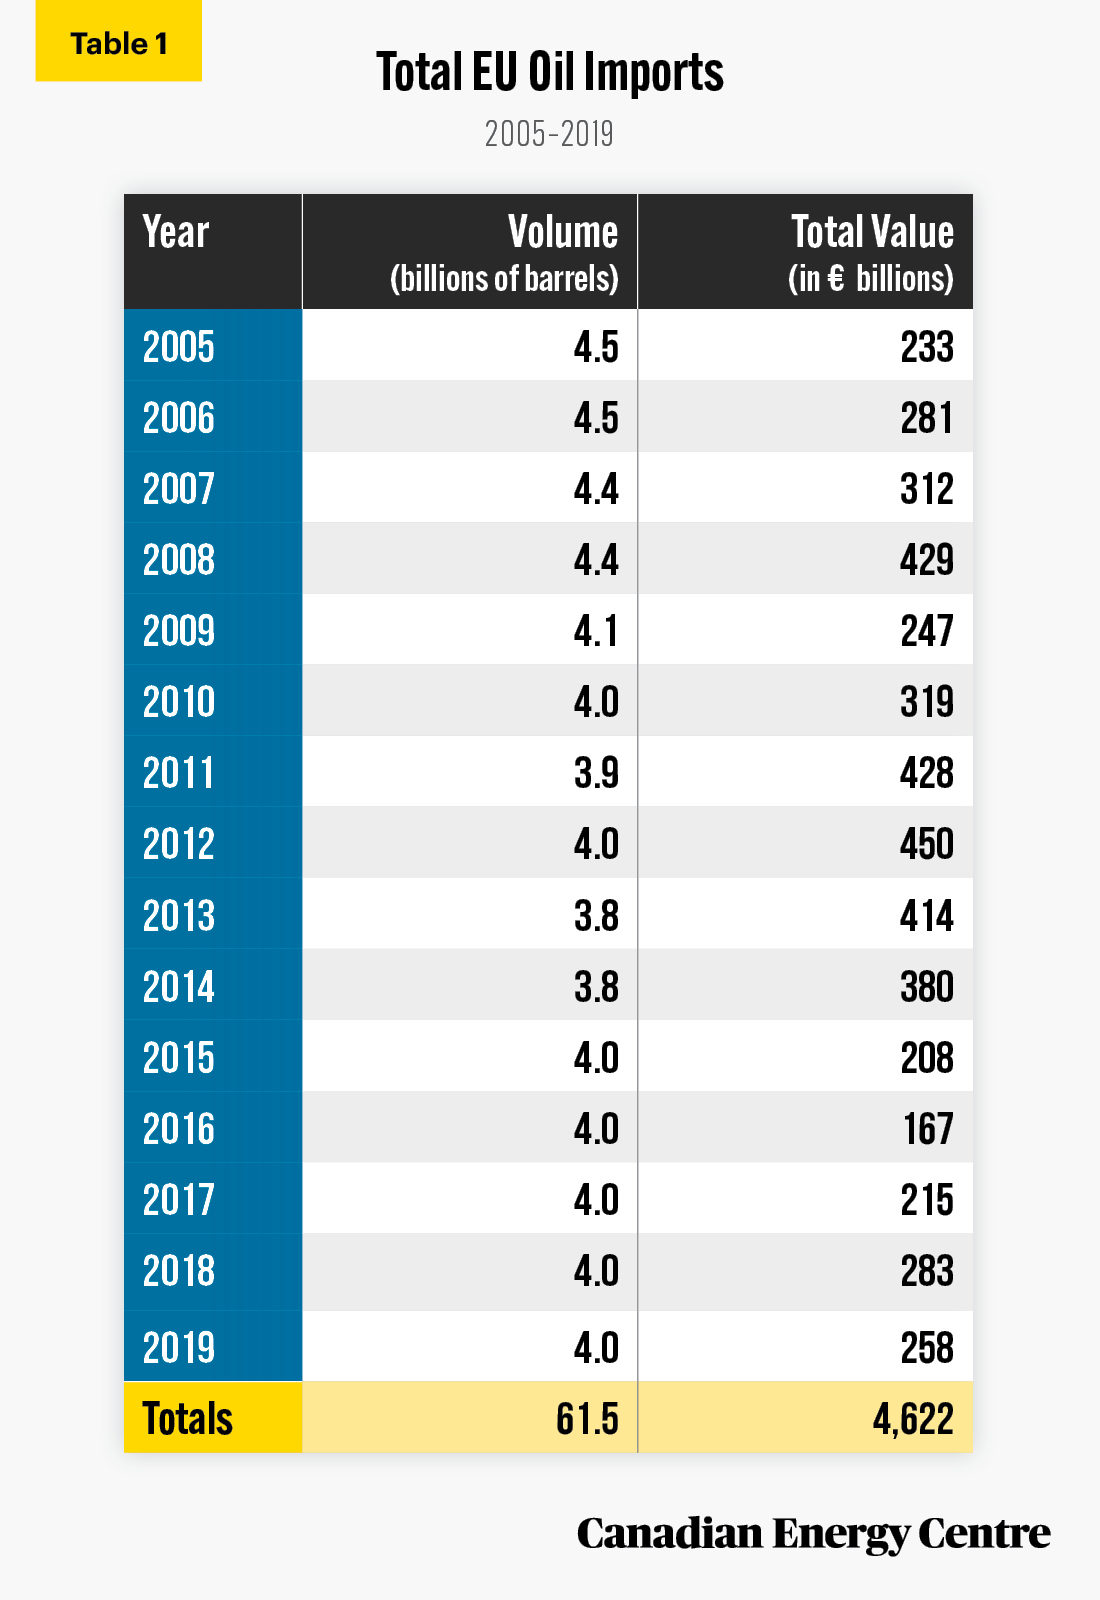
The EU has imported over 61 billion barrels of foreign crude oil since 2005, over two-thirds of it from Not Free countries.
In the past 15 years, the EU has imported 61.5 billion barrels of foreign crude oil, an average of over 4 billion barrels a year, which is worth over €4.6 trillion on an extra- and intra-EU basis (see Table 1) or nearly CAD$6.9 trillion.²
1. The 20 Not Free countries cited in this Fact Sheet are Algeria, Angola, Azerbaijan, Cameroon, Congo, Democratic Republic of Congo, Egypt, Gabon, Iran, Iraq, Kazakhstan, Libya, Oman, Qatar, Russia, Saudi Arabia, Syria, Venezuela, Vietnam, and Yemen. The eight Partly Free countries are Colombia, Ecuador, Kuwait, Malaysia, Mexico, Nigeria, Papua New Guinea, and the Ukraine.
2. Extra-EU imports refer to transactions, such as external trade, with all countries outside the EU, i.e., the rest of the world outside of the European Union (EU) member states (not including transit within the EU). Intra-EU imports refer to imports within the EU.
Source: European Commission, 2021.
EU oil imports measured by volume, 2005-2019
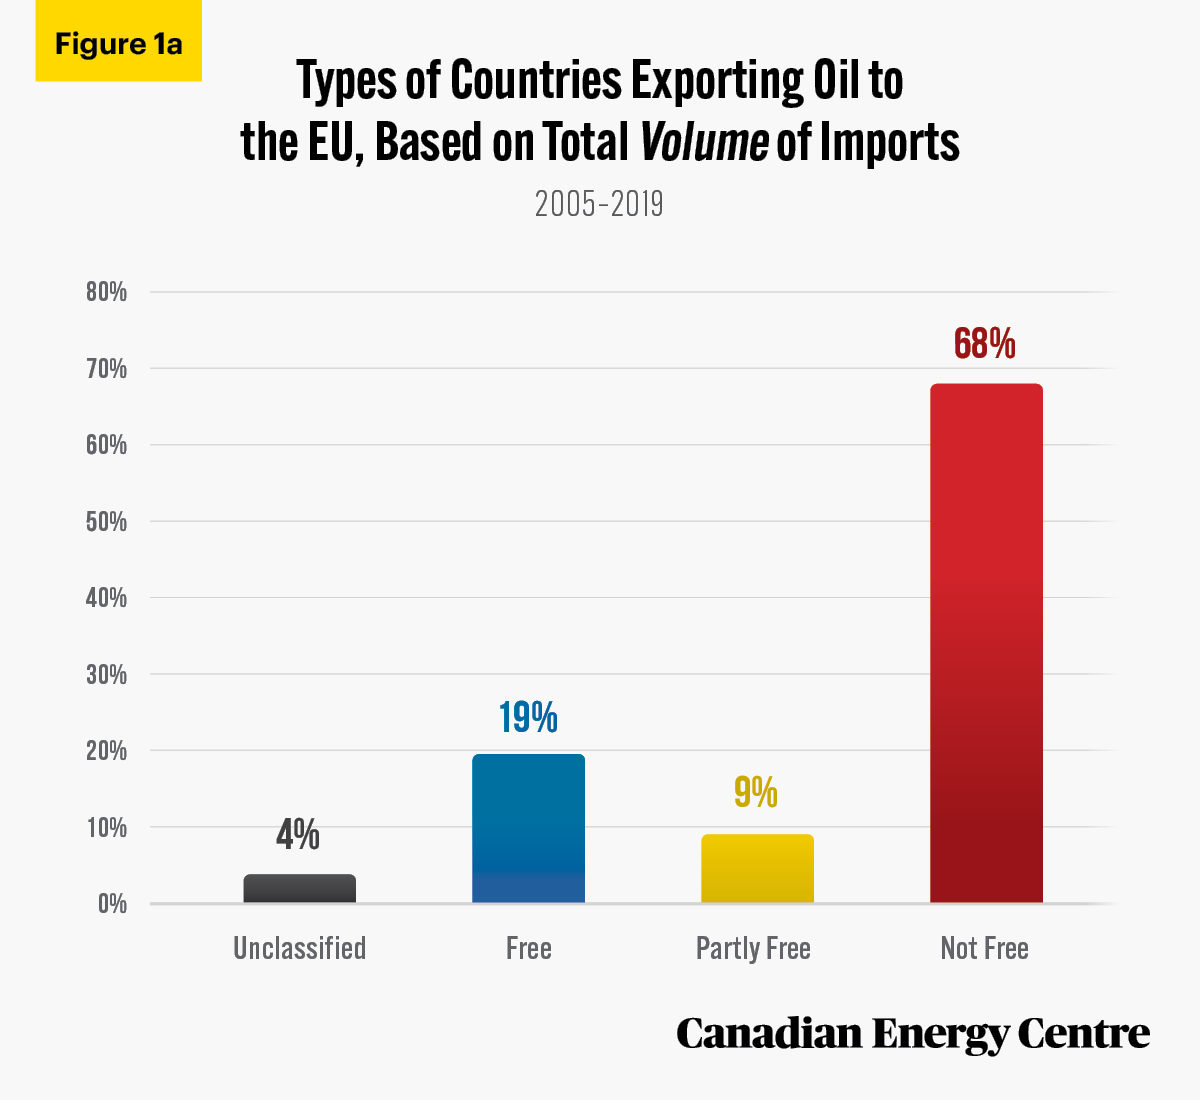
Over 41.3 billion barrels, or 68 per cent of the oil imported into the EU, has been imported from Not Free countries, with an additional 5.3 billion barrels, or 9 per cent, coming from Partly Free countries. Meanwhile, 11.8 billion barrels, or 19 per cent, was sourced from Free countries (see Figure 1a).
Source: European Commission, 2021.
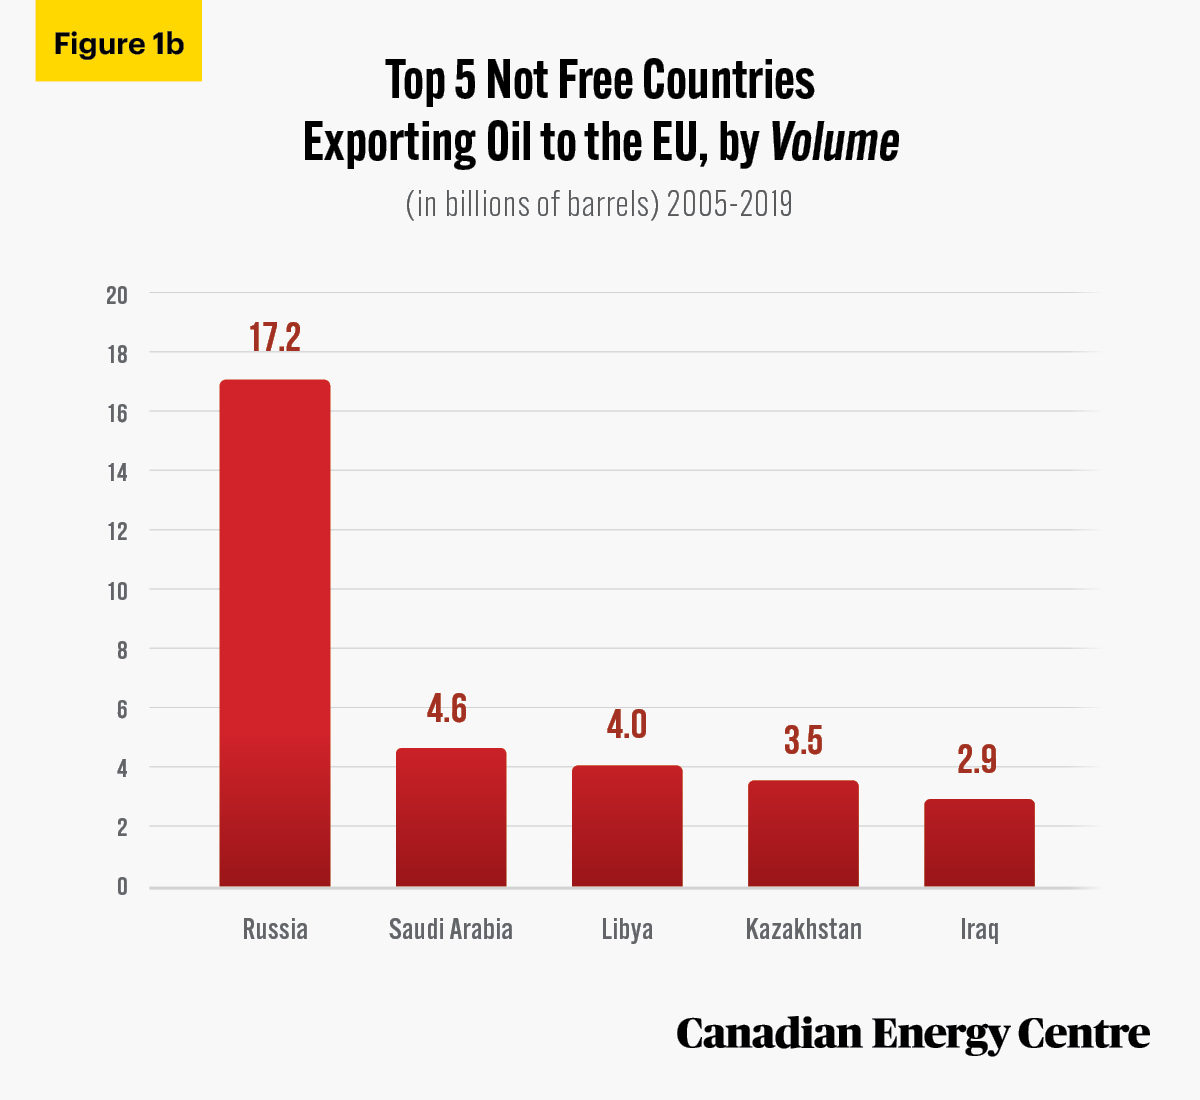
Of the more than 41.3 billion barrels of oil that the EU imported from Not Free countries between 2005 and 2019 (see Figure 1b),
- over 17.2 billion barrels, or about 42 per cent, came from Russia;
- nearly 4.6 billion barrels, or 11 per cent, came from Saudi Arabia;
- nearly 4 billion barrels, or 9.6 per cent, came from Libya;
- over 3.5 billion barrels, or 8.5 per cent, came from Kazakhstan; and
- nearly 2.9 billion barrels, or 6.9 per cent, came from Iraq.
Of the over 5.3 billion barrels of crude oil that the EU imported from Partly Free countries between 2005 and 2019,
- nearly 3.5 billion barrels, or nearly 65 per cent, came from Nigeria;
- over 1 billion barrels, or nearly 19 per cent, came from Mexico; and
- nearly 619 million barrels, or nearly 12 per cent, came from Kuwait.
Source: European Commission, 2021.
EU oil imports, measured in euros, 2005-2019
Between 2005 and 2019, the EU imported over €4.6 trillion worth of foreign crude oil, an average of €308 billion worth each year. That’s nearly CAD$6.9 trillion in total, or an annual average of CAD$458 billion in crude oil imports.
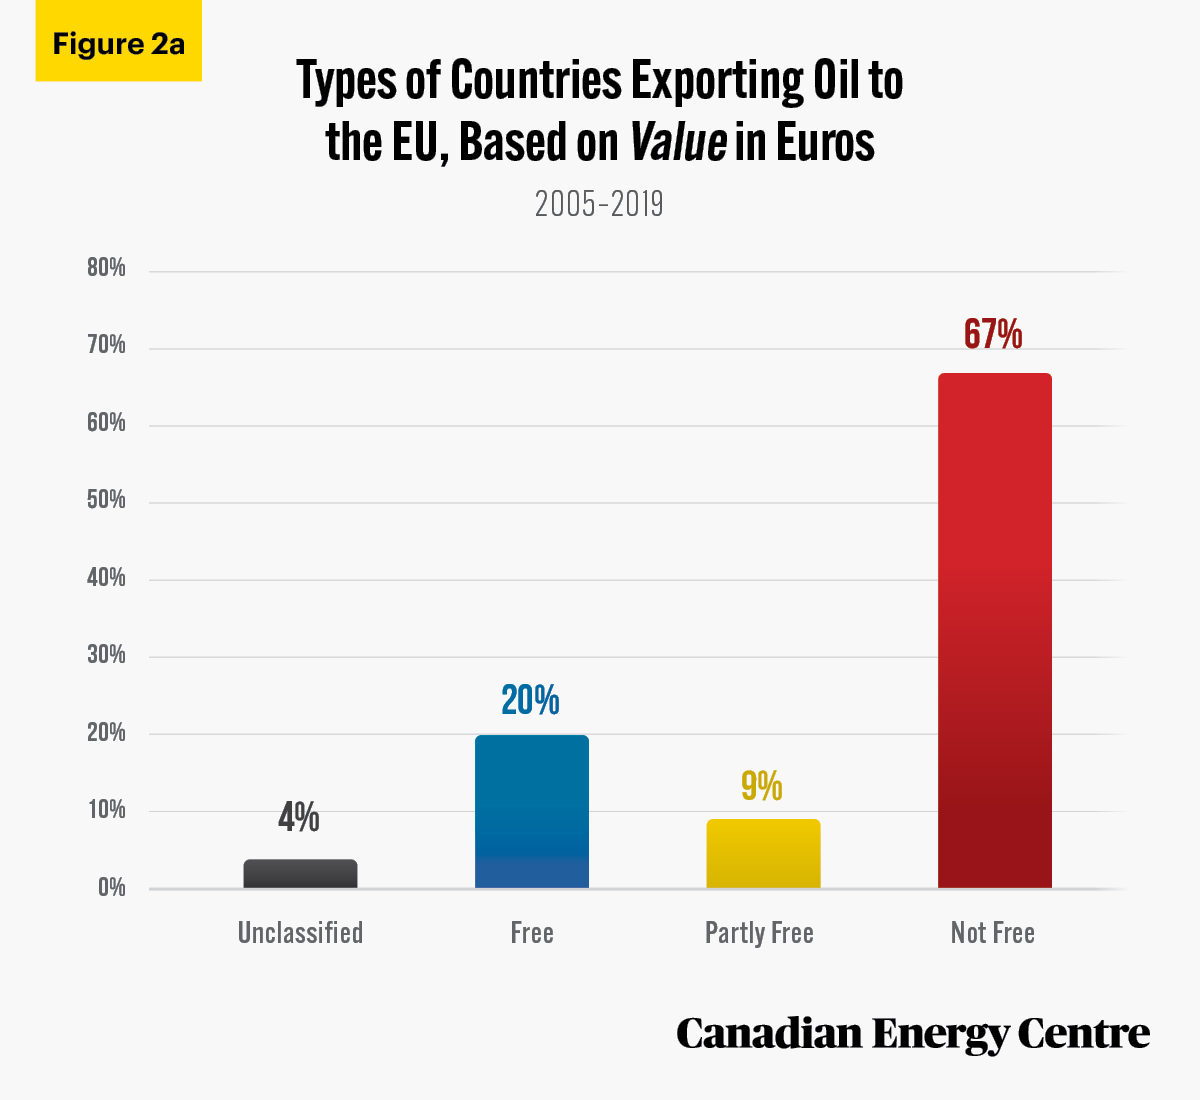
Nearly €3.1 trillion worth (about CAD$4.6 trillion), or 67 per cent, was imported from Not Free countries, with an additional €411 billion or 9 per cent coming from Partly Free countries. The EU sourced €901 billion, or nearly 20 per cent, from Free countries (see Figure 2a).
Source: European Commission, 2021.
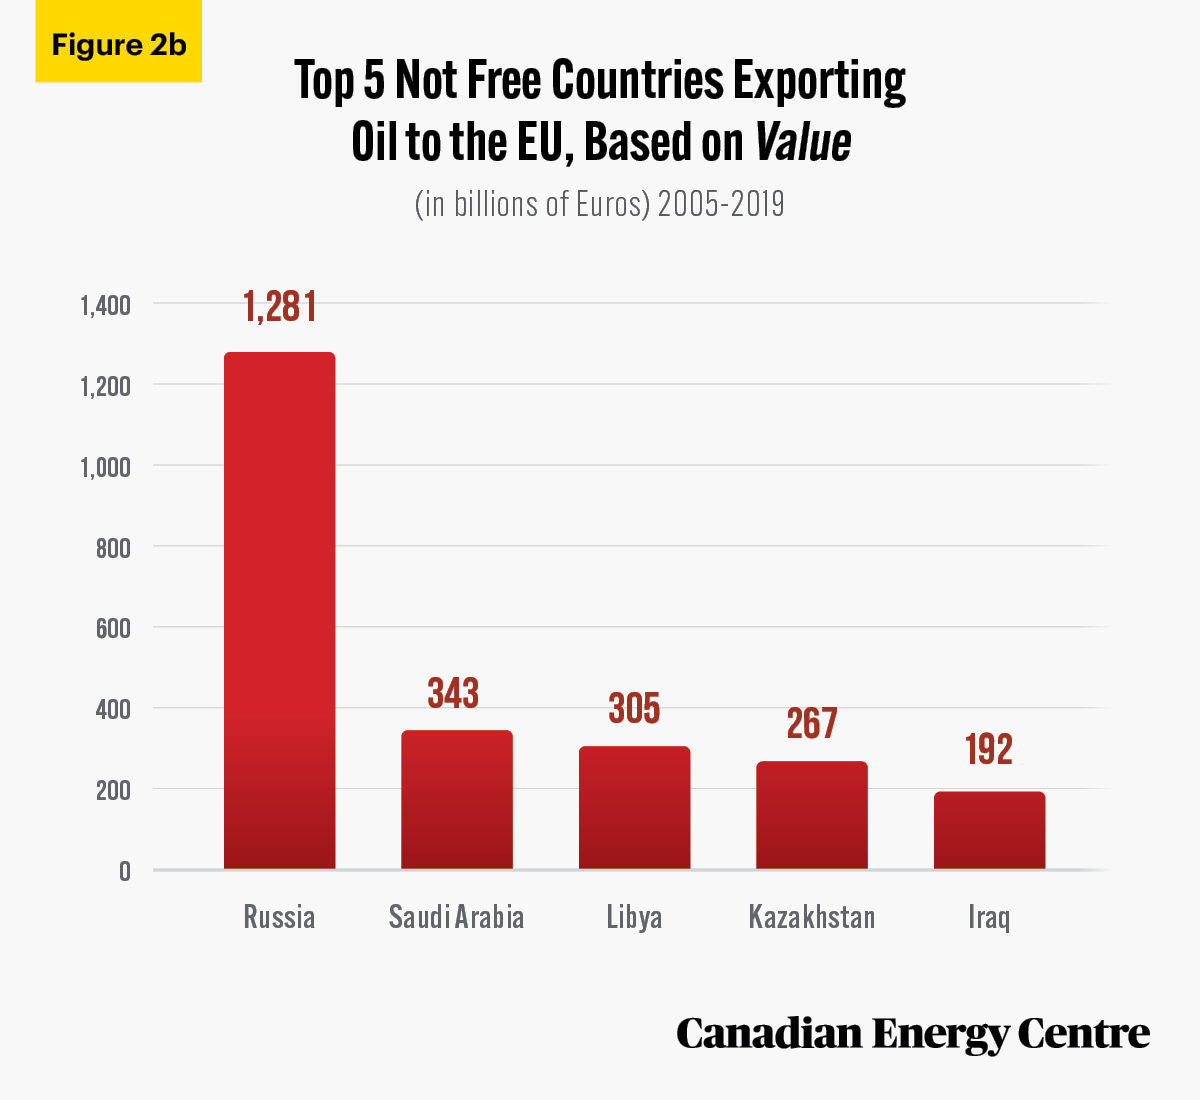
Of the nearly €3.1 trillion in oil that the EU imported from Not Free countries between 2005 and 2019, the top five sources were as follows (see Figure 2b):
- nearly €1.3 trillion, or about 42 per cent, came from Russia;
- nearly €343 billion, or just over 11 per cent, came from Saudi Arabia;
- over €305 billion, or 9.9 per cent, came from Libya;
- nearly €267 billion, or 8.7 per cent, came from Kazakhstan;
- nearly €192 billion, or 6.2 per cent, came from Iraq;
Of the nearly €411 billion in oil that the EU imported from Partly Free countries between 2005 and 2019,
- nearly €282 billion, or almost 69 per cent, came from Nigeria;
- over €66 billion, or just over 16 per cent, came from Mexico;
- and over €42 billon, or just over 10 per cent, came from Kuwait.
Source: European Commission, 2021.
EU crude oil imports in 2019 by volume: 67% from Not Free countries
- We examined extra-EU3 data from 2019 in isolation to get an idea of the value of imports that EU countries received in that year as time series data on EU foreign oil imports received by country is not readily available from the European Commission.
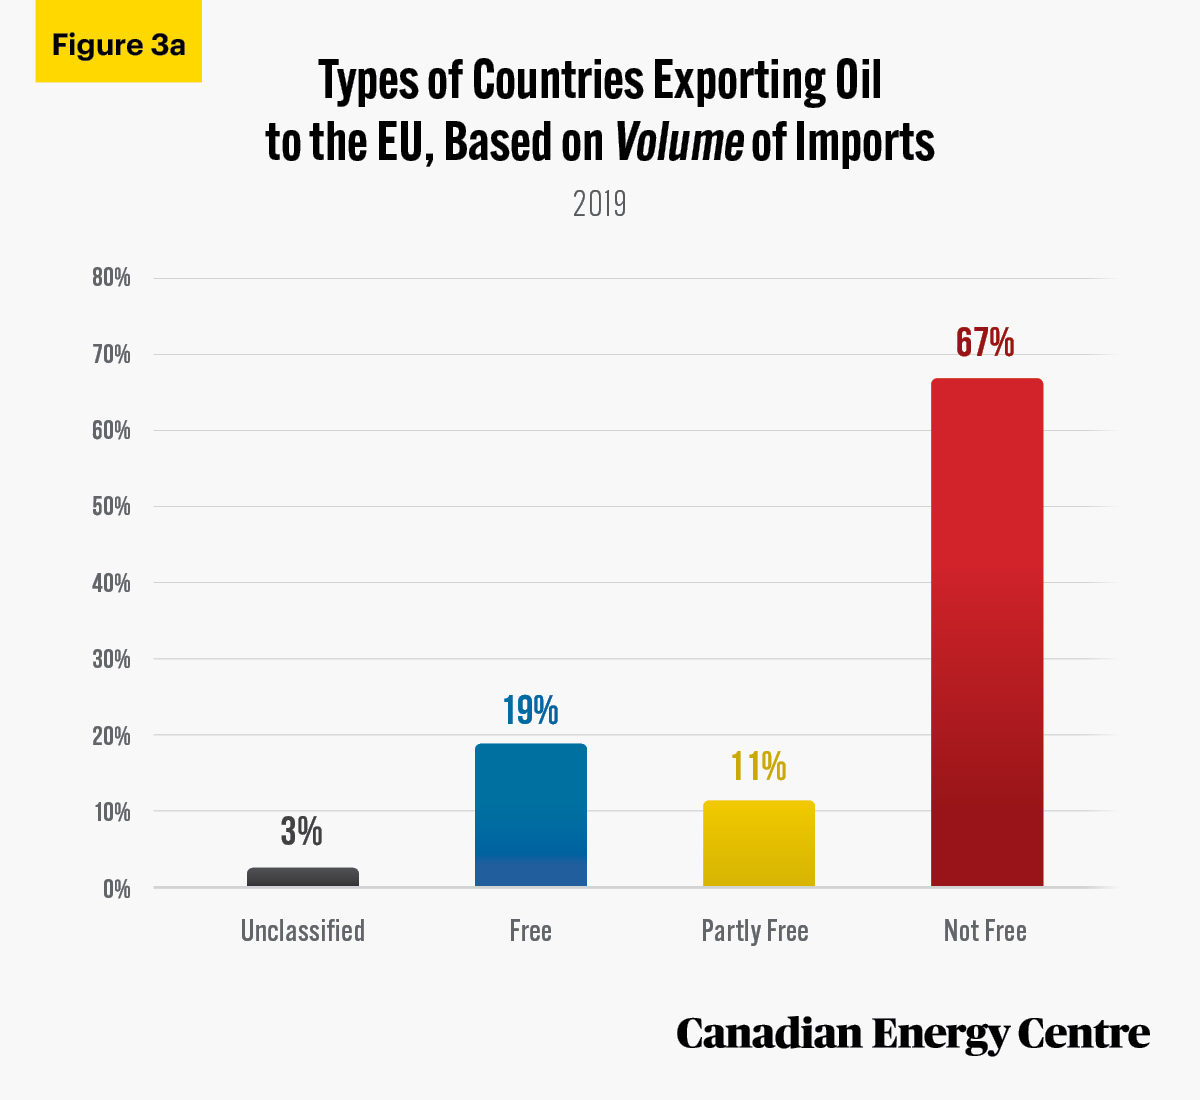
- In 2019, the EU imported over 3.8 billion barrels of foreign crude oil. Of that, over 2.5 billion barrels, or 67 per cent, was imported from Not Free countries, while an additional 426 million barrels, or 11 per cent, came from Partly Free countries. Meanwhile, nearly 714 million barrels, or 19 per cent, was sourced from Free countries (see Figure 3a).
3. Extra-EU data refers to transactions with all countries outside of the EU: i.e., the rest of the world except for the European Union (EU) member states.
Source: European Commission, 2021.
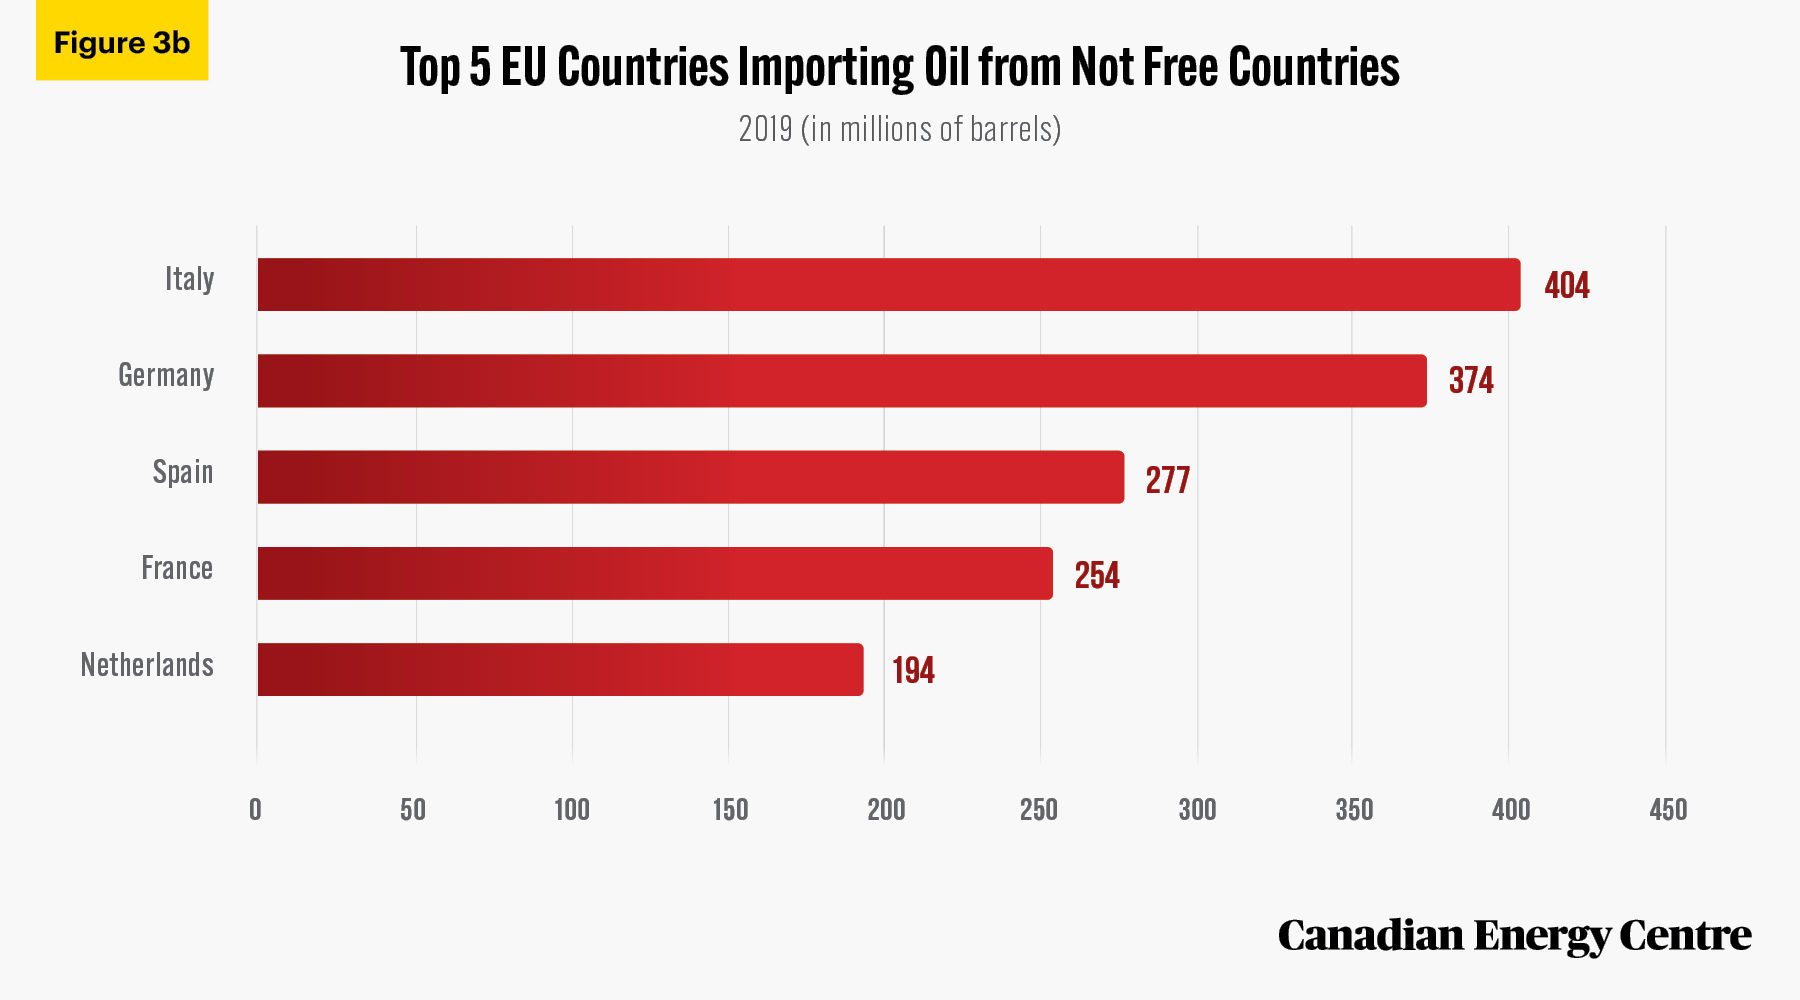
Of the over 2.5 billion barrels imported by the EU from Not Free countries in 2019, over 1.5 billion barrels, or nearly 59 per cent, was imported by just five countries – Italy, at just over 404 million barrels, followed by Germany at just under 374 million barrels, then Spain at almost 277 million barrels, France at almost 254 million barrels, and the Netherlands at just under 194 million barrels (see Figure 3b).
Source: European Commission, 2021.
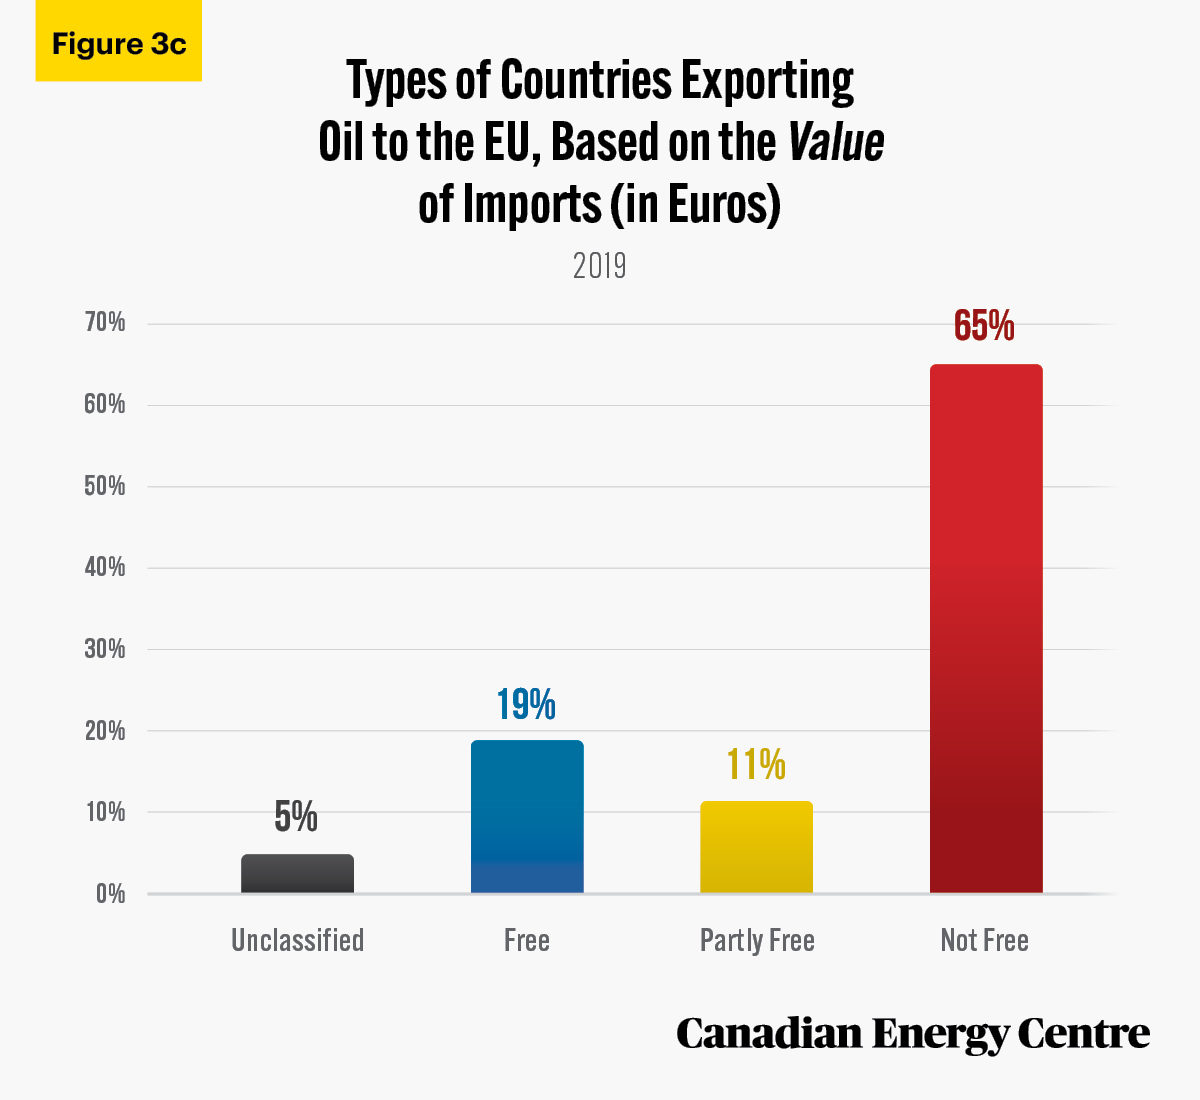
EU crude oil imports in 2019 by value: 65% from Not Free countries
In 2019, the EU imported nearly €245 billion (or CAD$364 billion) worth of foreign crude oil (i.e., from sources outside the EU).
Over €160 billion (CAD$ 238 billion), or 65 per cent, was imported from Not Free countries, with an additional €27 billion, or 11 per cent, from Partly Free countries and €46 billion, or 19 per cent, from Free countries.
Source: European Commission, 2021.
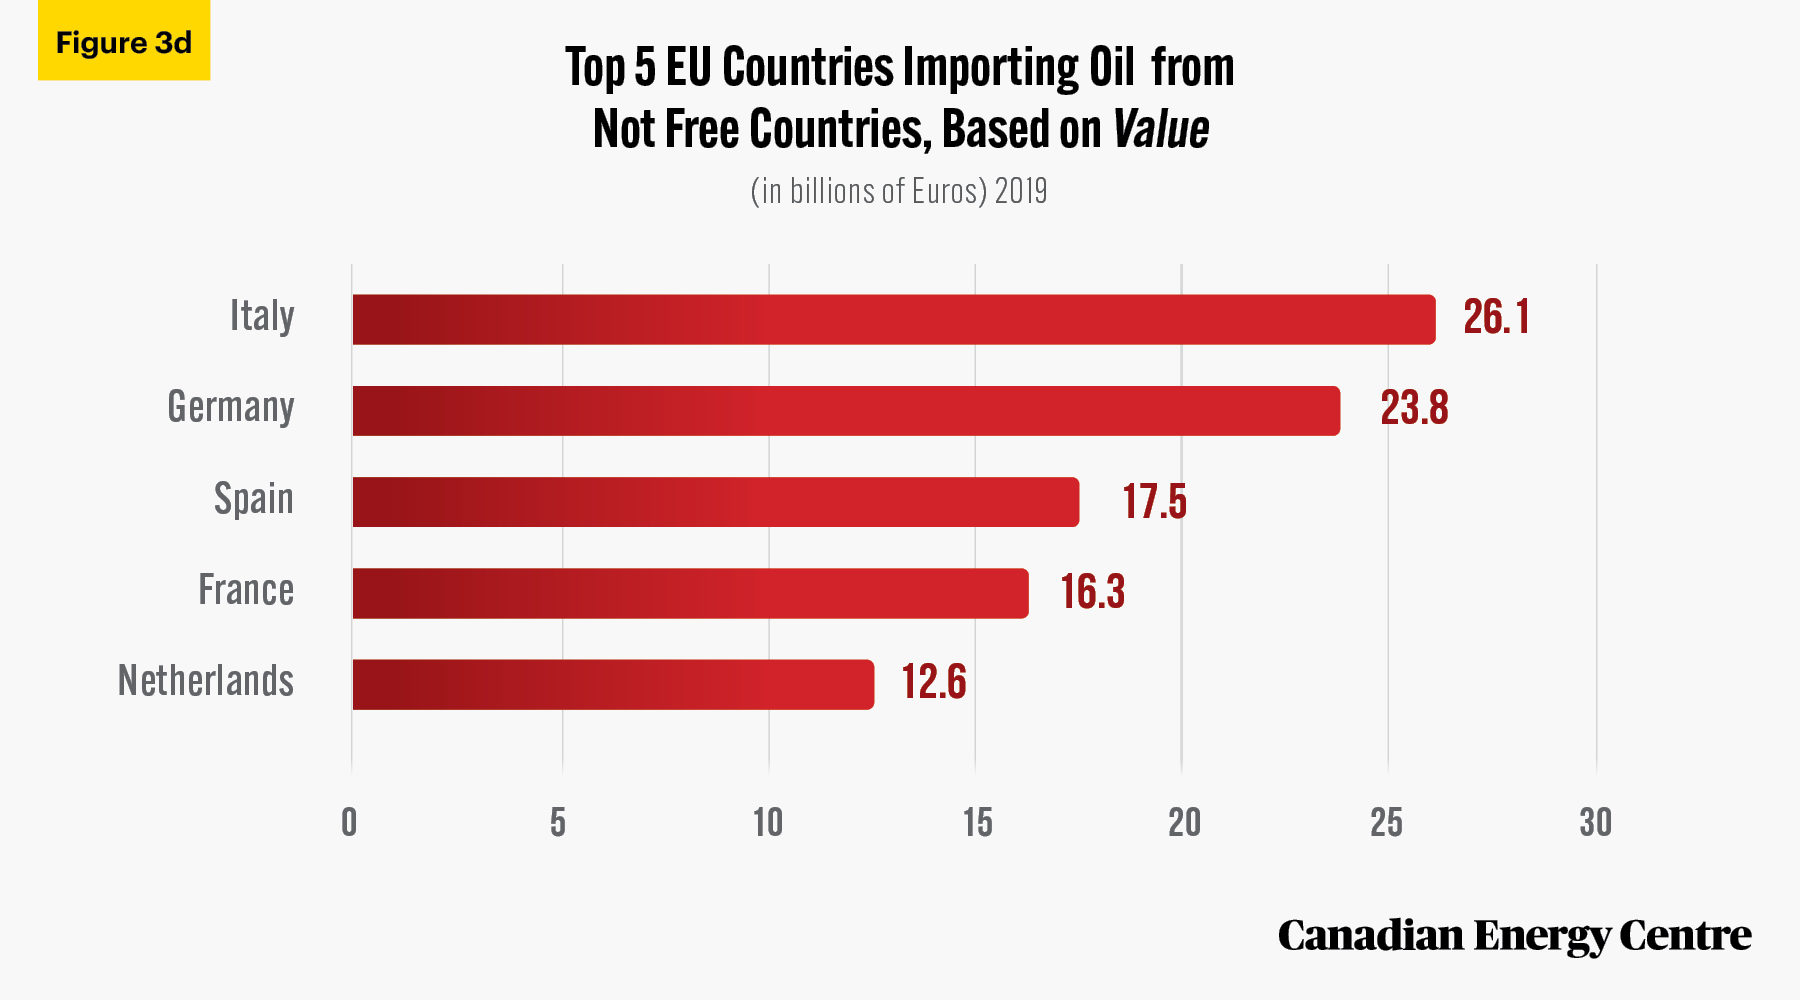
Oil imports from Not Free countries in 2019: Top 5 EU countries
Of the over €160 billion imported by the EU from Not Free countries in 2019, over €96 billion, or over 60 per cent, was imported by just five countries—Italy, Germany, Spain, France and the Netherlands. The range was from €12.6 billion (the Netherlands) to €26.1 billion (Italy) (see Figure 3d).
Over 80% of EU crude oil imports come from non-European companies, including Rosneft (Russia), Saudi Aramco (Saudi Arabia), and the National Iranian Oil Company (NIOC) (Iran)
According to Cambridge Econometrics (2020), over 80 per cent of crude oil imports to the EU in 2018 were from nonEuropean companies, most notably Rosneft (Russia), Saudi Aramco (Saudi Arabia), and the National Iranian Oil Company (NIOC) (Iran).
Source: European Commission, 2021.
EU crude oil import dependency remains high at 88.6% in 2019
Crude oil import dependency is the proportion of crude oil that a country must import to meet all of its energy needs. It is defined as net crude oil imports (imports minus exports) divided by gross available crude oil, expressed as a percentage. A negative dependency rate indicates that a country is a net exporter of energy while a dependency rate above 100 per cent indicates that the country in question has
stockpiled crude oil products.
Over the past 15 years, the EU (including the United Kingdom) has remained highly dependent on imports to meet its demand for crude oil and petroleum products, with nearly 89 per cent import dependency in 2019. Crude oil dependence increased from 82 per cent in 2005 to over 89 per cent in 2015, before falling back to just under 89 per cent in 2019. This high level of crude oil import dependence reflects falling crude oil production within Europe overall.
Crude oil import dependence in 2019 was extremely high among countries such as Germany (97 per cent), France (98 per cent), Italy (almost 93 per cent), the Netherlands (101.6 per cent), and Sweden (106.7 per cent).
With the withdrawal from the EU of the United Kingdom, which had been responsible for 70 per cent of the EU’s crude oil production, crude oil dependency is expected to grow. If we exclude the United Kingdom from the 2019 data, EU crude oil dependency would have been just under 97 per cent that year.
Conclusion: Opportunities for Canada
Over the past 15 years, the EU has been heavily dependent on foreign crude oil shipped from autocracies and tyrannies, such as Russia, Saudi Arabia, Kazakhstan, Iraq, and Azerbaijan.
Between 2005 and 2019, the EU imported 41 billion barrels of crude oil, valued at €3.1 trillion (nearly CAD$4.6 billion) on an intra- and extra-EU basis from autocracies and tyrannies, including 2.5 billion barrels, valued at nearly €245 billion (or CAD $364 billion) in 2019 alone. In fact, Italy, Germany, Spain, France, and the Netherlands were responsible for nearly 60 per cent of the EU’s foreign oil imports from autocracies and tyrannies in 2019.
The EU dependence on crude oil sourced from autocracies and tyrannies comes with increased risks for the region’s energy security. According to a report prepared by Cambridge Econometrics for the European organization Transportation and Environment, “a high proportion of EU oil imports are from geopolitically unstable regions that have seen increases in terrorism, internal and border conflicts, or wars. As a result, consumers and industries in the EU face an increased risk of oil supply interruptions and shortages” (Cambridge Econometrics, 2020).
Under the Canada-EU Comprehensive Economic and Trade Agreement (CETA), supplier diversification is one of the EU’s top energy priorities. As the EU moves to increase its energy security, it will need to seriously consider reducing its dependence on autocracies and tyrannies for its crude oil imports. Instead, it needs to favour more reliable and secure suppliers for its crude oil, like Canada. With improved pipeline infrastructure, particularly a west-east pipeline, the potential exists for Canada to significantly increase its market share in the EU.
Notes
This CEC Fact Sheet was compiled by Lennie Kaplan and Mark Milke at the Canadian Energy Centre (www.canadianenergycentre.ca). The authors and the Canadian Energy Centre would like to thank and acknowledge the assistance of Philip Cross in reviewing the original data and research for this Fact Sheet. Image credits: Alexandre Lallemand
References (as of August 30, 2021)
Bank of Canada, Undated, Annual Exchange Rates <https://bit.ly/3AVrzQY>; Cambridge Econometrics, 2020, Oil Dependency in the EU <https://bit.ly/3DaeMvQ>. European Commission, 2021, Energy Import Dependency by Products <https://bit.ly/3ceuSbi>; European Commission, 2021, EU Crude Oil Imports and Supply Cost <http://bit.ly/3cev3U0>; Freedom House, 2020, Countries and Territories: Global Freedom Scores <https://bit.ly/2yS1IPf>; Guardian, 2019, Revealed: The 2 Firms Behind a Third of All Carbon Emissions <http://bit.ly/3sZED3J>; Sustainalytics, 2021, Company ESG Risk Ratings <http://bit.ly/3l47cdK>.
Creative Commons Copyright
Research and data from the Canadian Energy Centre (CEC) is available for public usage under creative commons copyright terms with attribution to the CEC. Attribution and specific restrictions on usage including non-commercial use only and no changes to material should follow guidelines enunciated by Creative Commons here: Attribution-NonCommercial-NoDerivs CC BY-NC-ND.