To sign up to receive the latest Canadian Energy Centre research to your inbox email [email protected]
Overview
There has been considerable debate about the absolute greenhouse gas (GHG) emissions arising from the activities of Canada’s oil and gas sector, but little attention paid to the reductions in GHG emissions intensity that have occurred within the sector over the past two decades.
In this CEC Research Brief (which can be downloaded here as a pdf), we examine trends in emissions intensity in Canada generally, and in the oil and gas sector specifically, over the past two decades and compare Canada’s emissions intensity performance with that of a number of energy-producing and consuming countries.
Methodology for Measuring Greenhouse Gas Emissions Intensity
GHG emissions occur over the entire life of a hydrocarbon fuel, from its production, refining, transport to markets, combustion, and consumption. The production, refining, and marketing phases make up a relatively small share of overall emissions. In fact, final combustion of refined petroleum products account for 70 to 80 percent of life-cycle emissions
(IHS Markit, 2020).
Emissions intensity is determined by dividing the amount of absolute GHG emissions by some unit of output, such as GDP,
energy used, population, or barrel of crude oil produced.
Four key emissions intensity measures
This CEC Research Brief examines the trends of four key measures of emissions intensity:
-
- Ratio of emissions produced to gross domestic product (GDP), sometimes expressed in terms of purchasing power
parity (PPP) in US dollars. - Ratio of emissions produced per person
- Ratio of emissions released per unit of energy used
- Ratio of emissions per barrel of oil produced
- Ratio of emissions produced to gross domestic product (GDP), sometimes expressed in terms of purchasing power
Key Findings
On the basis of data drawn from sources that include Statistics Canada, the International Energy Agency (IEA), the World Resources Institute, BMO Capital Markets, IHS Markit, and others, Canada’s oil and gas sector has been reducing its GHG emissions intensity over the past two decades.
Canada’s GHG emissions per person, per unit of GDP, per unit of energy used, and per barrel of oil produced, have been in noticeable decline over the past two decades. Canada is making real and measurable progress. The key findings are as follows:
Canada’s emissions intensity has fallen by 30 per cent since 2000
- Between 2000 and 2018, GHG emissions intensity in Canada has fallen from 0.5 megatonnes of carbon dioxide equivalent (MT of CO2e) per billion dollars of GDP to 0.35 MT, a decline of 30 per cent.
Canada’s emissions intensity is lower than a number of other energy-producing and consuming nations
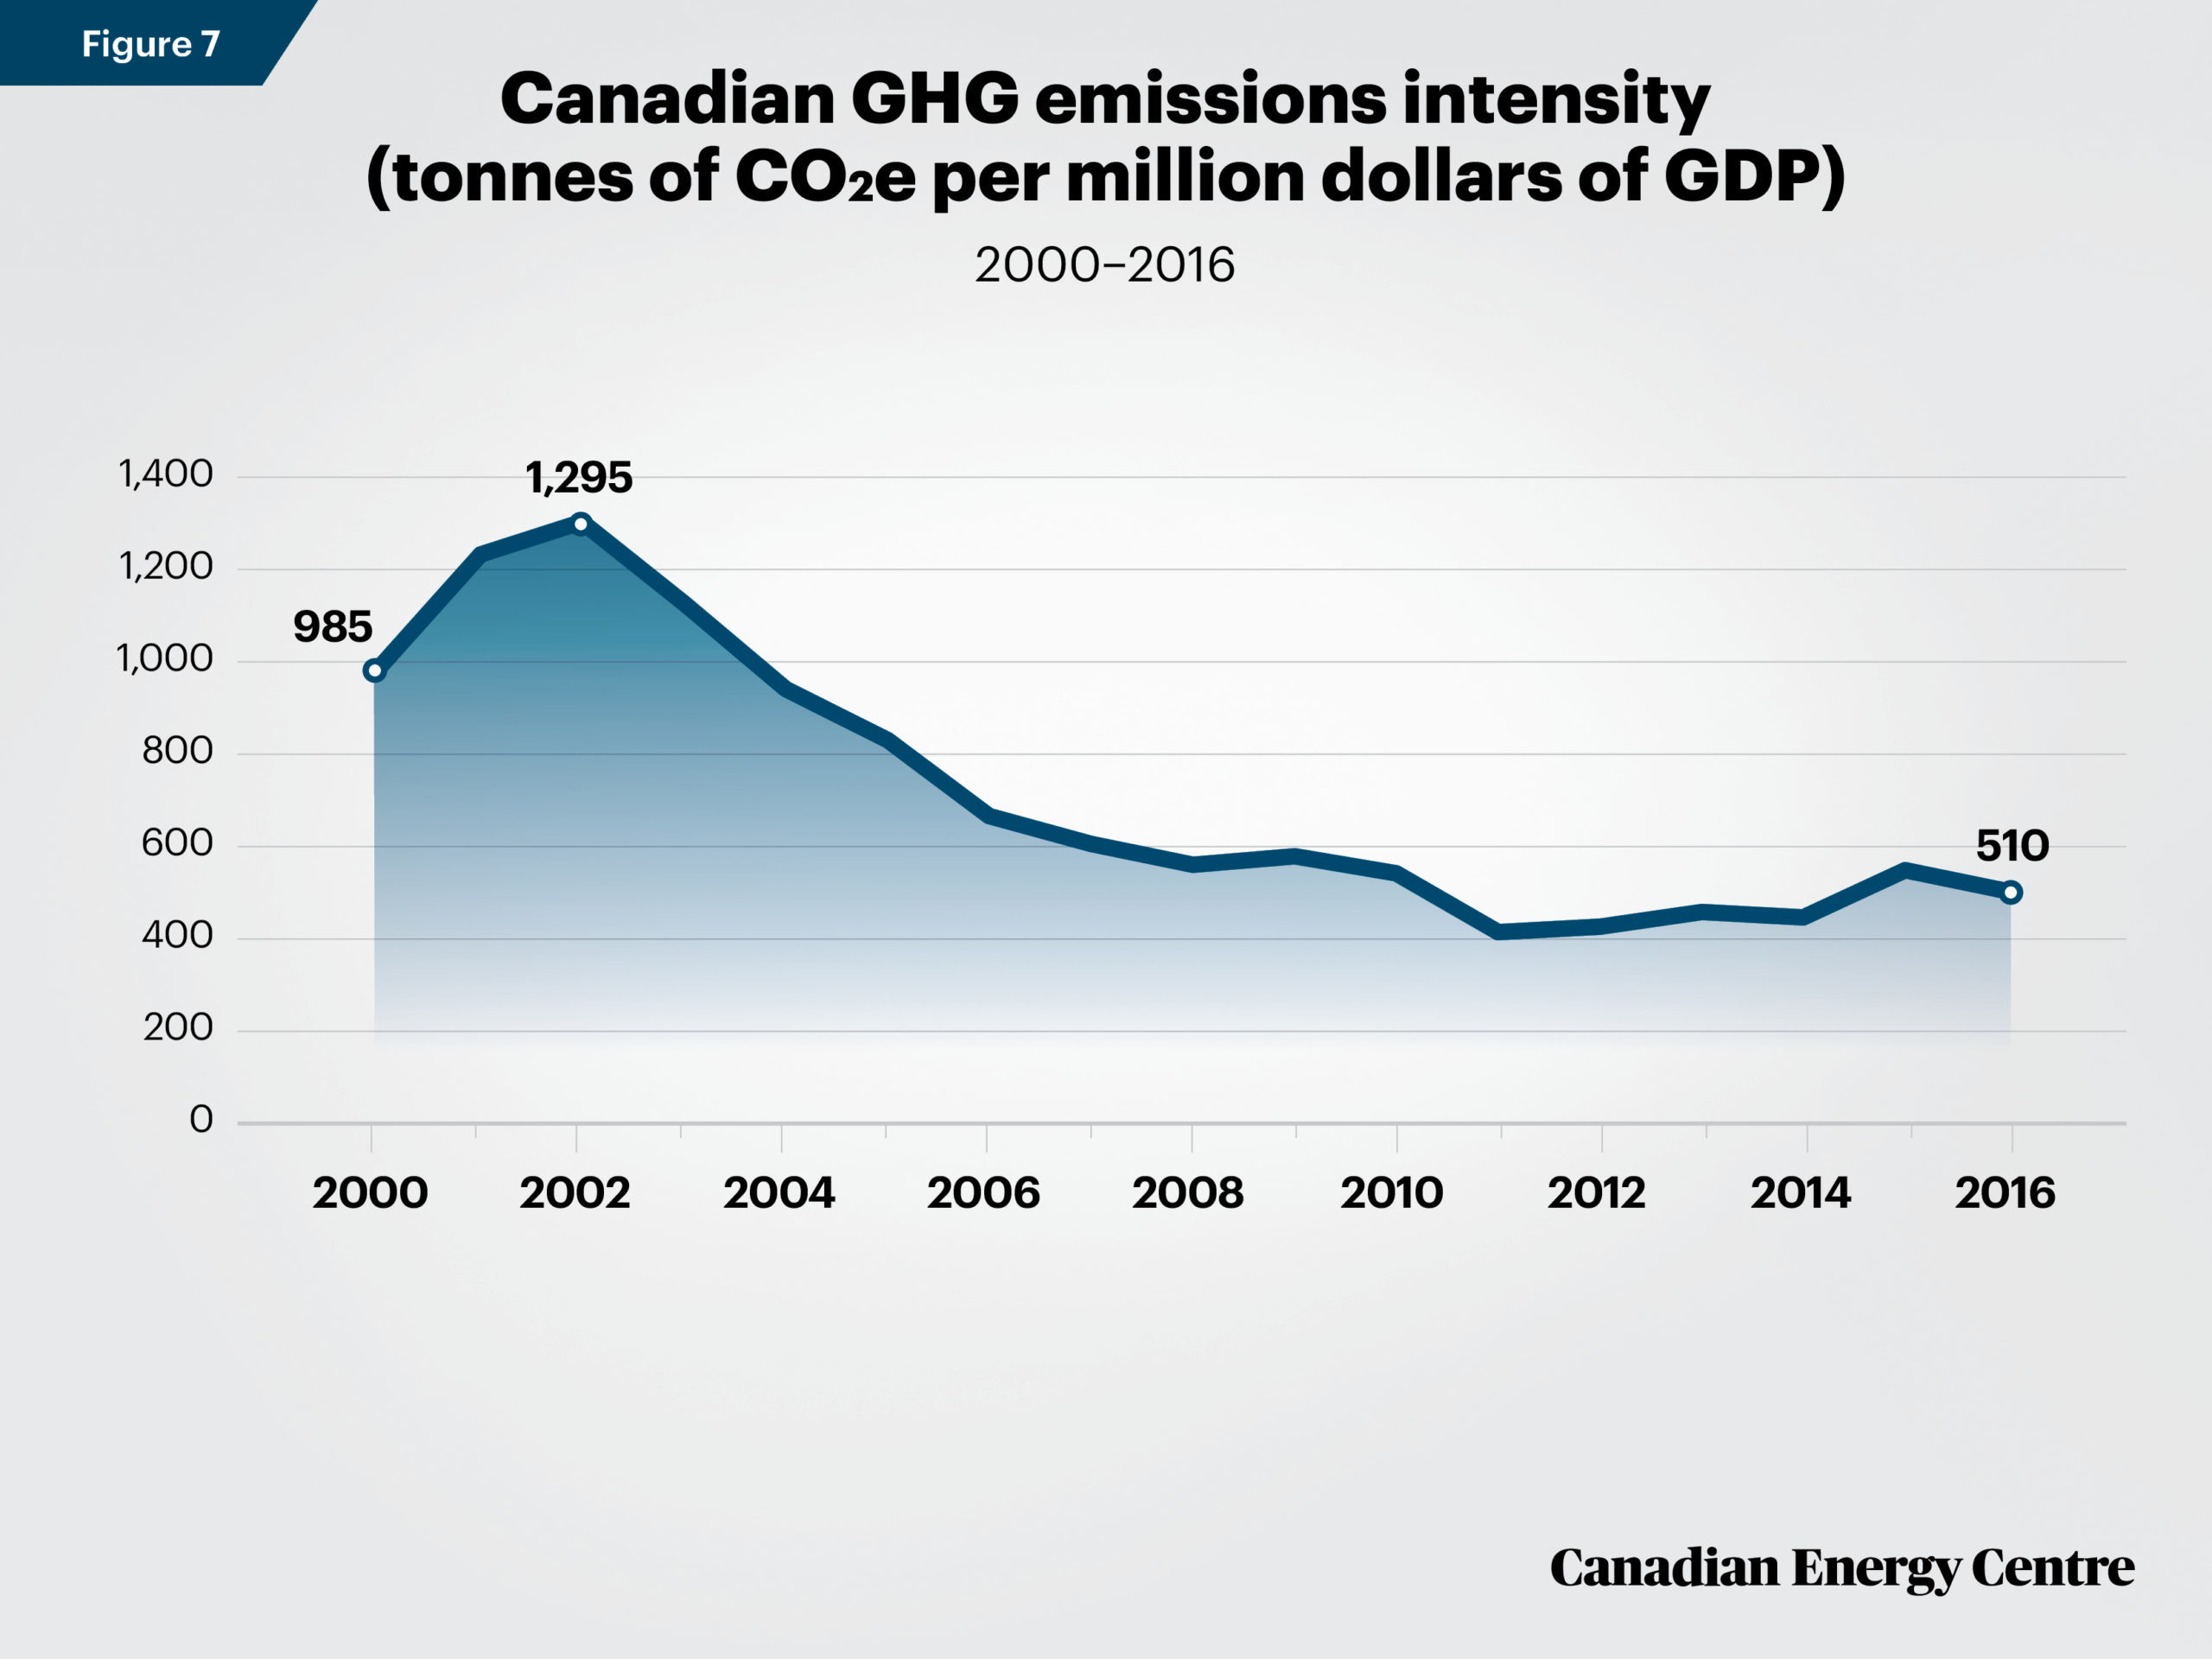
- Between 2000 and 2016, Canada’s GHG emissions intensity fell from 985.19 tonnes of CO2e per million dollars of GDP to 510 tonnes, a decline of over 48 per cent.
- As of 2016, Canada’s GHG emissions intensity of 510 tonnes of CO2e per million dollars of GDP is lower than other energy-producing and energy-consuming countries, such as China, India, Brazil, Oman, Qatar, Russia, Saudi Arabia, and the United Arab Emirates.
- Between 2000 and 2016, Canada’s GHG emissions intensity fell from 23.83 tonnes of CO2e per person to 21.58 tonnes, a decline of over 9 per cent.
- As of 2016, Canada’s GHG emissions intensity per person was nearly the same as Australia and Saudi Arabia: lower than Qatar, but higher than the United States.
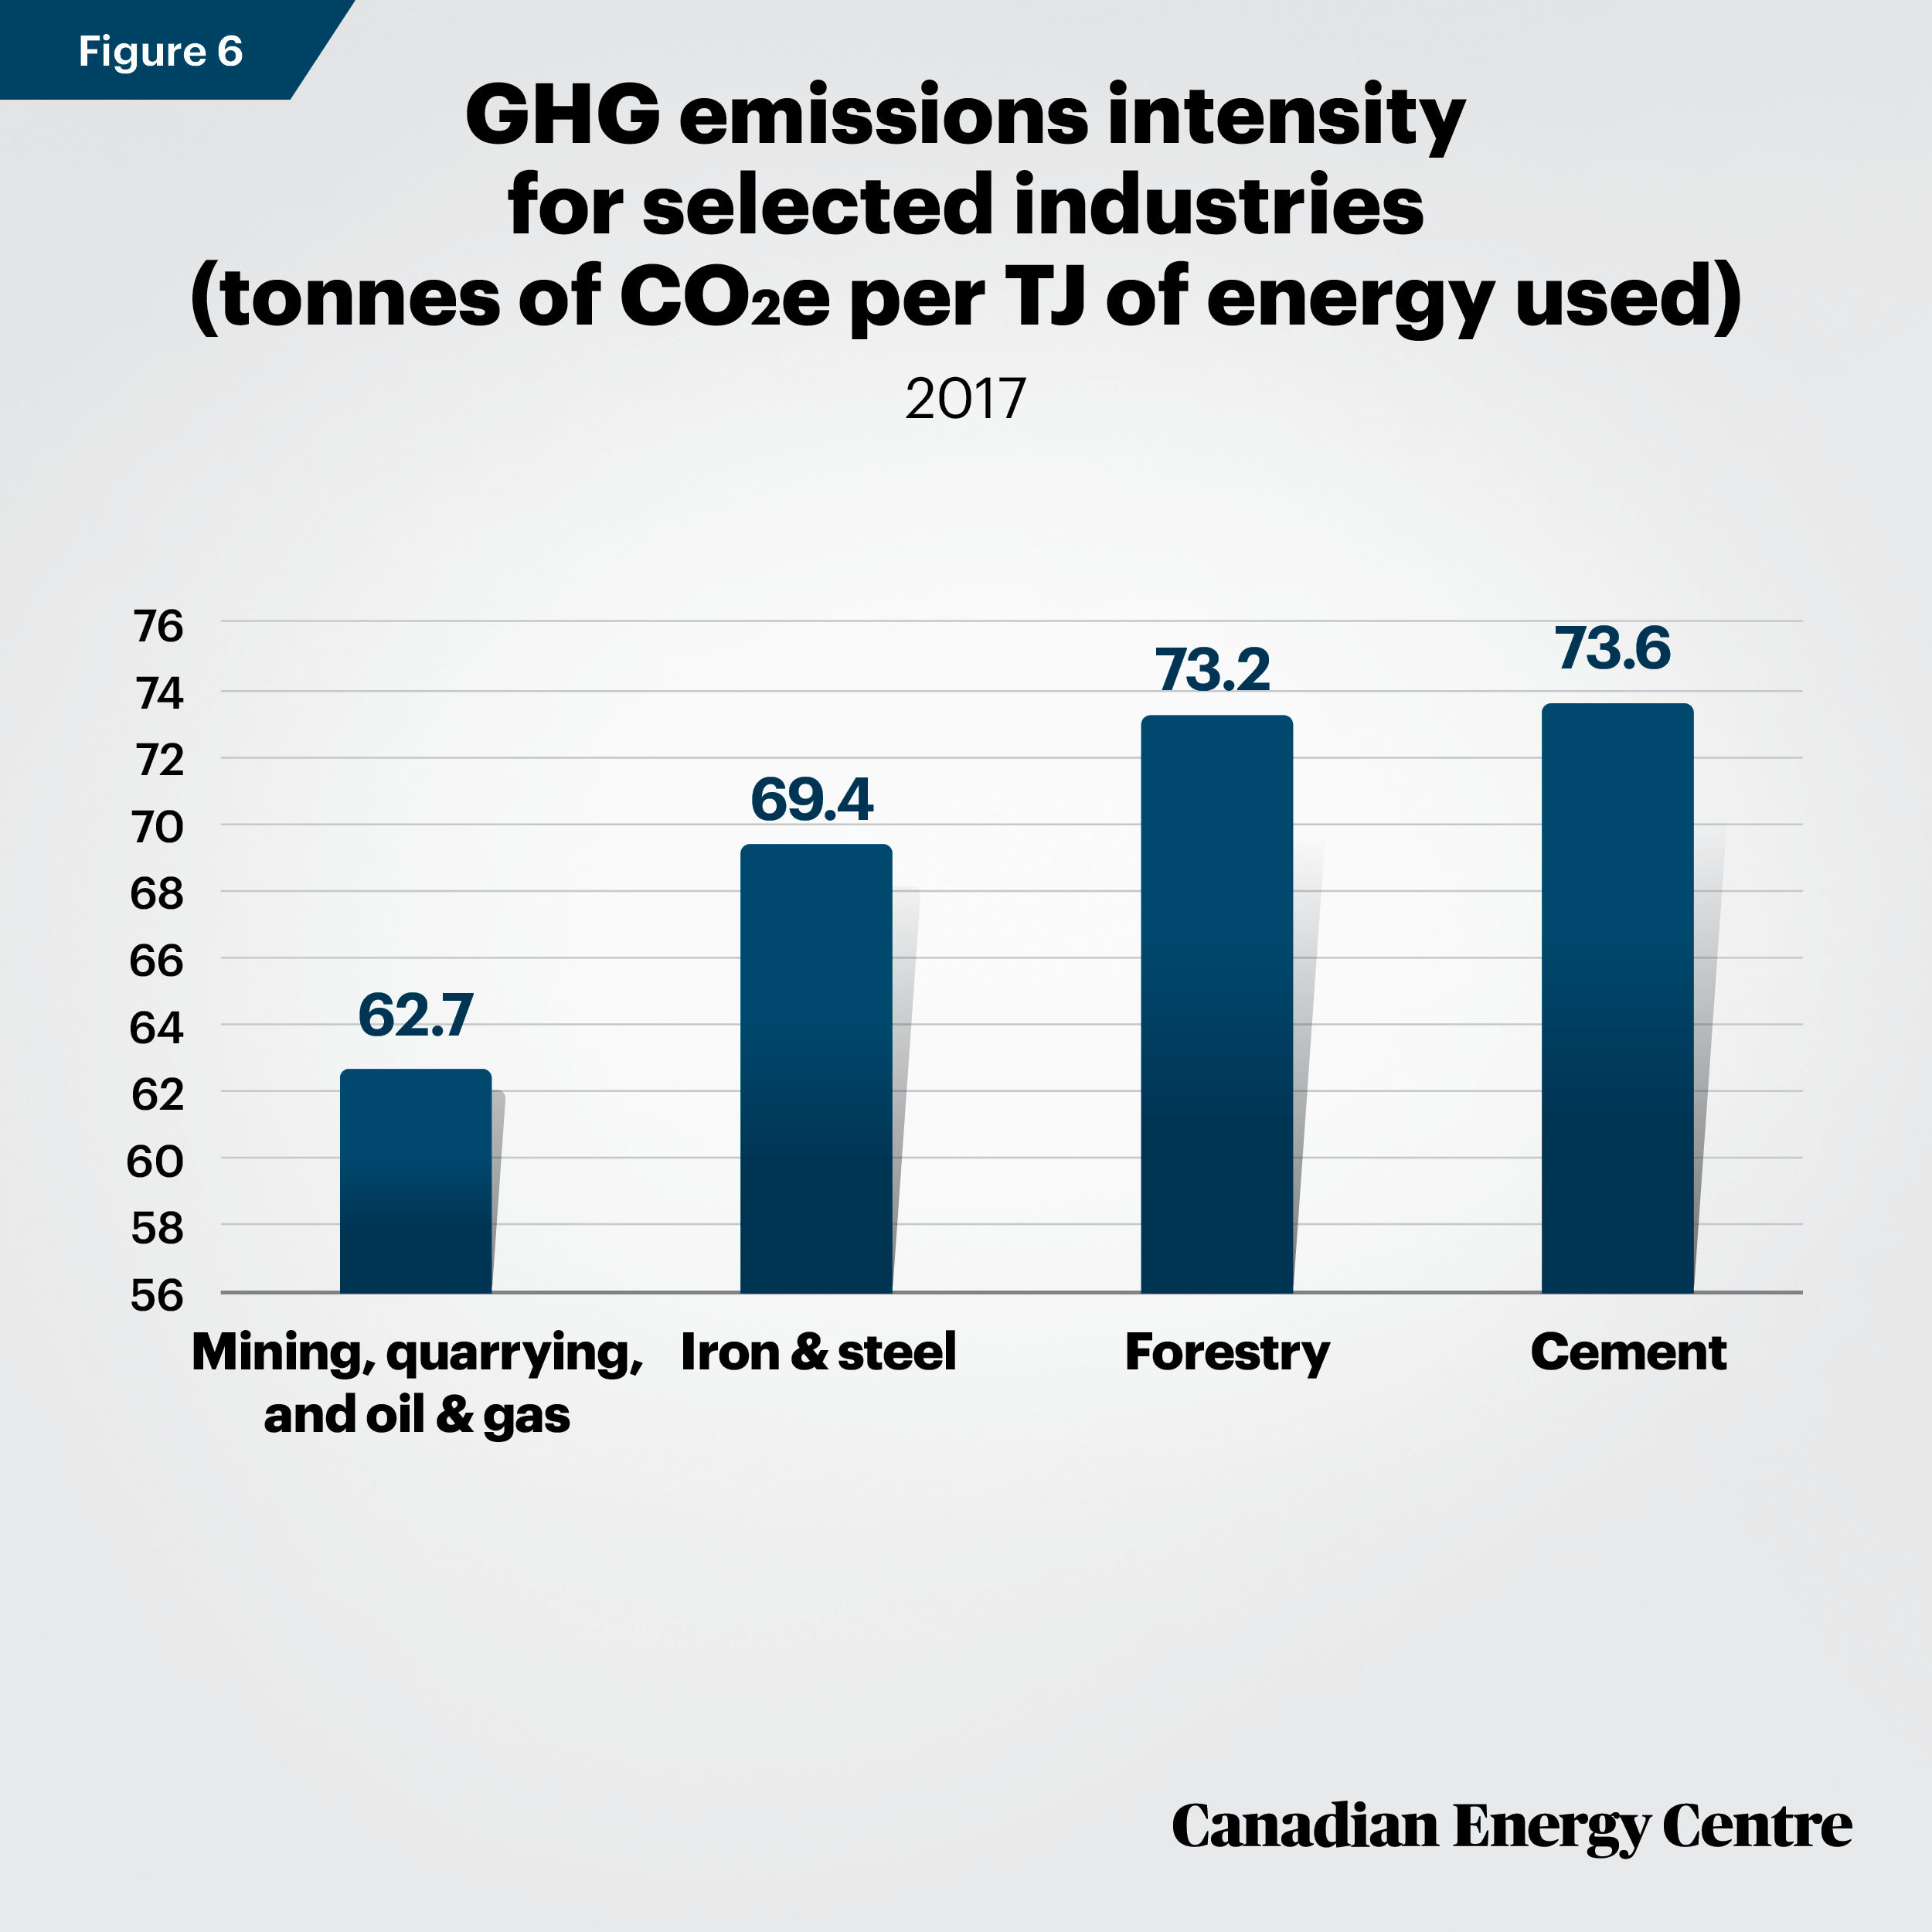
Canada’s mining, quarrying, and oil and gas extraction sector compares favourably with a number of other industrial sectors in Canada
- The current emissions intensity of the Canadian mining, quarrying, and oil and gas extraction sector compares favourably to other industrial sectors in Canada.
- In 2017, the emissions intensity of the mining, quarrying, and oil and gas extraction sector in Canada was 62.7 tonnes
of CO2e per terajoule (TJ) of energy used in extraction. This compares to 69.4 tonnes used in the iron and steel sector, 73.2 tonnes used in the forestry sector and 73.6 tonnes used in the cement sector.
Fuel combustion emissions intensity in Canada’s industrial sector is also falling and is comparable with a number of other energy-producing countries
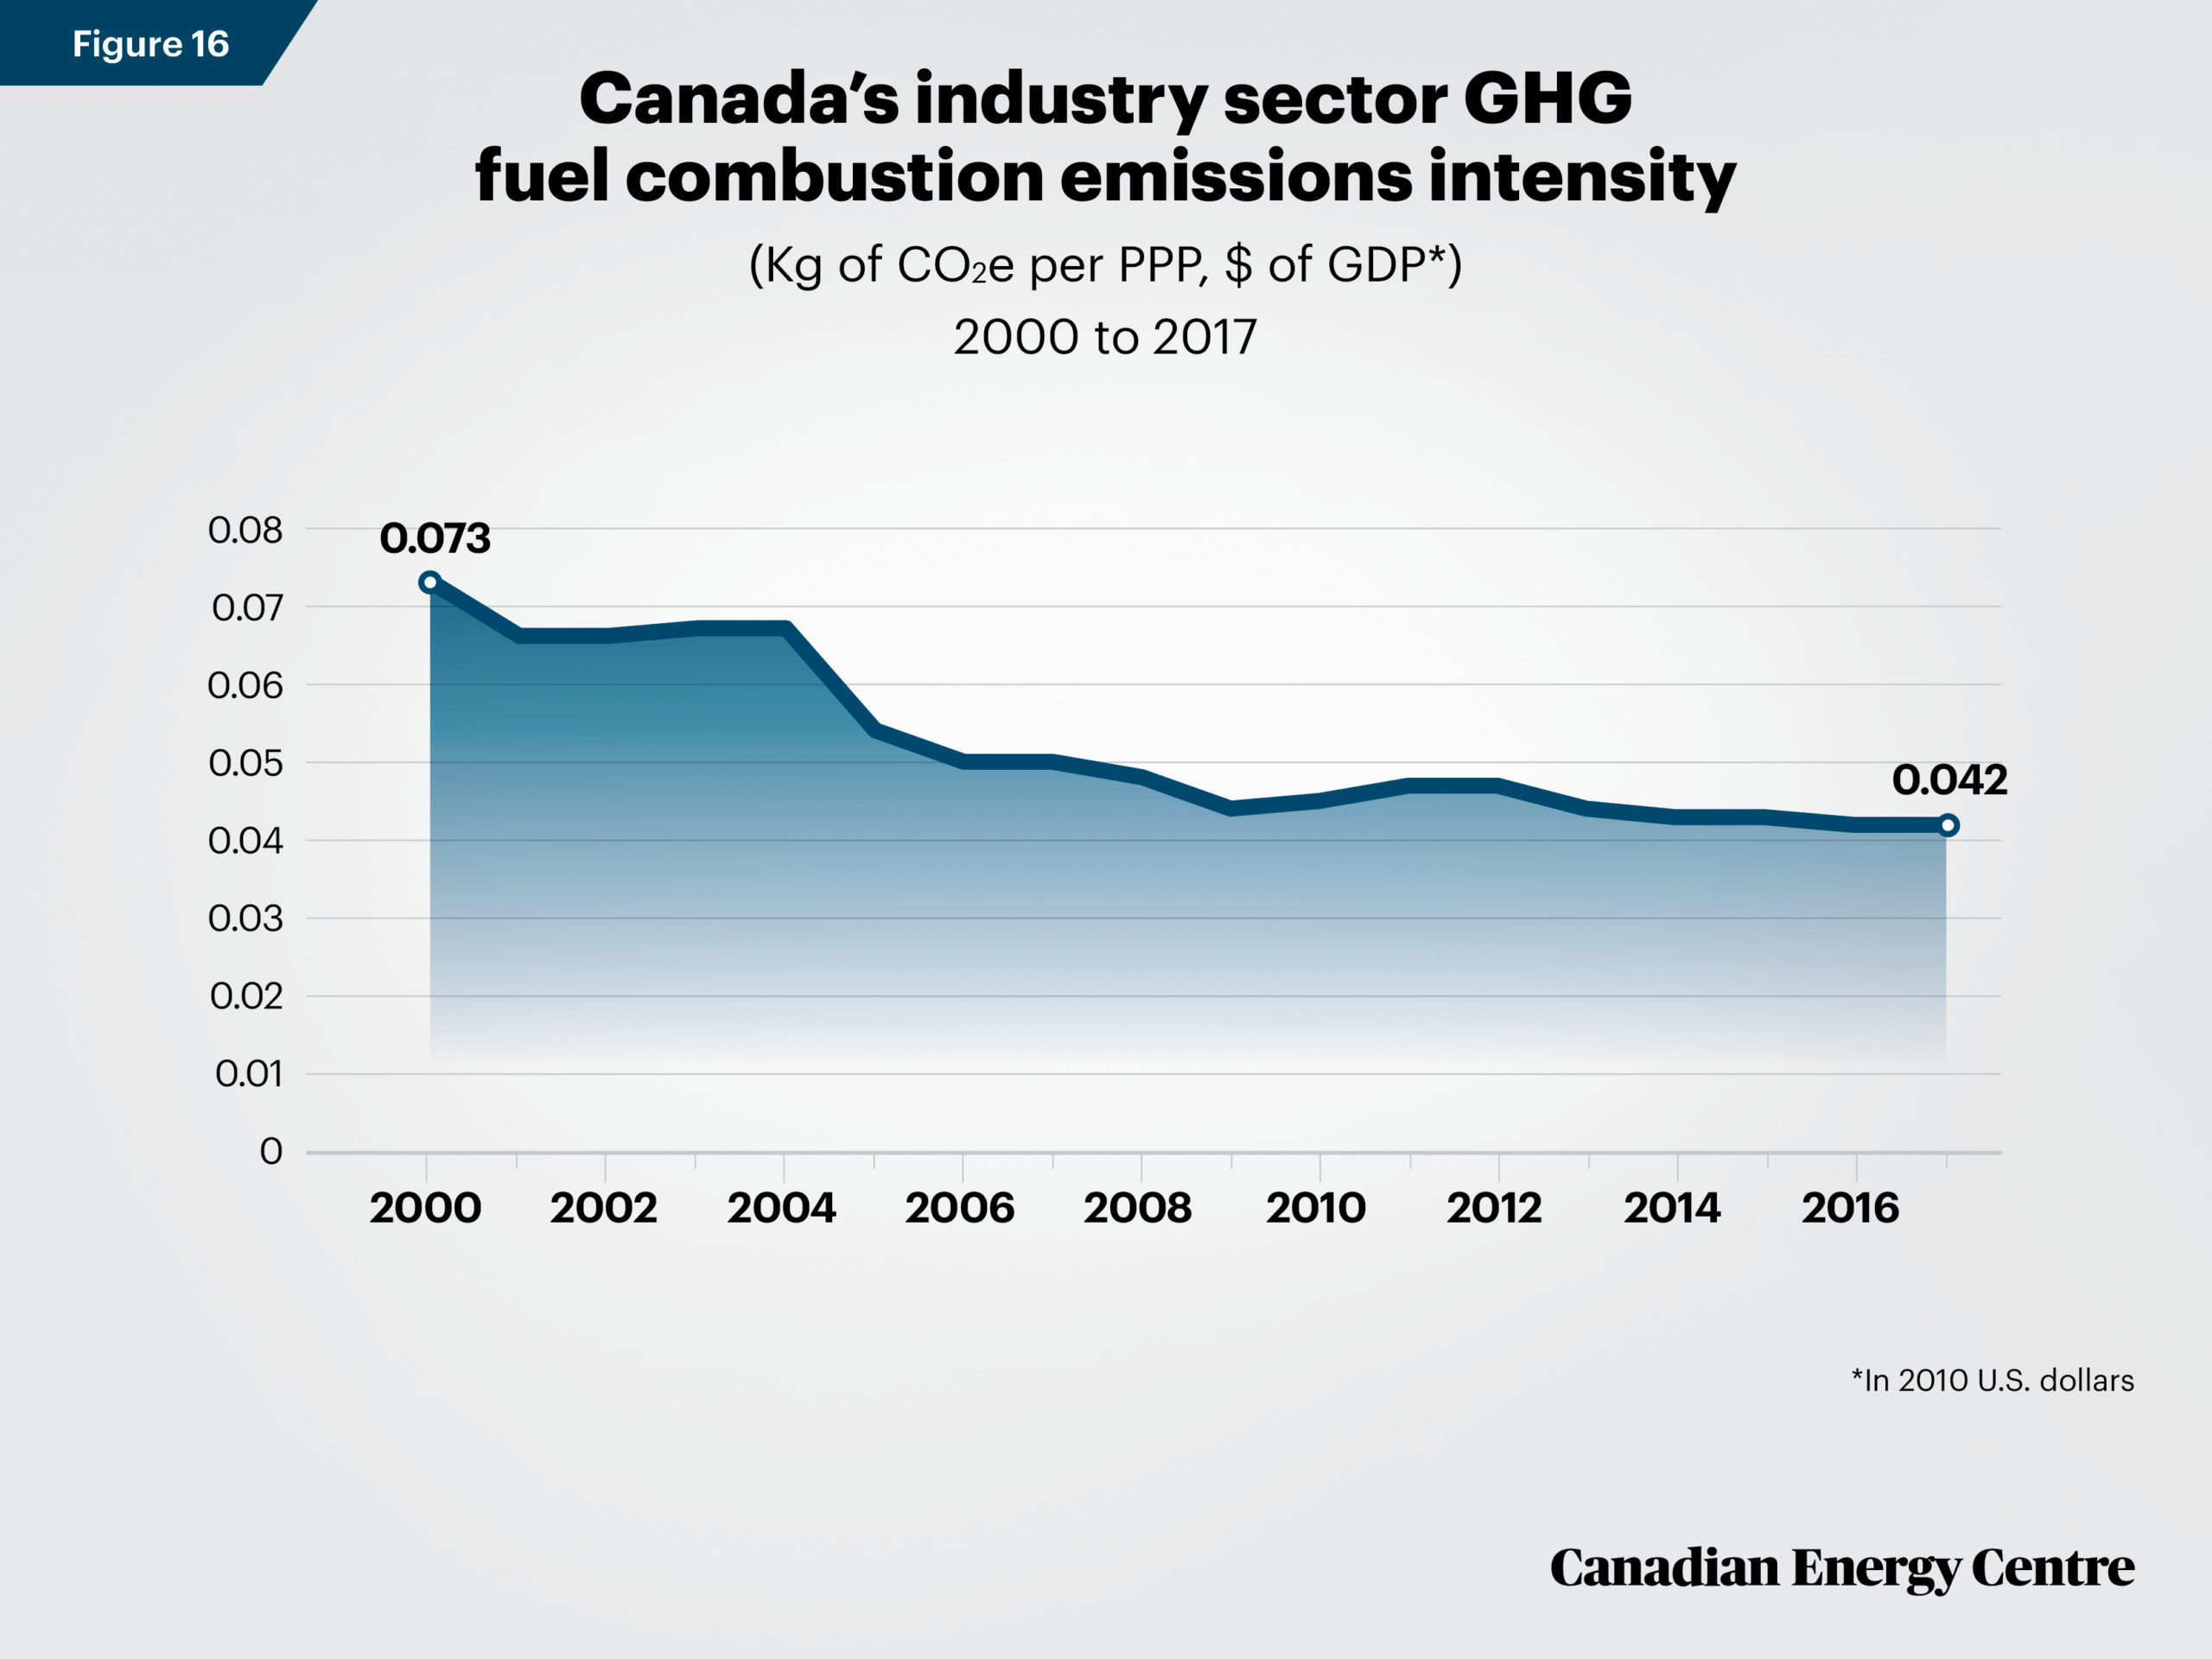
- Between 2000 and 2017, GHG fuel combustion emissions in Canada’s industrial sector fell from 0.073 kg CO2e per purchasing power parity (PPP) in 2010 US dollars of GDP to 0.042 kg, a decline of 42 per cent.
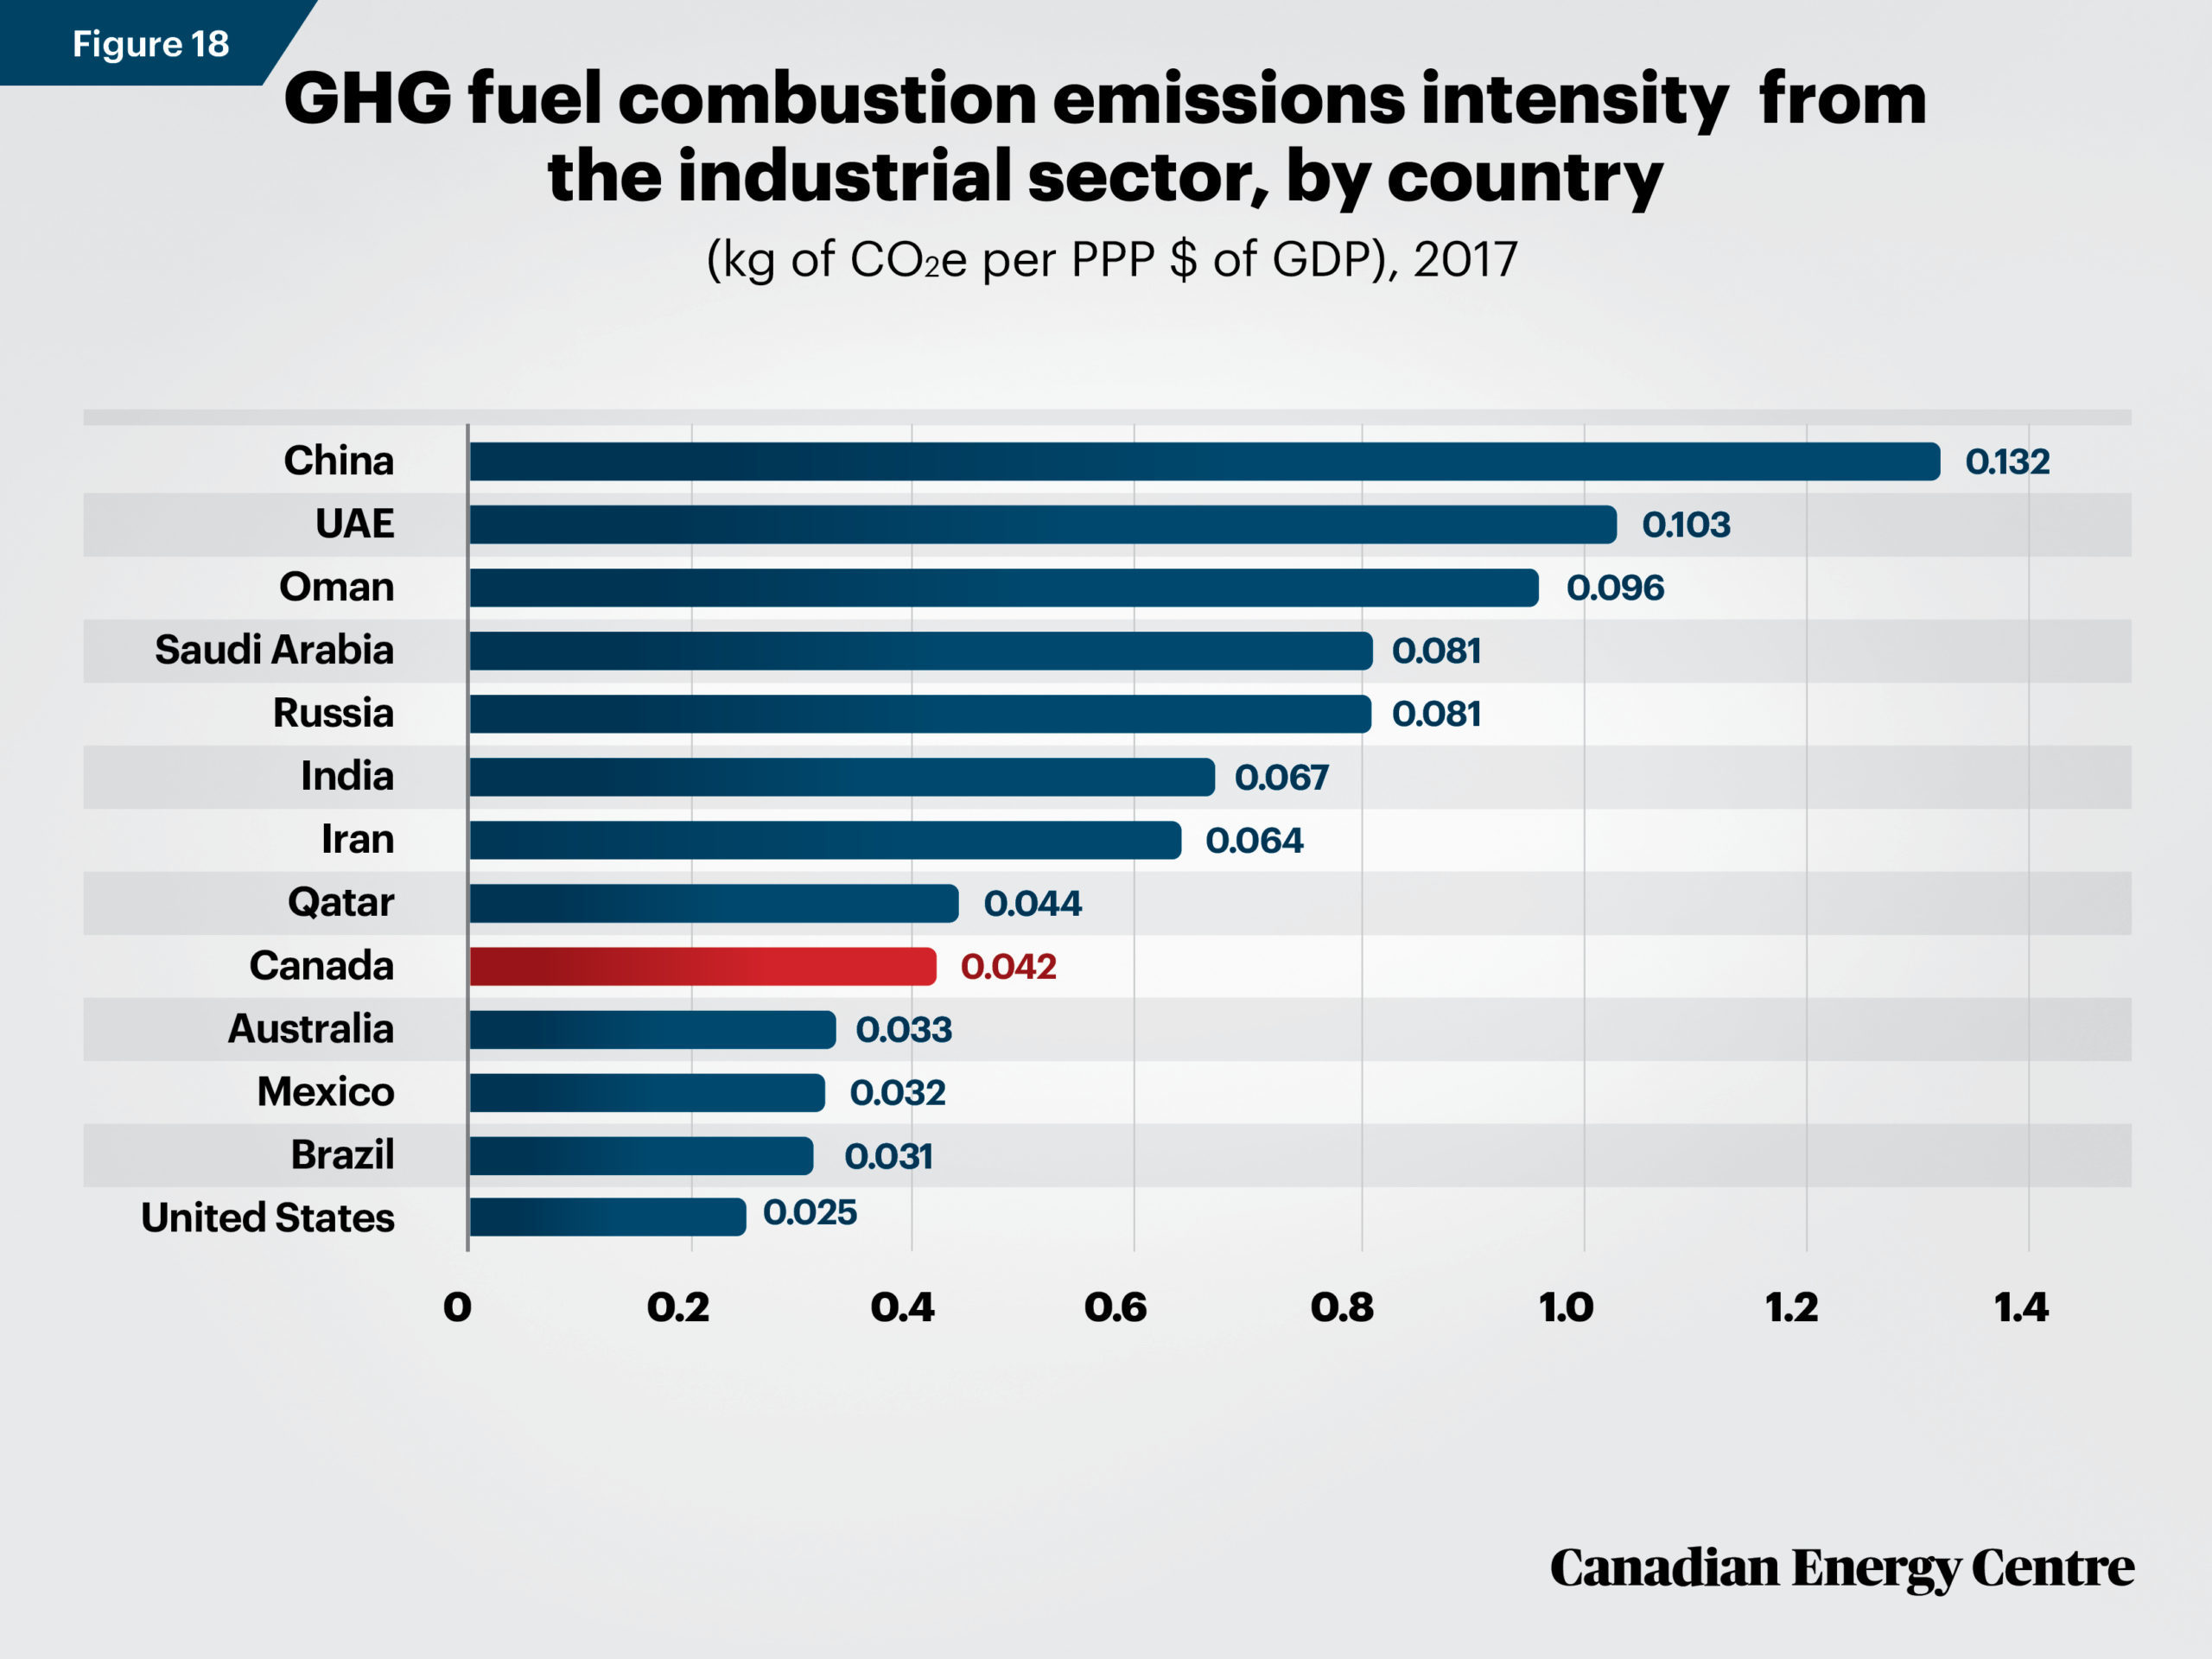
- As of 2017, GHG fuel combustion emissions of 0.042 CO2e per PPP in 2010 US dollars of GDP in Canada’s industrial sector was slightly higher than that in the United States and Australia, but lower than in India, Iran, Japan, Oman, Pakistan, Qatar, Russia, Saudi Arabia, South Africa, United Arab Emirates, and China.
Oil sands emissions intensity has been falling over the past decade
- Between 2011 and 2018, oil sands emissions intensity fell from 0.086 tonnes of CO2e per barrel to 0.067 tonnes of CO2e per barrel, a decline of about 22 per cent.
Oil sands sector will drive future emissions intensity reductions through 2030
- According to IHS Markit, by 2030 the deployment of commercial and near-commercial technologies and efficiencies could result in a 17 to 27 per cent reduction in the GHG intensity of steam-assisted gravity drainage operations (which accounted for 45 per cent of oil sands supply in 2017) and a 15 to 20 per cent reduction in the GHG intensity of mined oil sands. On a full life-cycle basis (inclusive of emissions from production to combustion), these upstream intensities would place steam assisted gravity drainage operations within 2 to 4 per cent and mined oil sands within 5 to 7 per cent of the average crude oil refined in the United States (IHS Markit, 2018).
- The base emissions forecast from BMO Capital Markets implies that average oil sands emissions intensity could improve by at least another 17 per cent, or about 1.7 per cent per year, by 2030.
- Assuming the Canadian mining, quarrying, and oil and gas extraction sector uses promising emerging technologies, BMO Capital Markets anticipates average emissions intensity will improve another 25 to 30 per cent overall by 2040, to about 55 kg per barrel.
Analysis
Part I: Evaluating GHG Emissions Intensity Trends in Canada
Canada’s emissions levels are small on a worldwide basis
Canada’s contribution to worldwide greenhouse gas (GHG) emissions is small compared to other key energy-producing and consuming countries. As of 2016, Canada’s greenhouse gas emissions were 779 Mt of CO2e, comprising just 1.6 per cent of worldwide GHG emissions of 49,358 megatonnes (MT). This puts Canada’s emissions levels just above those of Australia (1.0 per cent) and well below those of Russia (4.8 per cent), the United States (11.7 per cent), and China (23.2 per cent), with remaining countries at 38.5 per cent (see Figure 1) (World Resource Institute, 2020).
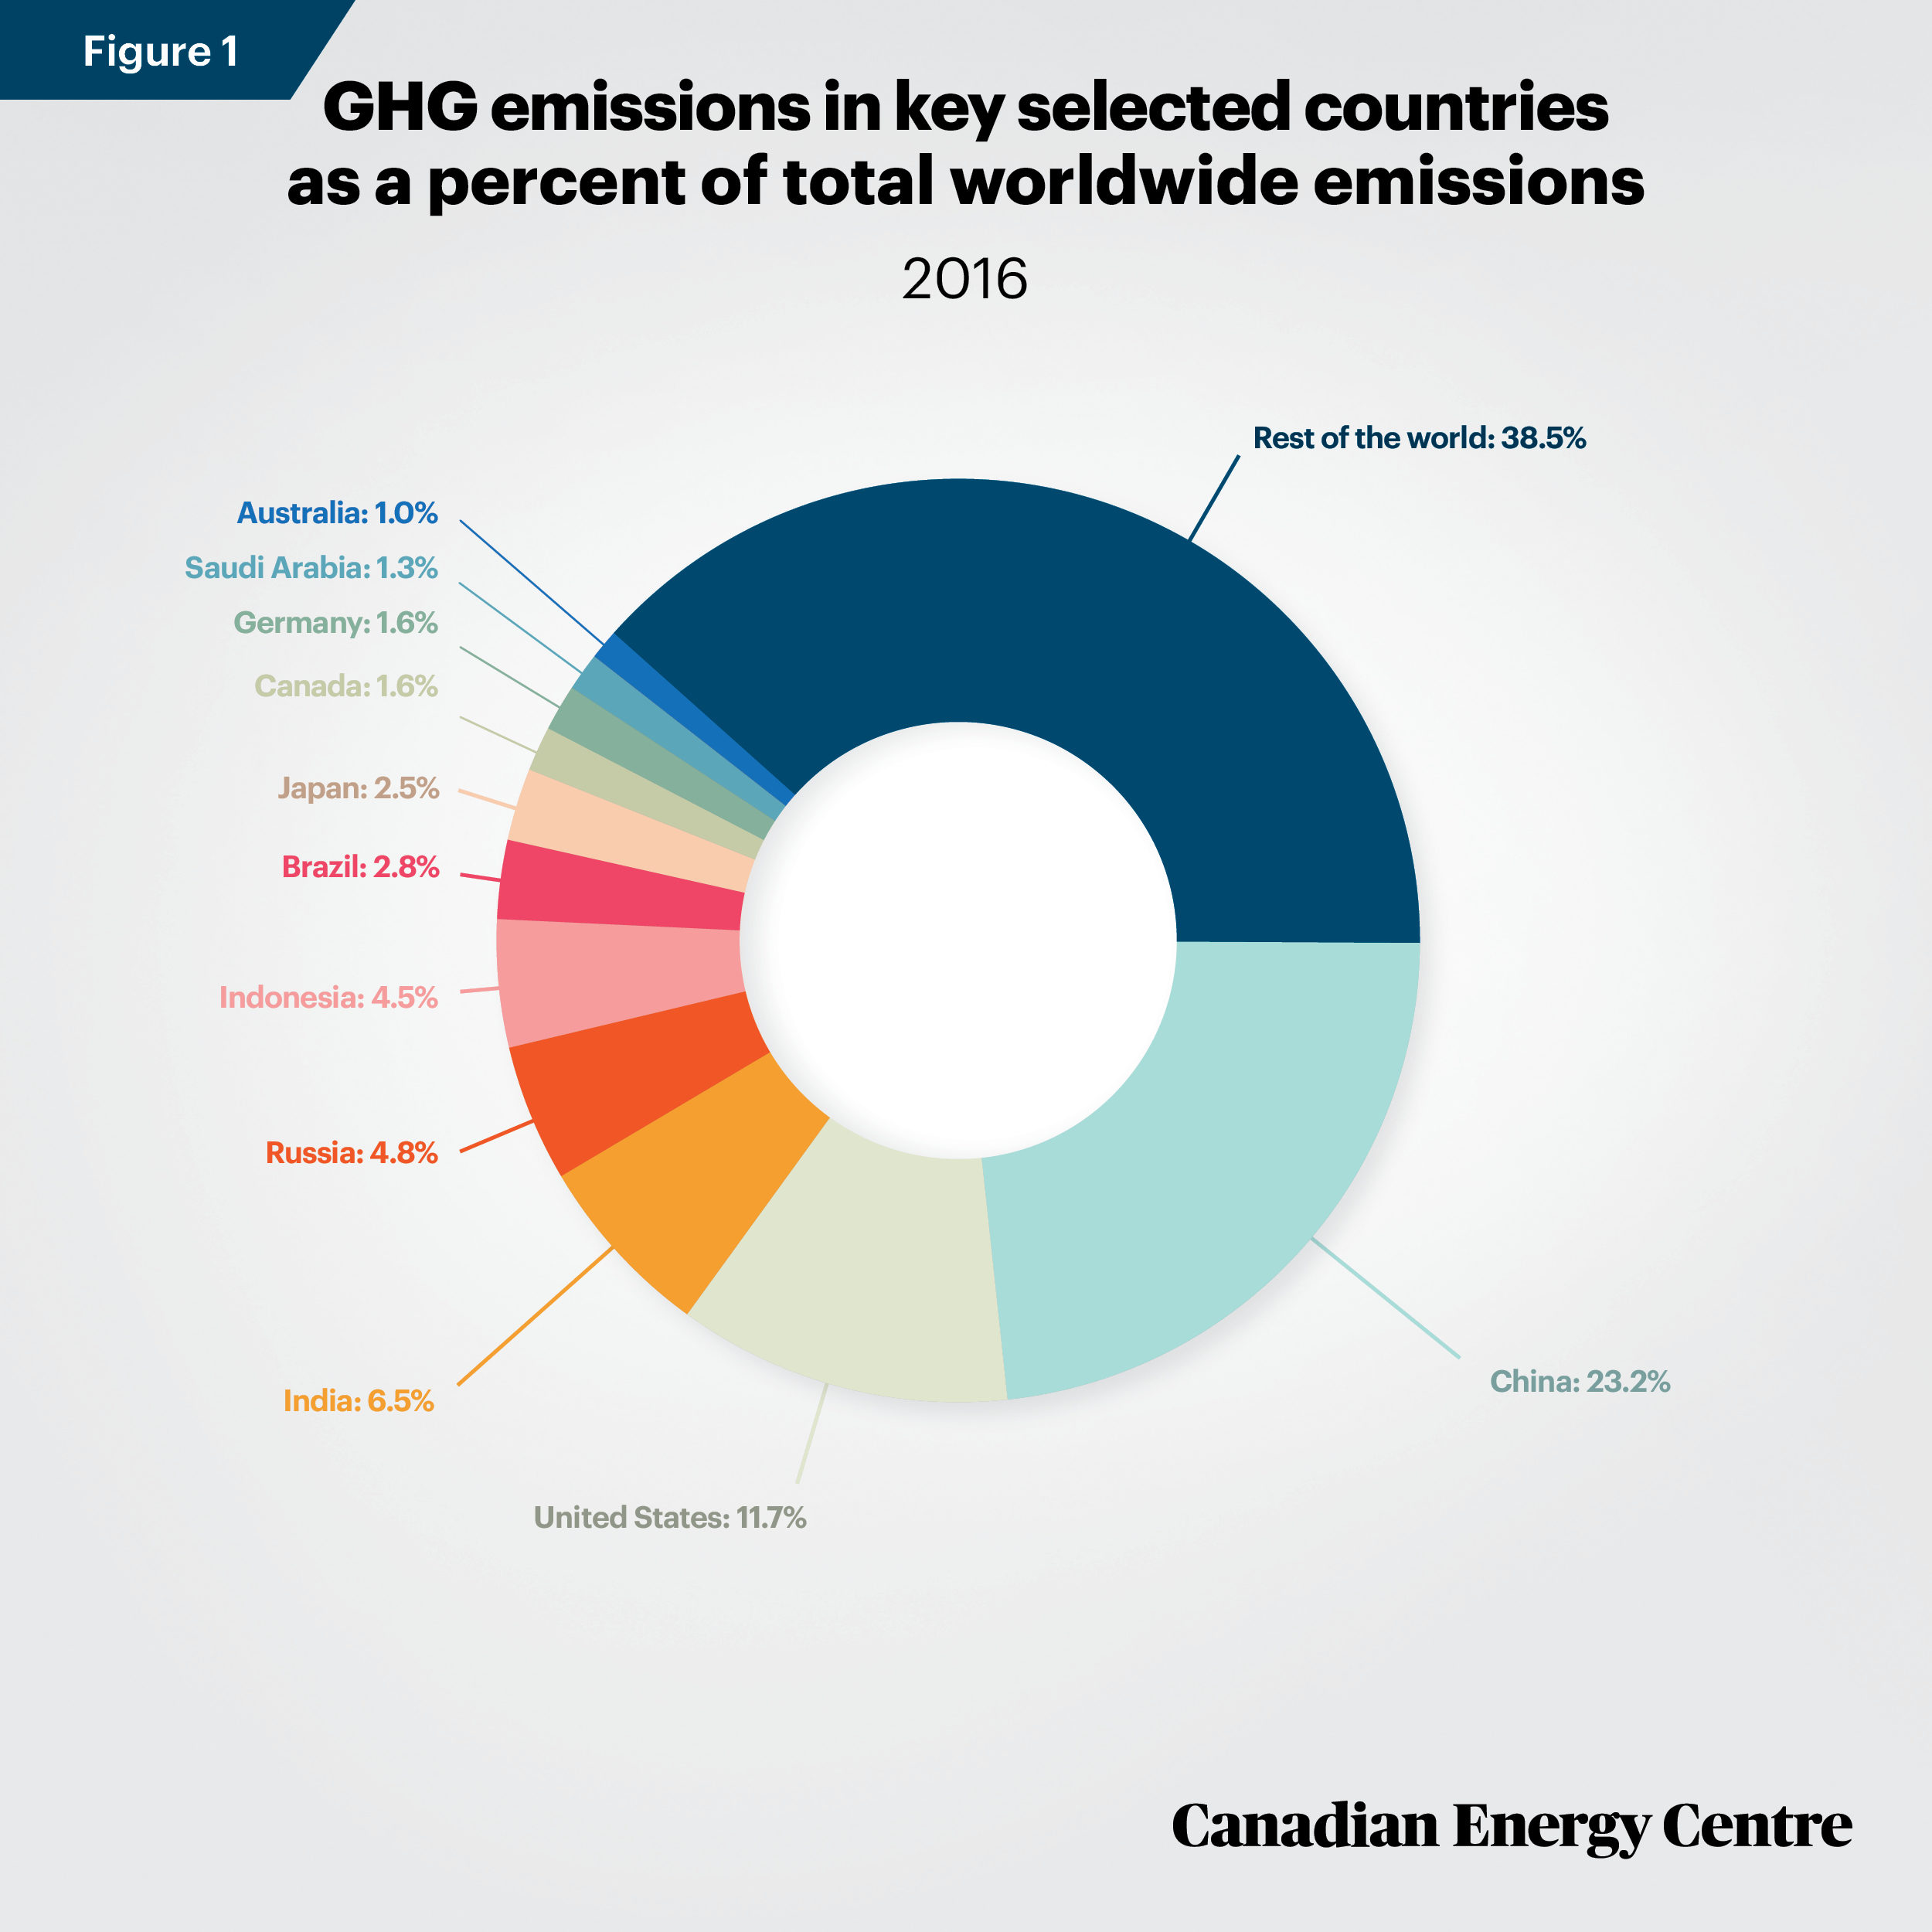
Source: World Resources Institute (2020).
According to a March 2020 report by Bank of Montreal (BMO) Capital Markets, Canada’s oil and gas sector accounts for just 0.3 per cent of global GHG emissions, while the oil sands subsector itself accounts for just 0.1 per cent of global emissions (see Figure 2) (BMO Capital Markets, 2020).
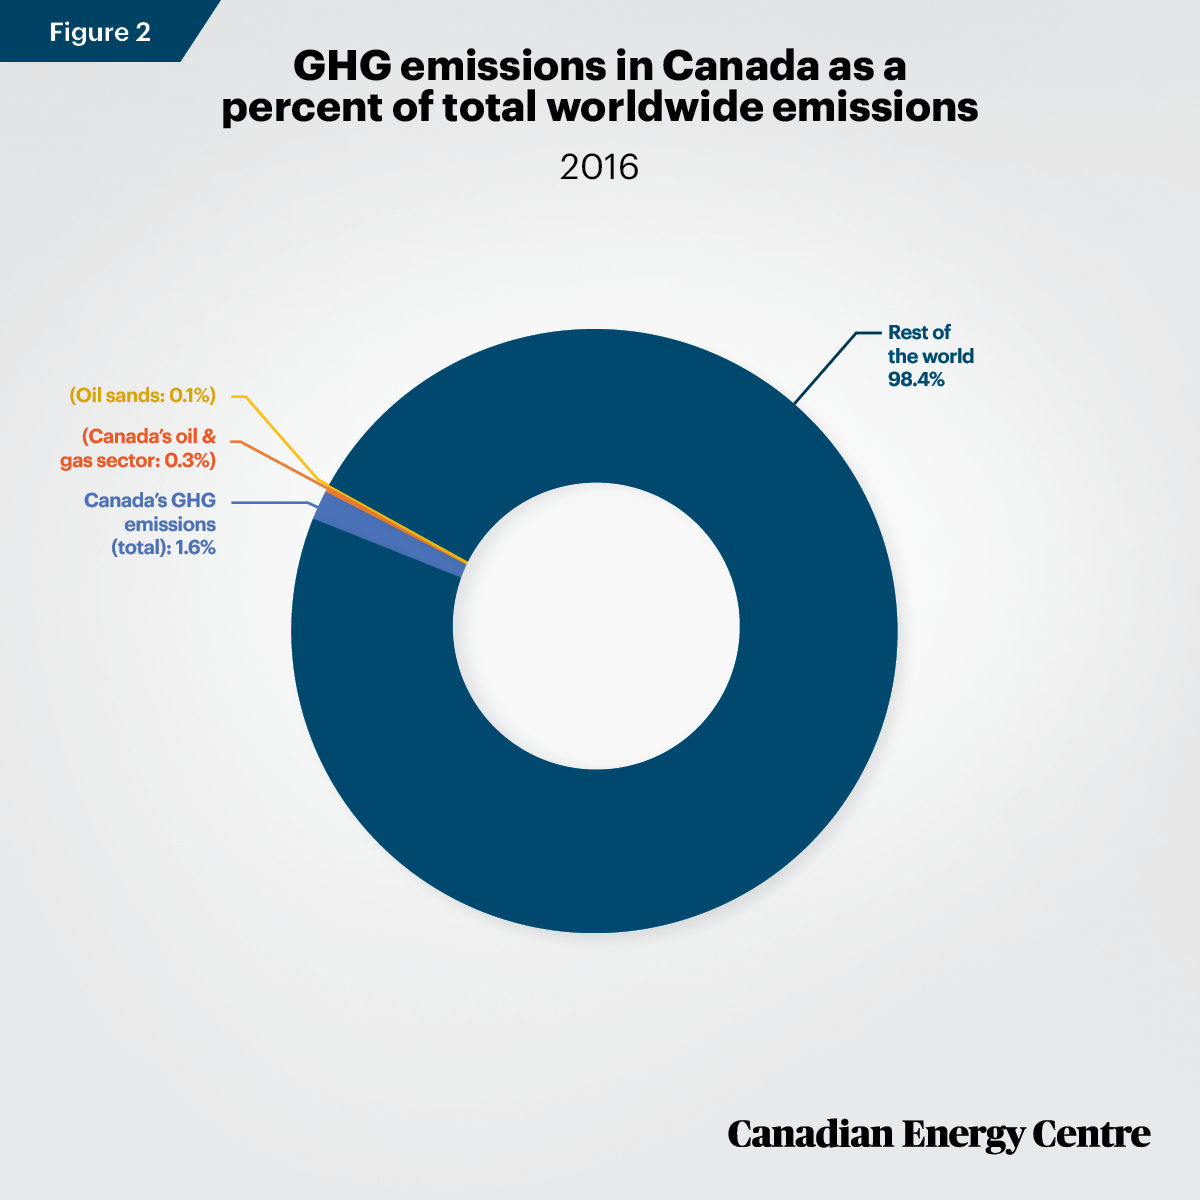
Sources: World Resources Institute (2020) and BMO Capital Markets (2020).
Canada’s emissions intensity per unit of GDP: Falling
Canada’s GHG emissions per unit of GDP have been in decline over the past two decades.
Between 2000 and 2018, GHG emissions in Canada fell from 0.5 MT of CO2e per billion dollars of GDP to 0.35 MT, a decline of 30 per cent (see Figure 3) (Environment and Climate Change Canada, 2020; Statistics Canada, 2020a).
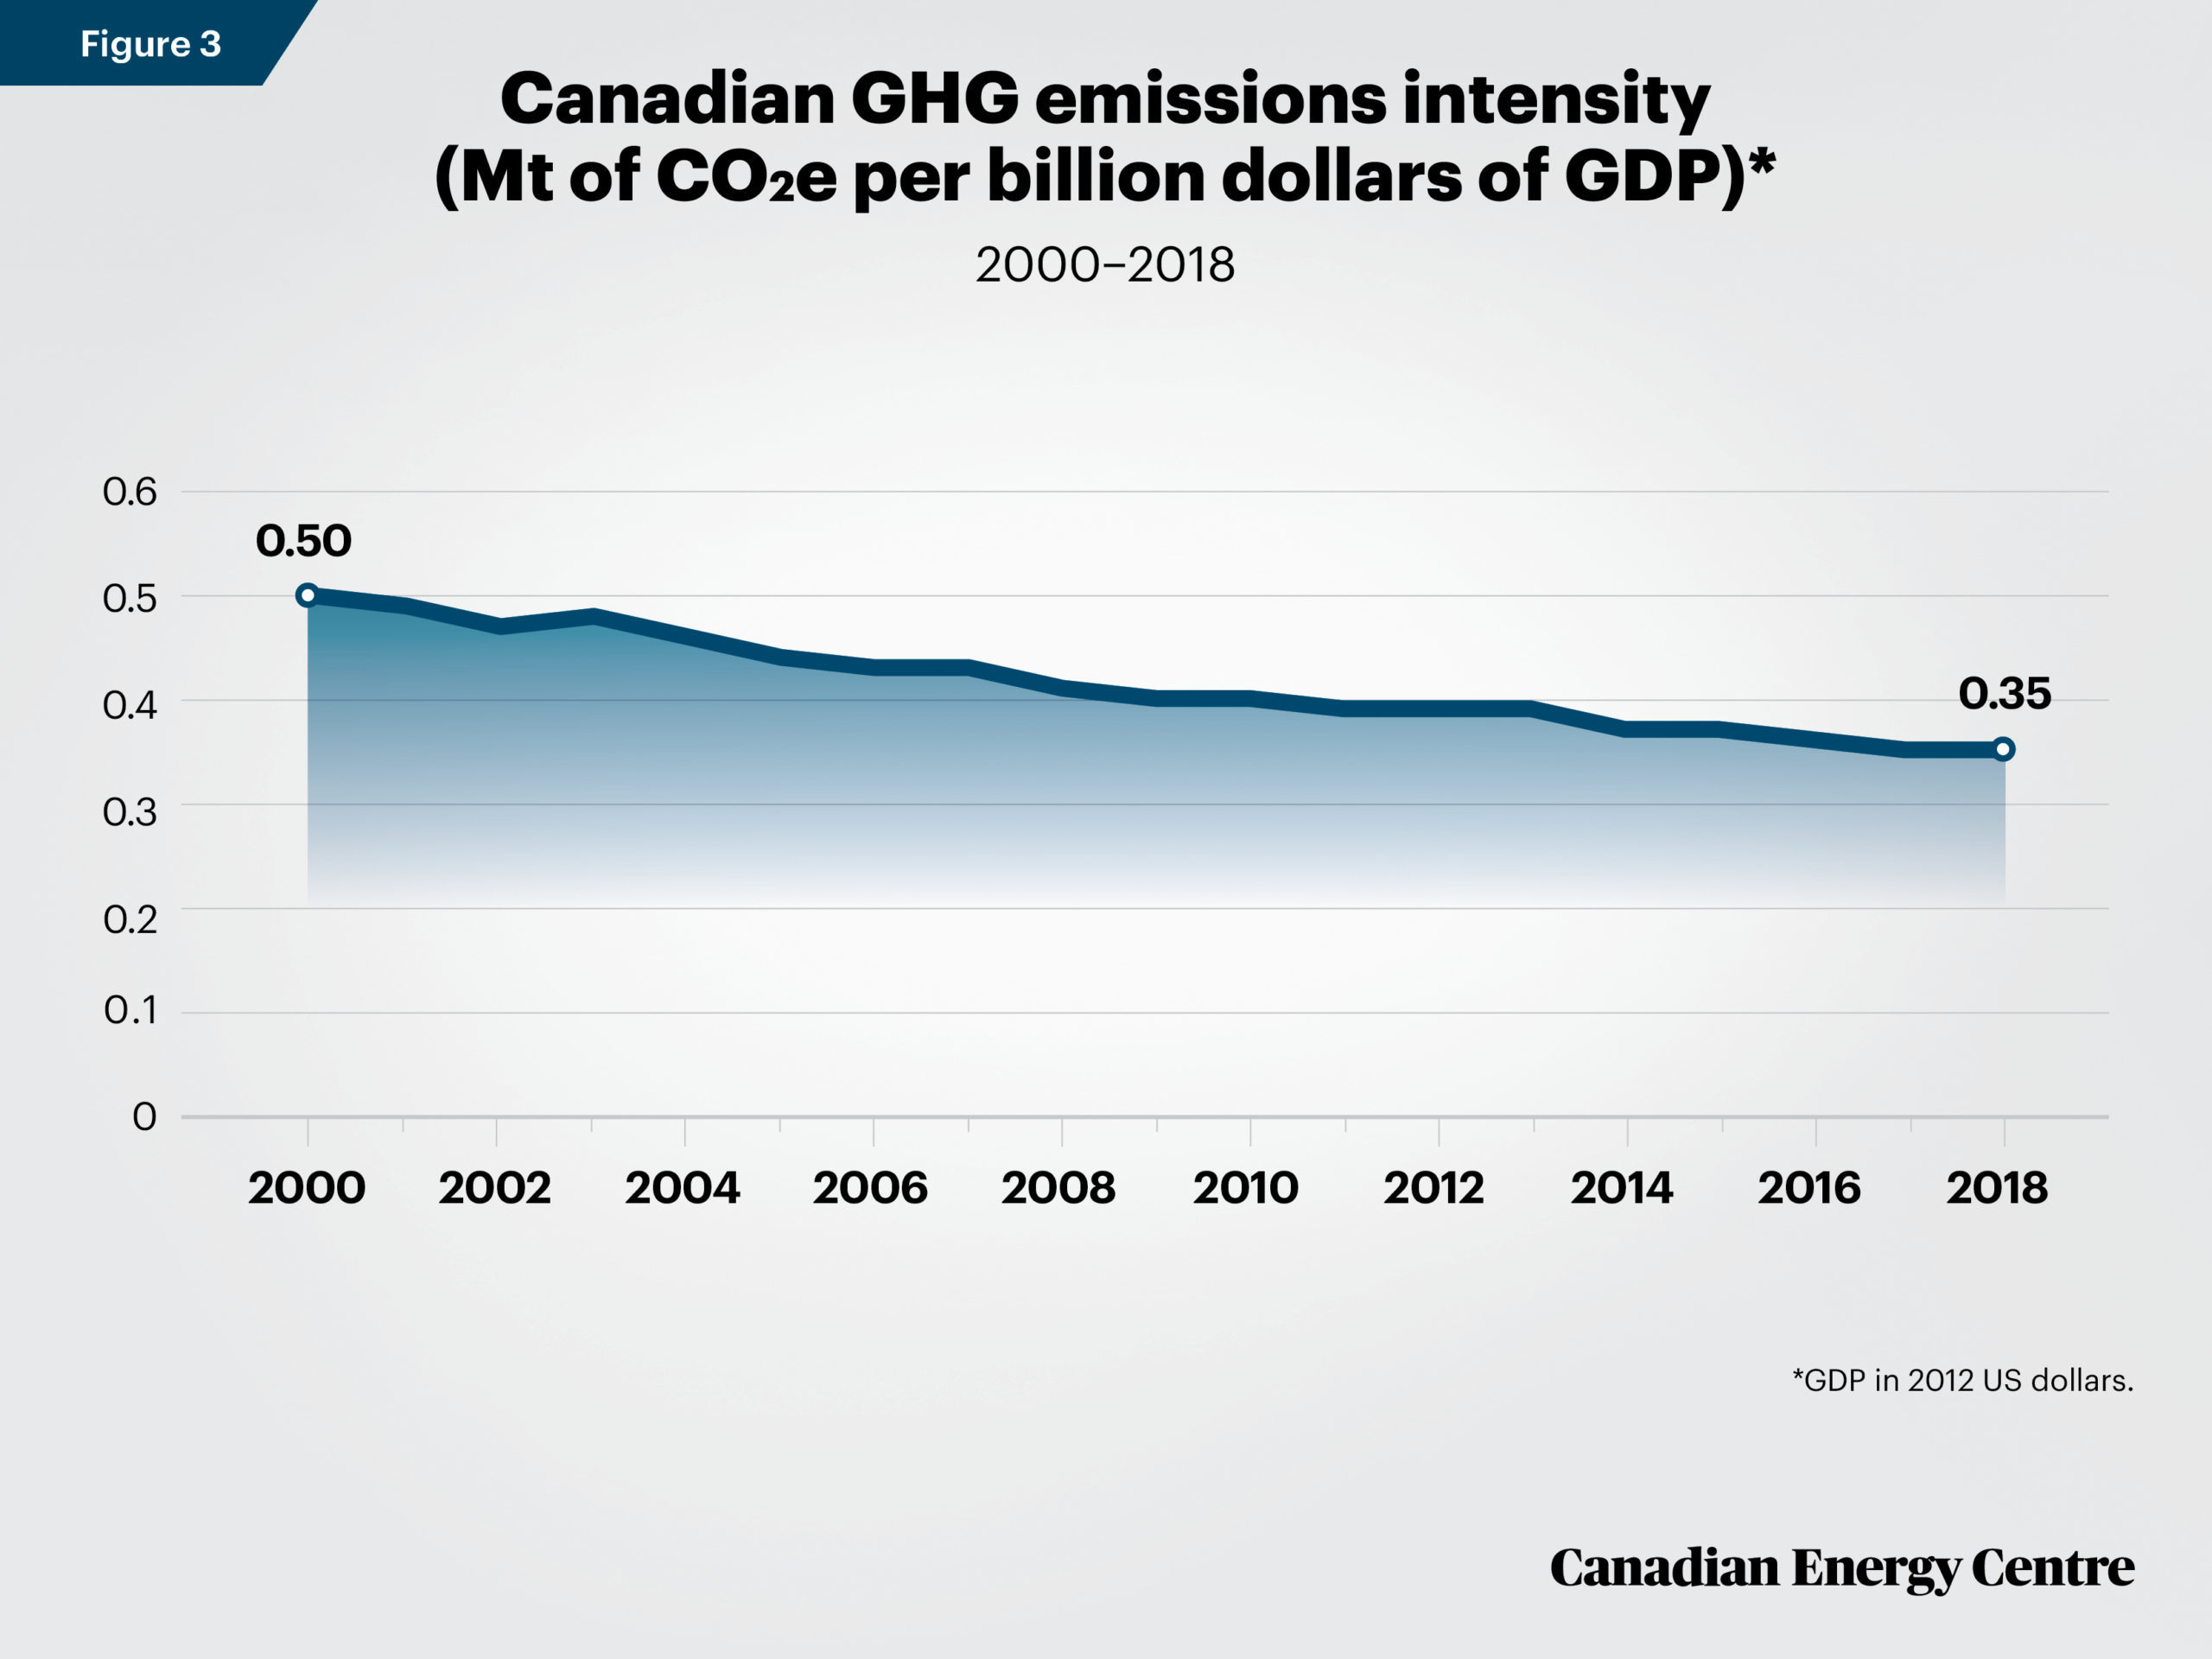
Source: Environment and Climate Change Canada (2020).
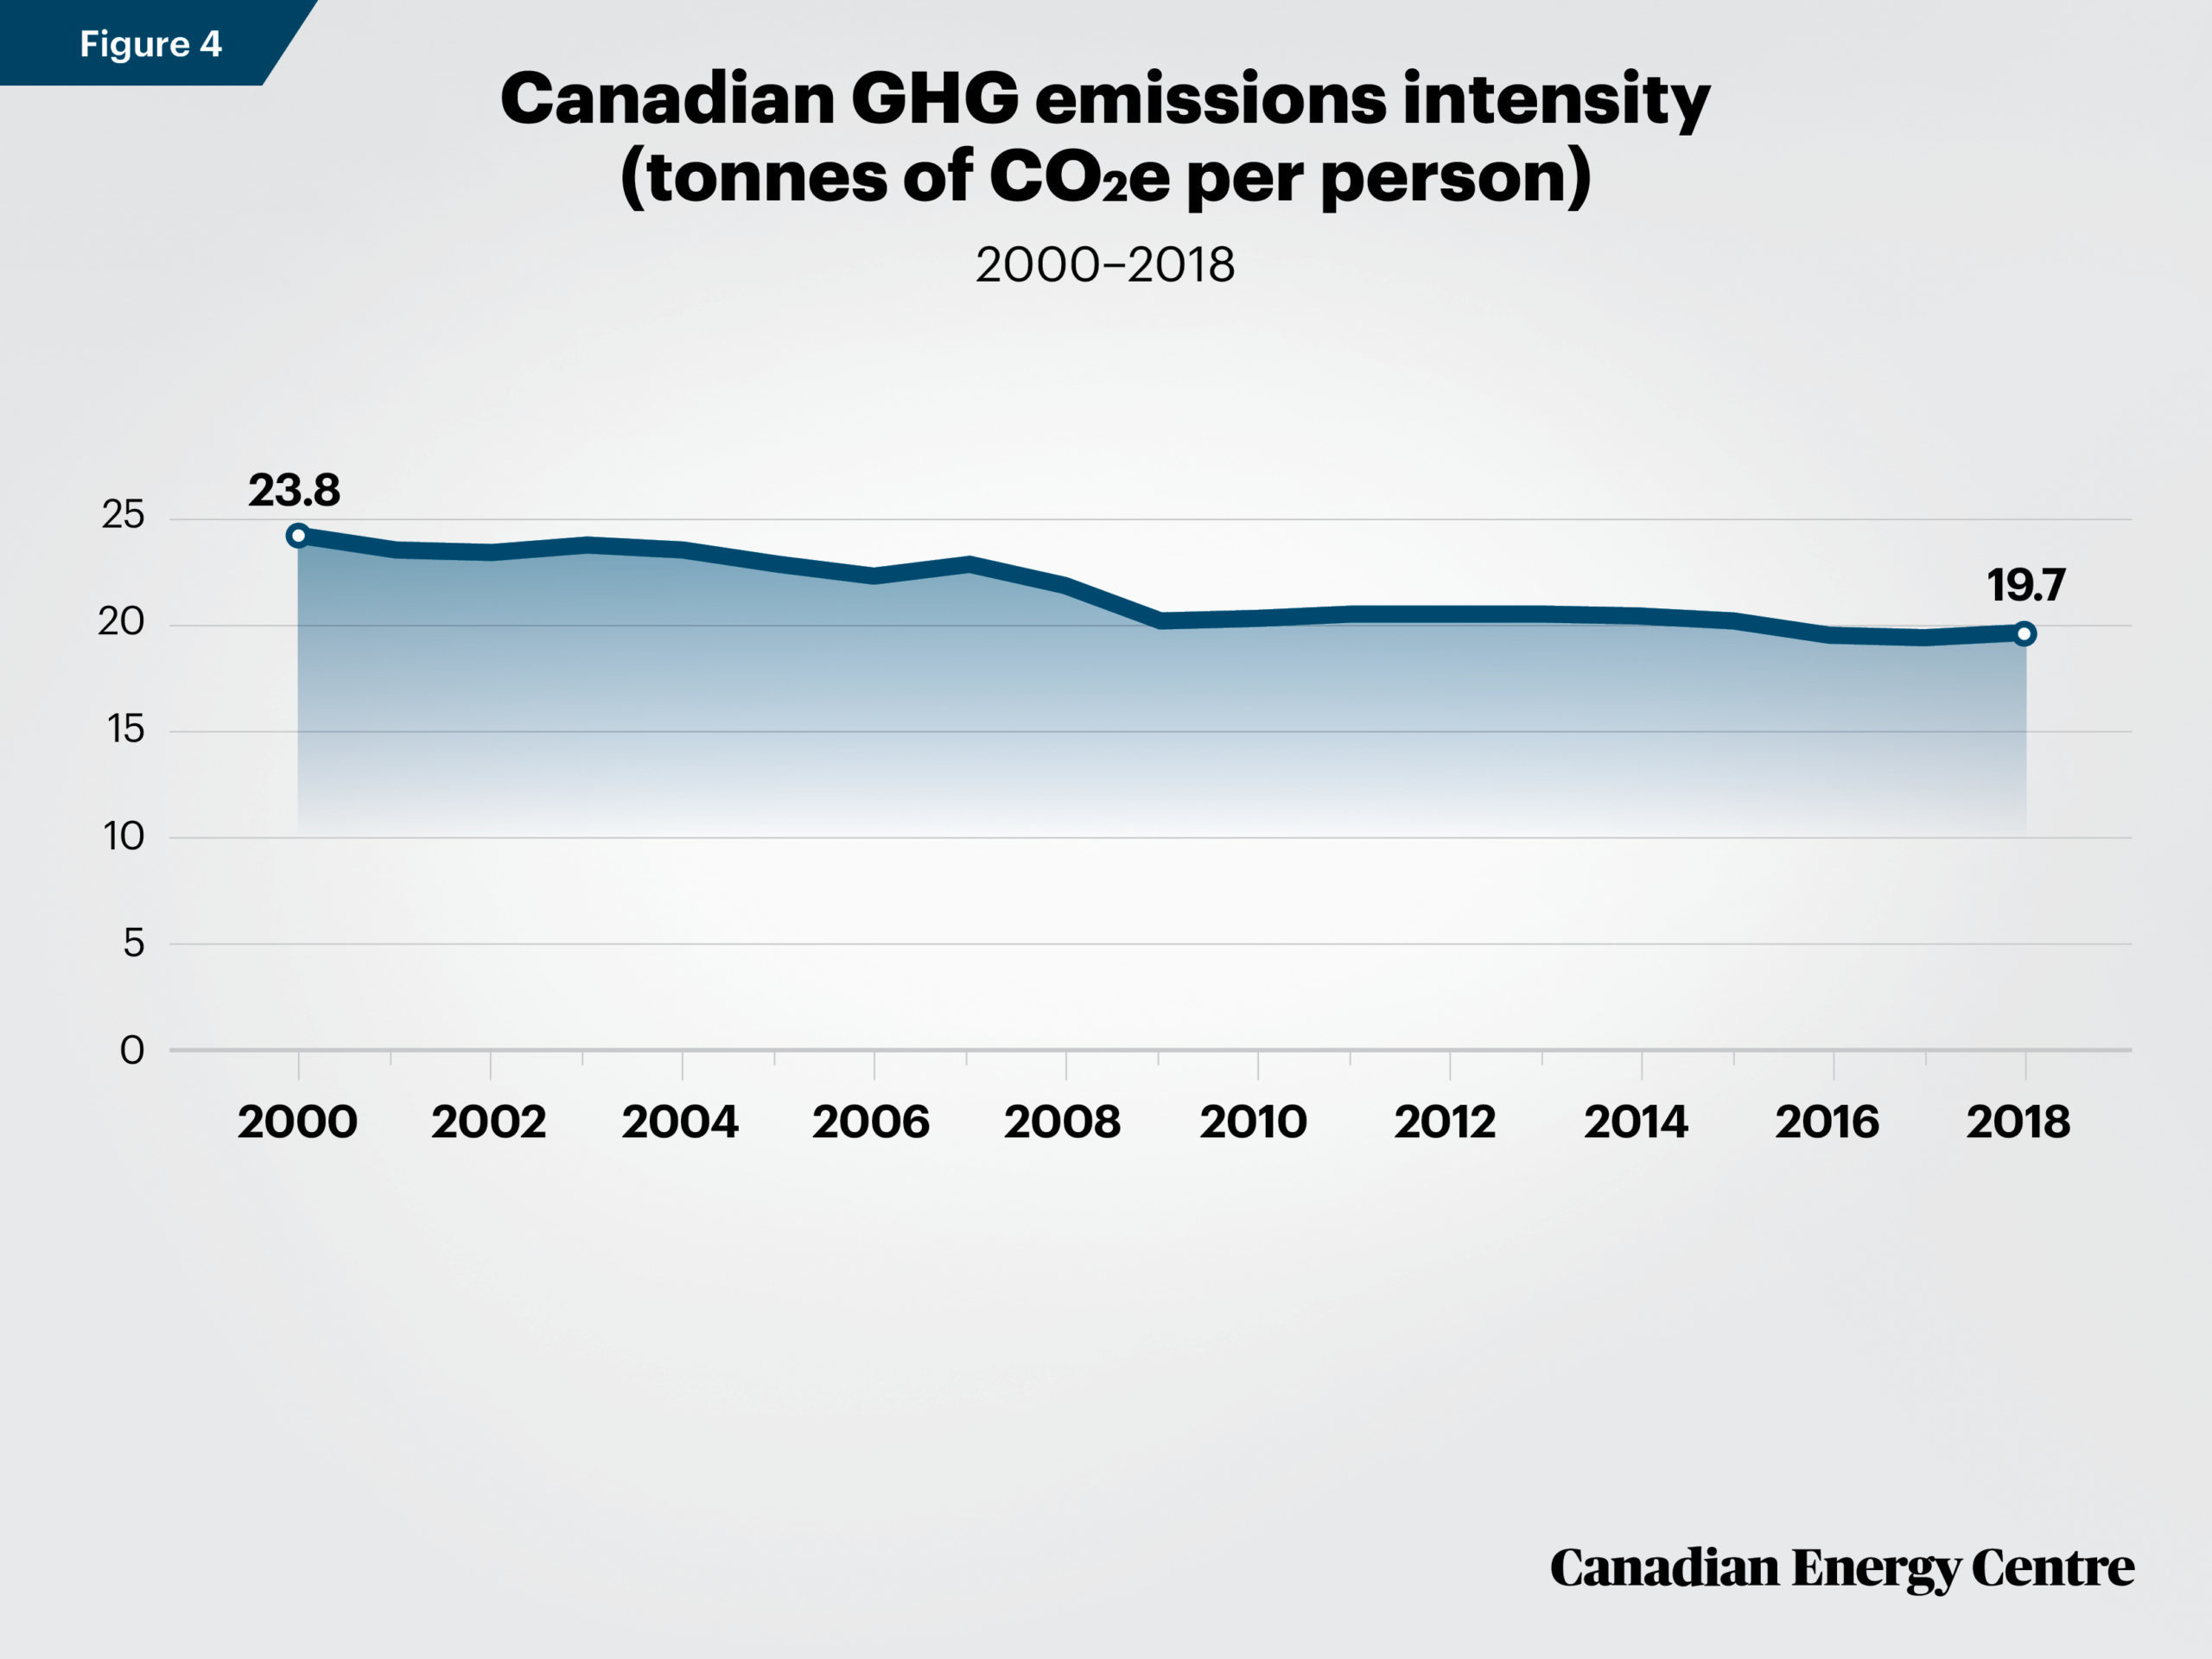
Canada’s GHG emissions intensity per person from 2000 to 2018: Falling
Between 2000 and 2018, GHG emissions in Canada fell from 23.8 tonnes of CO2e per person to 19.7 tonnes, a decline of 17 per cent (see figure 4) (Environment and Climate Change Canada 2020; Statistics Canada 2020b).
According to Environment and Climate Change Canada (ECCC), decreases in Canada in emissions per unit of GDP and per person are the result of a number of factors, most notably more efficient industrial processes and technological improvements that have contributed to decreases in emissions intensity per unit of GDP (Environment and Climate Change Canada, 2020b).
Source: Environment and Climate Change Canada (2020).
Comparing Canada’s per capita GHG emissions to other countries, 2000 to 2016
The latest year for which per capita international emissions data are available is 2016. They reveal that between 2000 and 2016, Canada’s GHG emissions intensity fell from 23.8 tonnes of CO2e per capita to 21.6 tonnes of CO2e per capita, a decline of over 9 per cent. By comparison, GHG emissions expressed as tonnes of CO2e per capita fell by nearly 22 per cent in the United States, dropped 23 per cent in the United Arab Emirates, and fell 33 per cent in Australia. Meanwhile, over the same period emissions intensity per capita increased by 5 per cent in Saudi Arabia (World Resource Institute 2020).
In 2016, GHG emissions per capita in Canada (21.6 tonnes of CO2e) were nearly the same as in Australia and Saudi Arabia, lower than in Qatar, and higher than in the United States (World Resource Institute 2020).
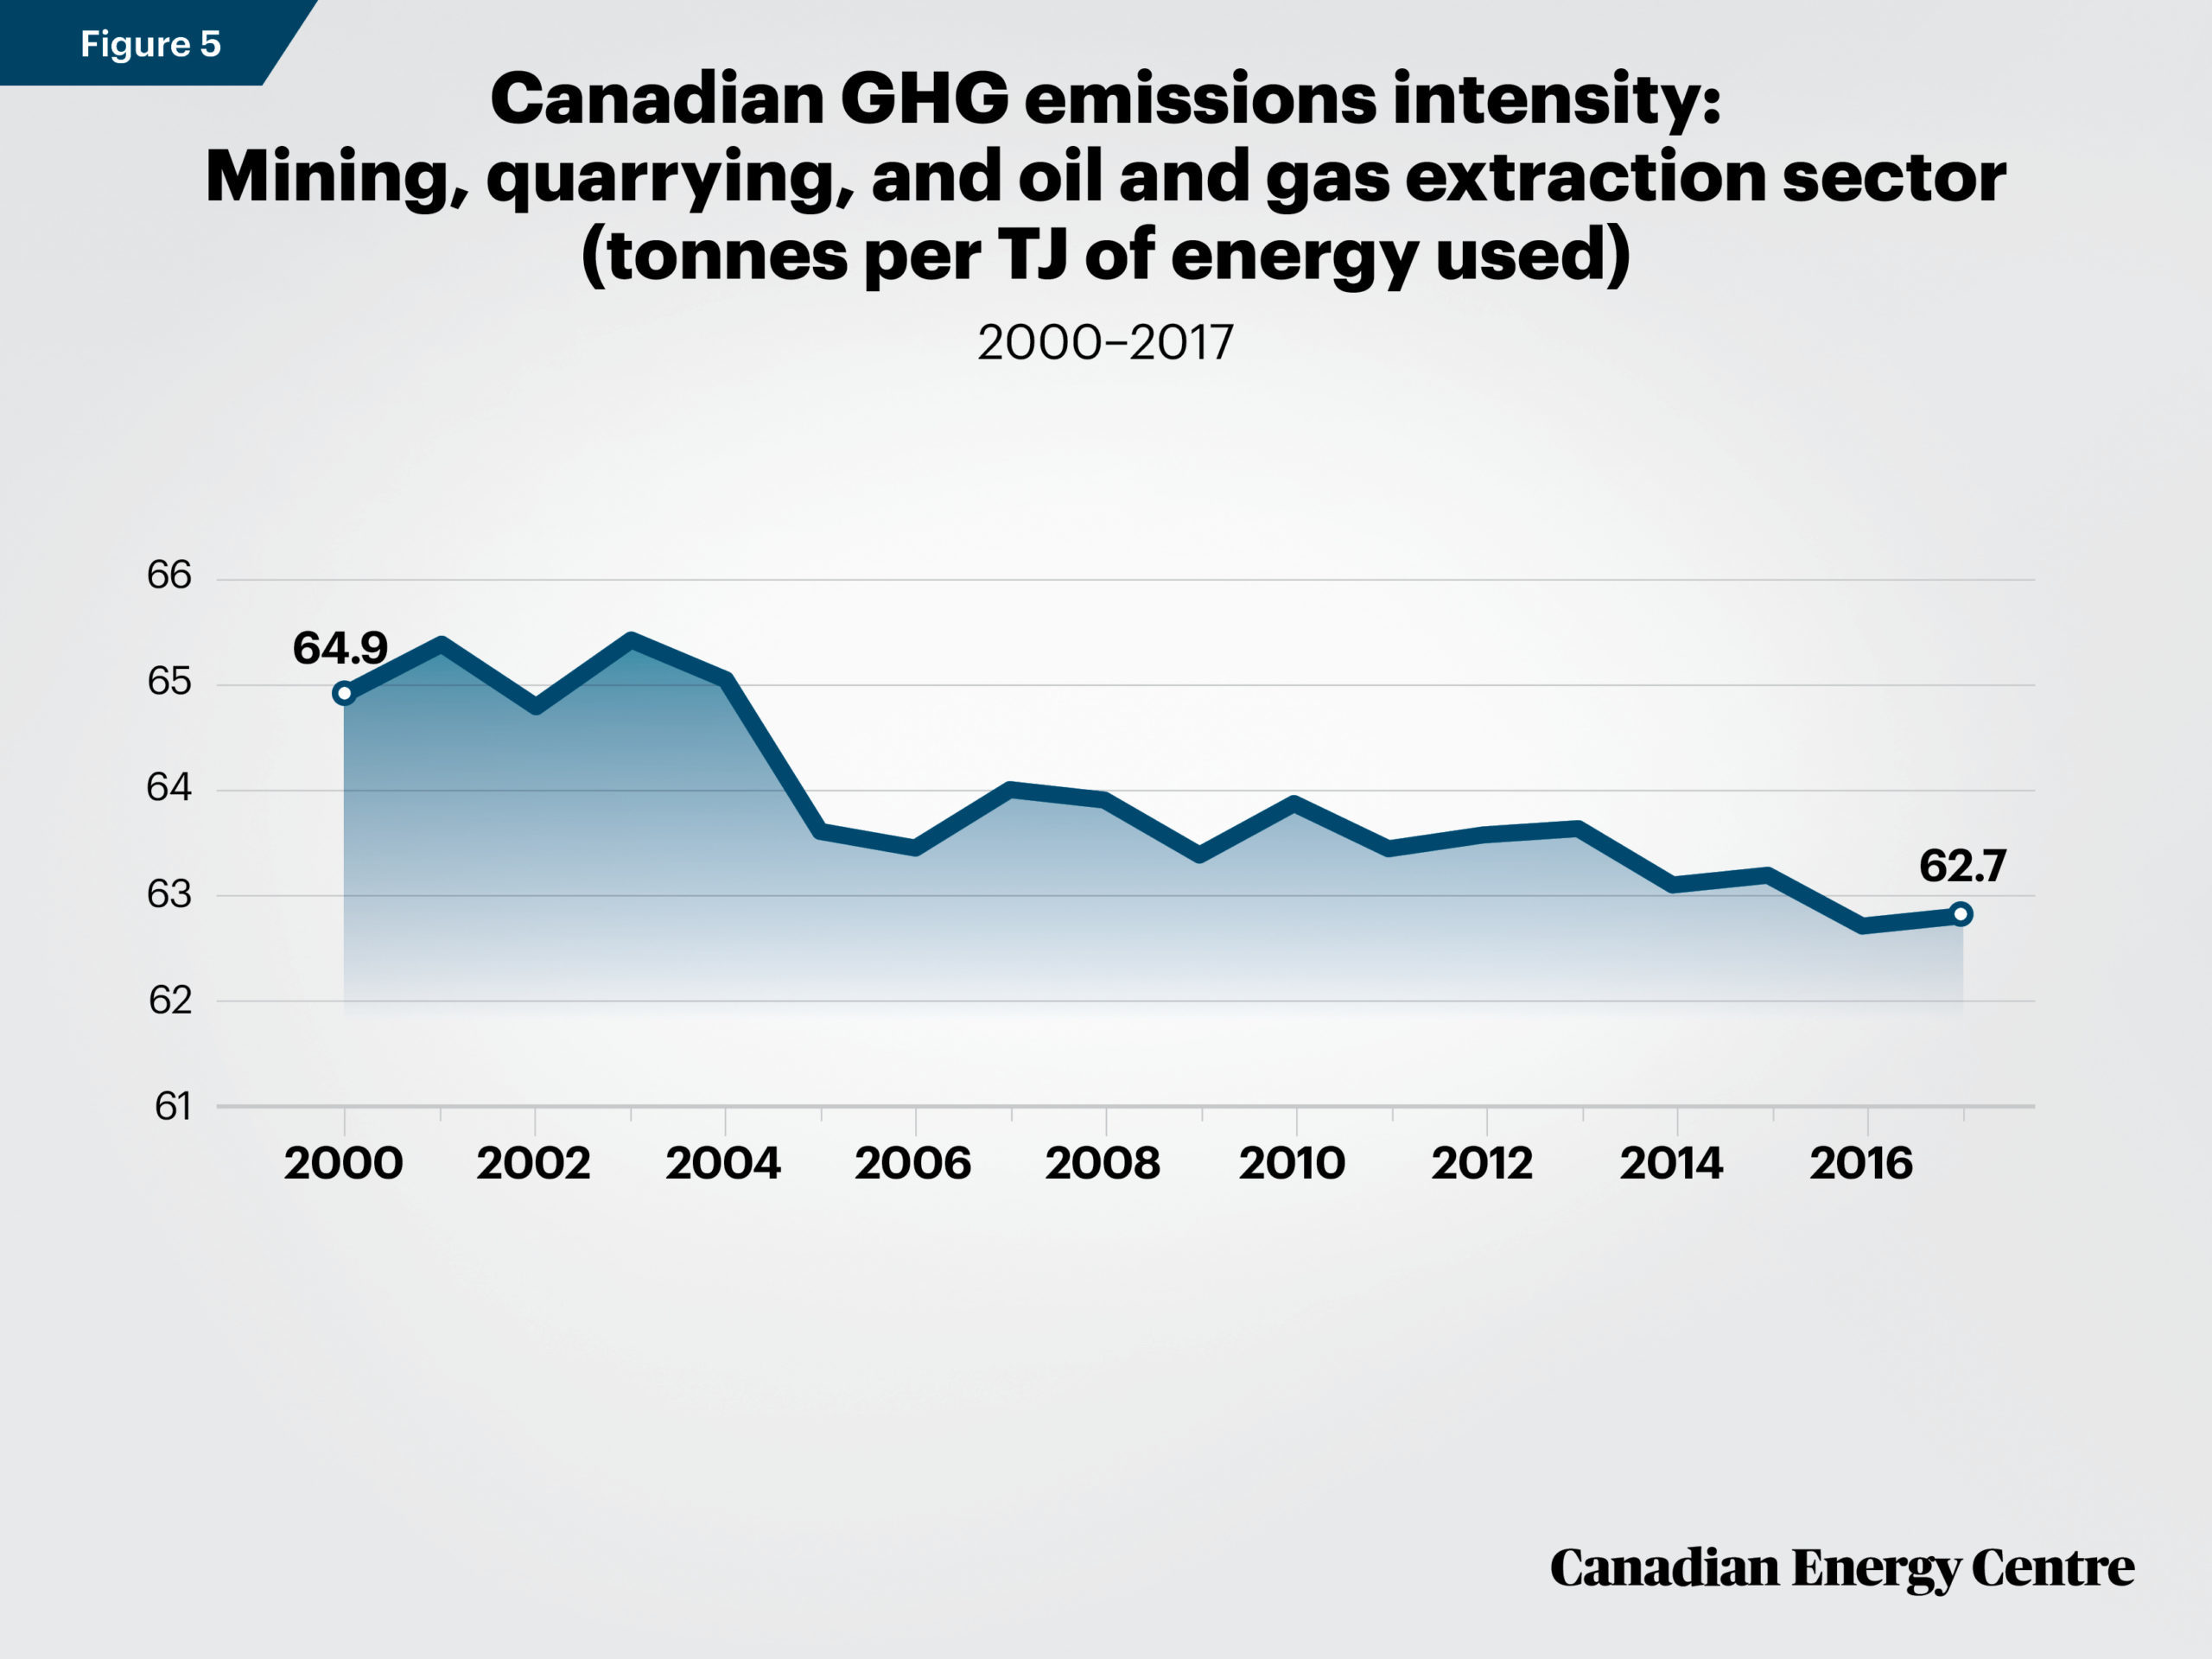
Canada’s GHG emission intensities by sector per TJ of energy used: the mining, quarrying, and oil and gas extraction sector comparable with other sectors
The trend of reduced emissions intensity applies to other sectors within Canada’s economy. This is defined as emissions per unit of energy used in various industries (including mining, quarrying, and oil and gas, forestry, cement, iron and steel, and construction), that are produced through the fossil fuels attributed to their operations.
- Between 2000 and 2017, the GHG intensity of the industrial sector in Canada declined from 51.03 tonnes of CO2e per TJ of energy used to 50.05 tonnes, a reduction of nearly 2 per cent (Natural Resources Canada, 2020).
- Between 2000 and 2017, the GHG intensity of the mining, quarrying, and oil and gas extraction sector in Canada declined from 64.9 tonnes of CO2e per TJ of energy used to 62.7 tonnes, a reduction of over 3 per cent (see figure 5) (Natural Resources Canada, 2020).
- The current emissions intensity of the mining, quarrying, and oil and gas extraction sector compares favourably to other key industries in Canada. In 2017, the GHG intensity of the mining, quarrying, and oil and gas extraction sector in Canada was 62.7 tonnes of CO2e per TJ of energy used in extraction. This compares to 69.4 tonnes in the iron and steel sector; 73.2 tonnes in the forestry sector; and 73.6 tonnes in the cement sector (see Figure 6) (Natural Resources Canada, 2020).
Source: Environment and Climate Change Canada (2020).
Source: Environment and Climate Change Canada (2020).
Part II: Evaluating GHG Emissions Intensity Trends between Canada and Select Energy-Producing and Consuming Nations
Canada’s GHG emissions intensity is comparable to other energy-producing and consuming countries
As noted earlier, the latest year for which per capita international emissions data are available is 2016.
The World Resources Institute (WRI) under the auspices of Climate Watch compiles historical GHG emissions through its Climate Analysis Indicators Tool (CAIT). These data include GHG emissions for 186 countries, including CO2, methane, fluorinated gases, and nitrous oxide. The values reported differ somewhat from the official estimate of GHG emissions that Canada and other countries submit to the United Nations Framework Convention on Climate Change (UNFCCC) in their National Inventory Reports. A leading cause of the differences is that many member countries, including Canada, now report emissions using a revised methodology and global warming potential guidelines that have yet to be used by WRI (Government of Canada, 2020).
Greenhouse gas data in the CAIT dataset also have uncertainties due to the fact they are using many different data sources. Despite these uncertainties, the WRI has chosen to err on the side of inclusiveness, by capturing the widest possible range of GHG sources and sinks that contribute to global climate change.¹
1. For more information on data uncertainties please consult section 7 of CAIT Country Greenhouse Gas Emissions: Sources and Methods.
Canada’s GHG emissions intensity: Falling
According to the WRI, between 2000 and 2016, Canada’s GHG emissions intensity fell from 985 tonnes of CO2e per million dollars of GDP to 510 tonnes, a decline of over 48 percent (see Figure 7) (World Resources Institute, 2020).
Source: World Resources Institute (2020).
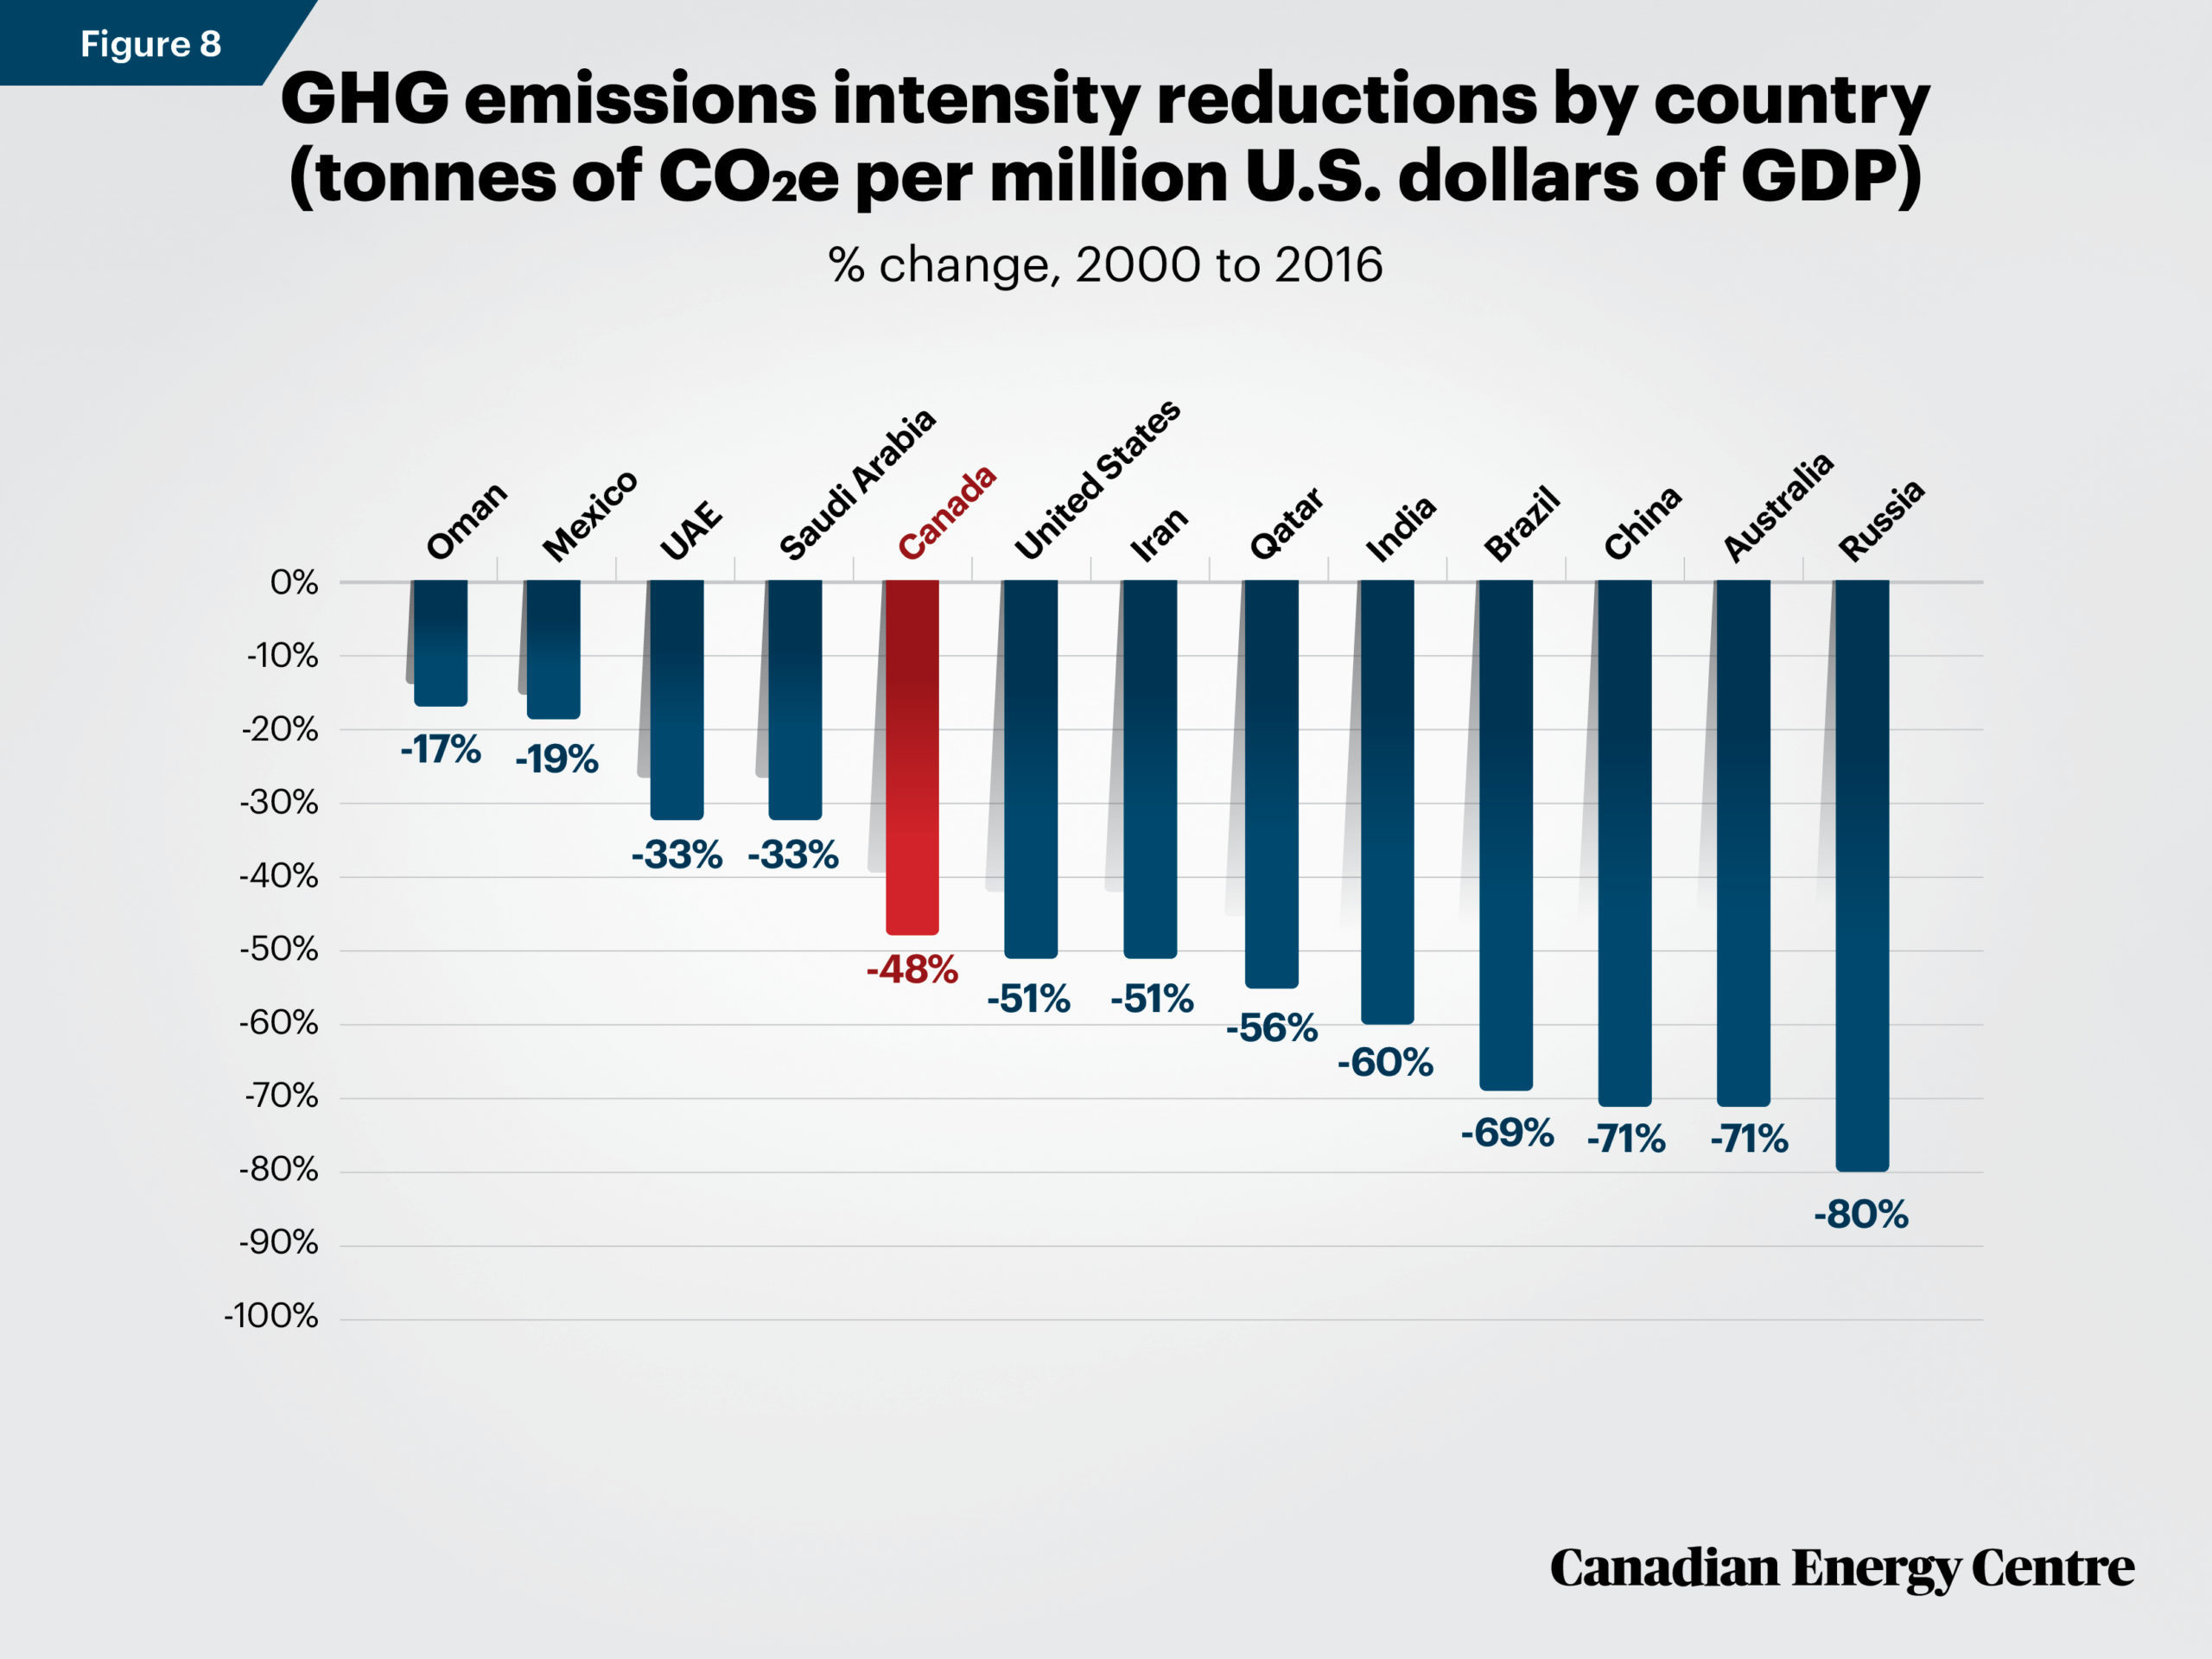
By comparison, over the same period, GHG emissions intensity expressed in tonnes of CO2e per million US dollars of GDP fell in a spectrum that ranged from -80 per cent in Russia to -17 per cent in Oman (see Figure 8) (World Resource Institute, 2020).
Source: World Resources Institute (2020).
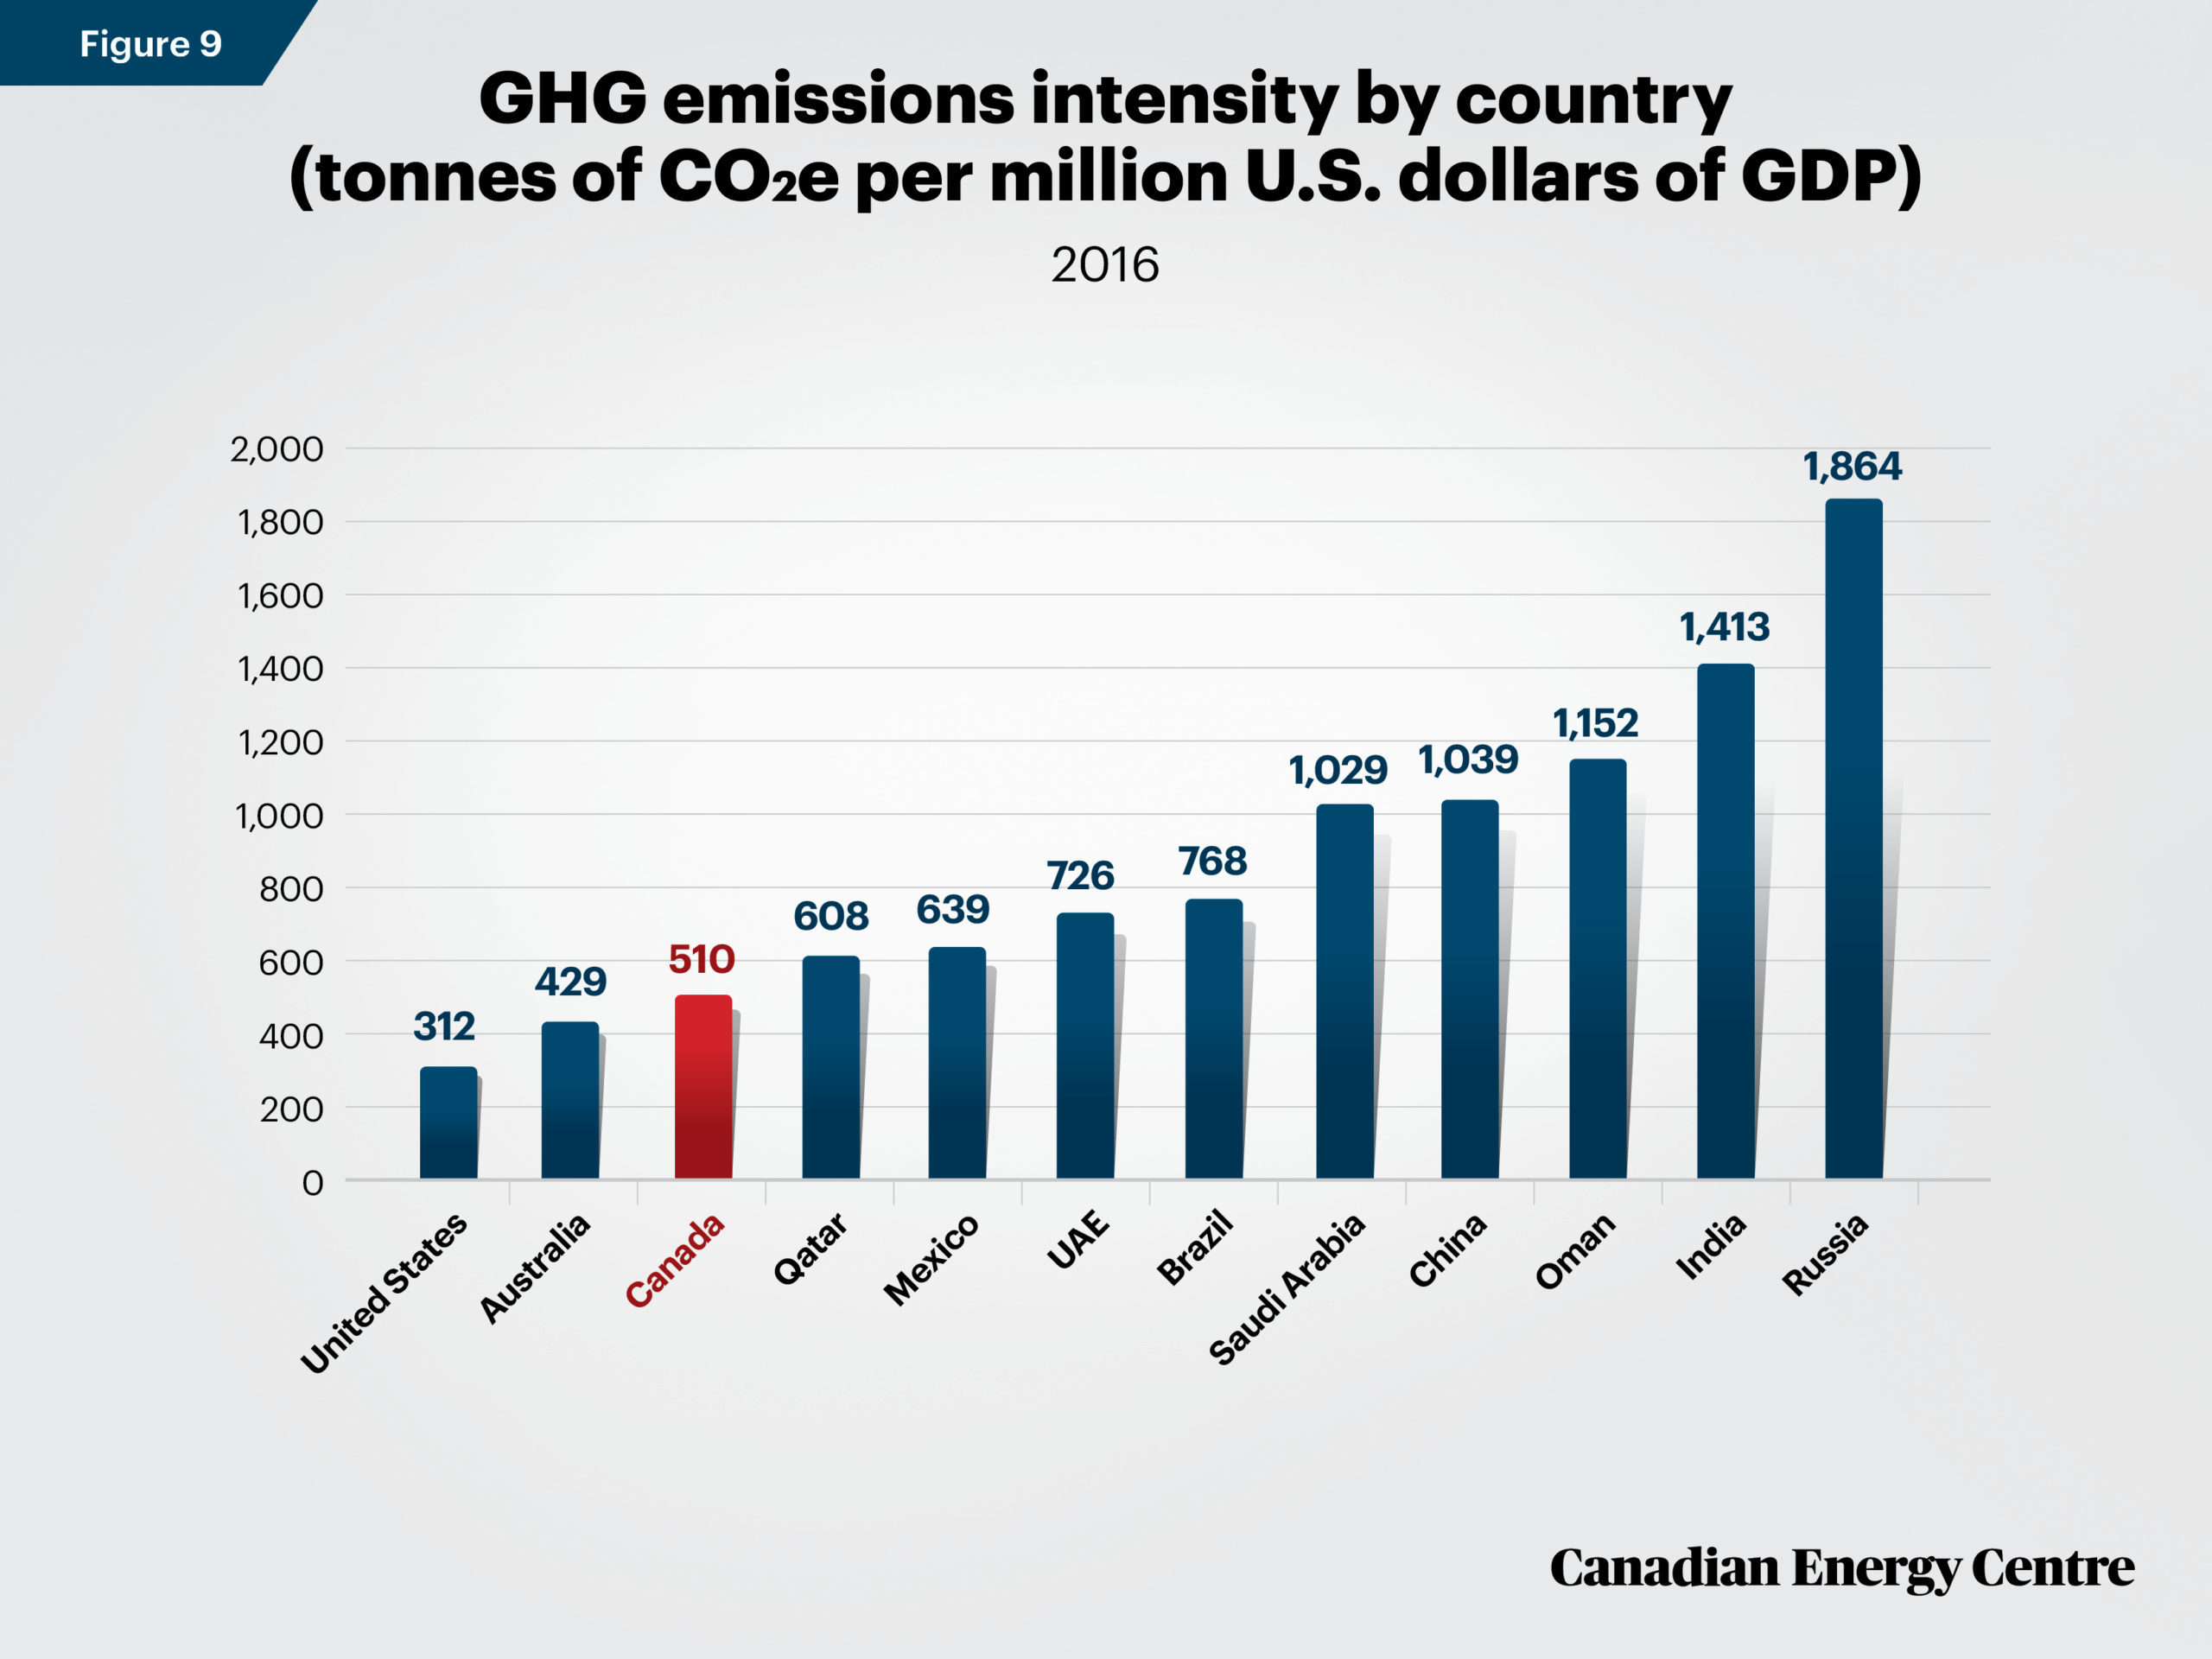
Despite a much more dramatic reduction in countries such as Russia (-80 per cent) when compared with Canada (-48 per cent), in 2016, Canada’s GHG emissions intensity of 510 tonnes of CO2e per million dollars of GDP was lower than the level in China, India, Brazil, Oman, Qatar, Russia, Saudi Arabia, and the United Arab Emirates (see Figure 9) (World Resource Institute, 2020).
Source: World Resources Institute (2020).
Canada’s fuel combustion GHG emission intensities: Falling
The International Energy Agency (IEA) tracks GHG fuel combustion emissions (i.e., emissions stemming from energy use) for over 180 countries and regions. This is an important indicator to examine as globally, about 70 to 80 per cent of GHG emissions are from the production and consumption of energy. This includes activities such as using gasoline for transportation, non-renewable electricity production, oil and gas production, and heating and cooling of buildings (Environment and Climate Change, 2020b).
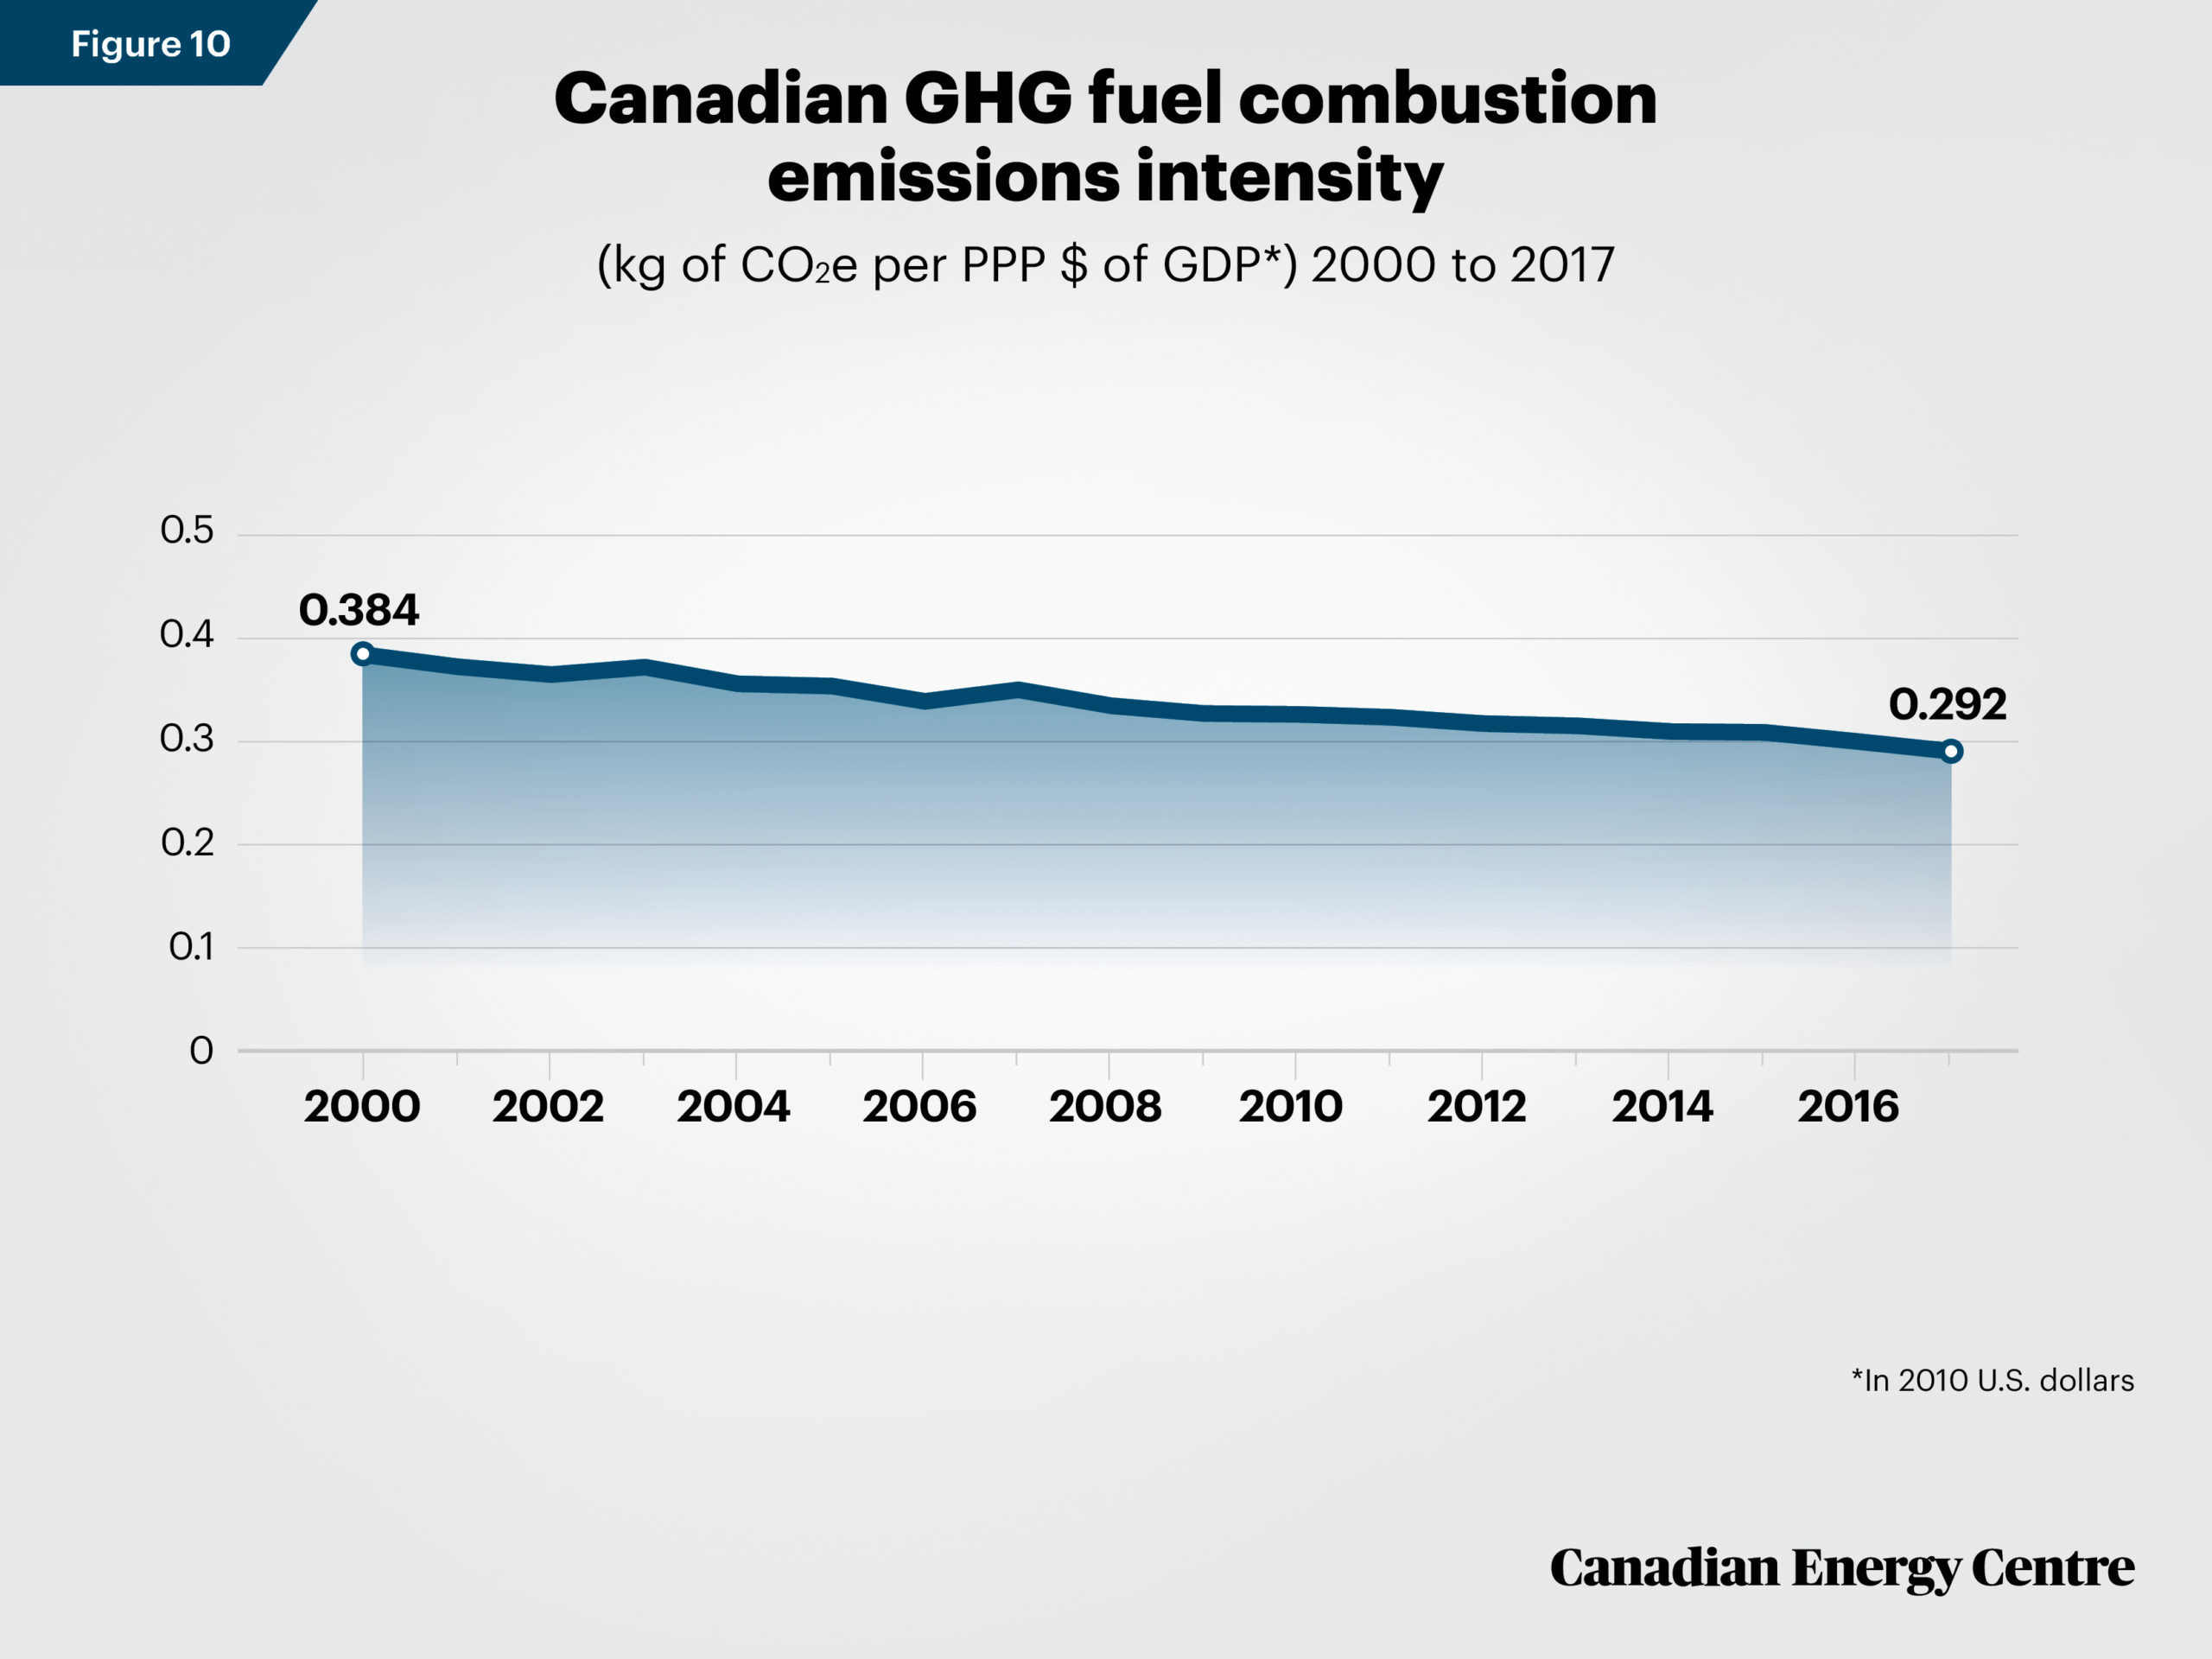
Canada’s GHG fuel combustion emissions intensity has been falling. Between 2000 and 2017 (the latter year is the most recent for which comprehensive data are available), Canada’s GHG fuel combustion emissions intensity fell from 0.384 kilograms (kg) of CO2e per purchasing power parity (PPP) in 2010 US dollars of GDP to 0.292 kg, a decline of nearly 24 per cent (see figure 10) (International Energy Agency, 2020)
Source: International Energy Agency (2020).
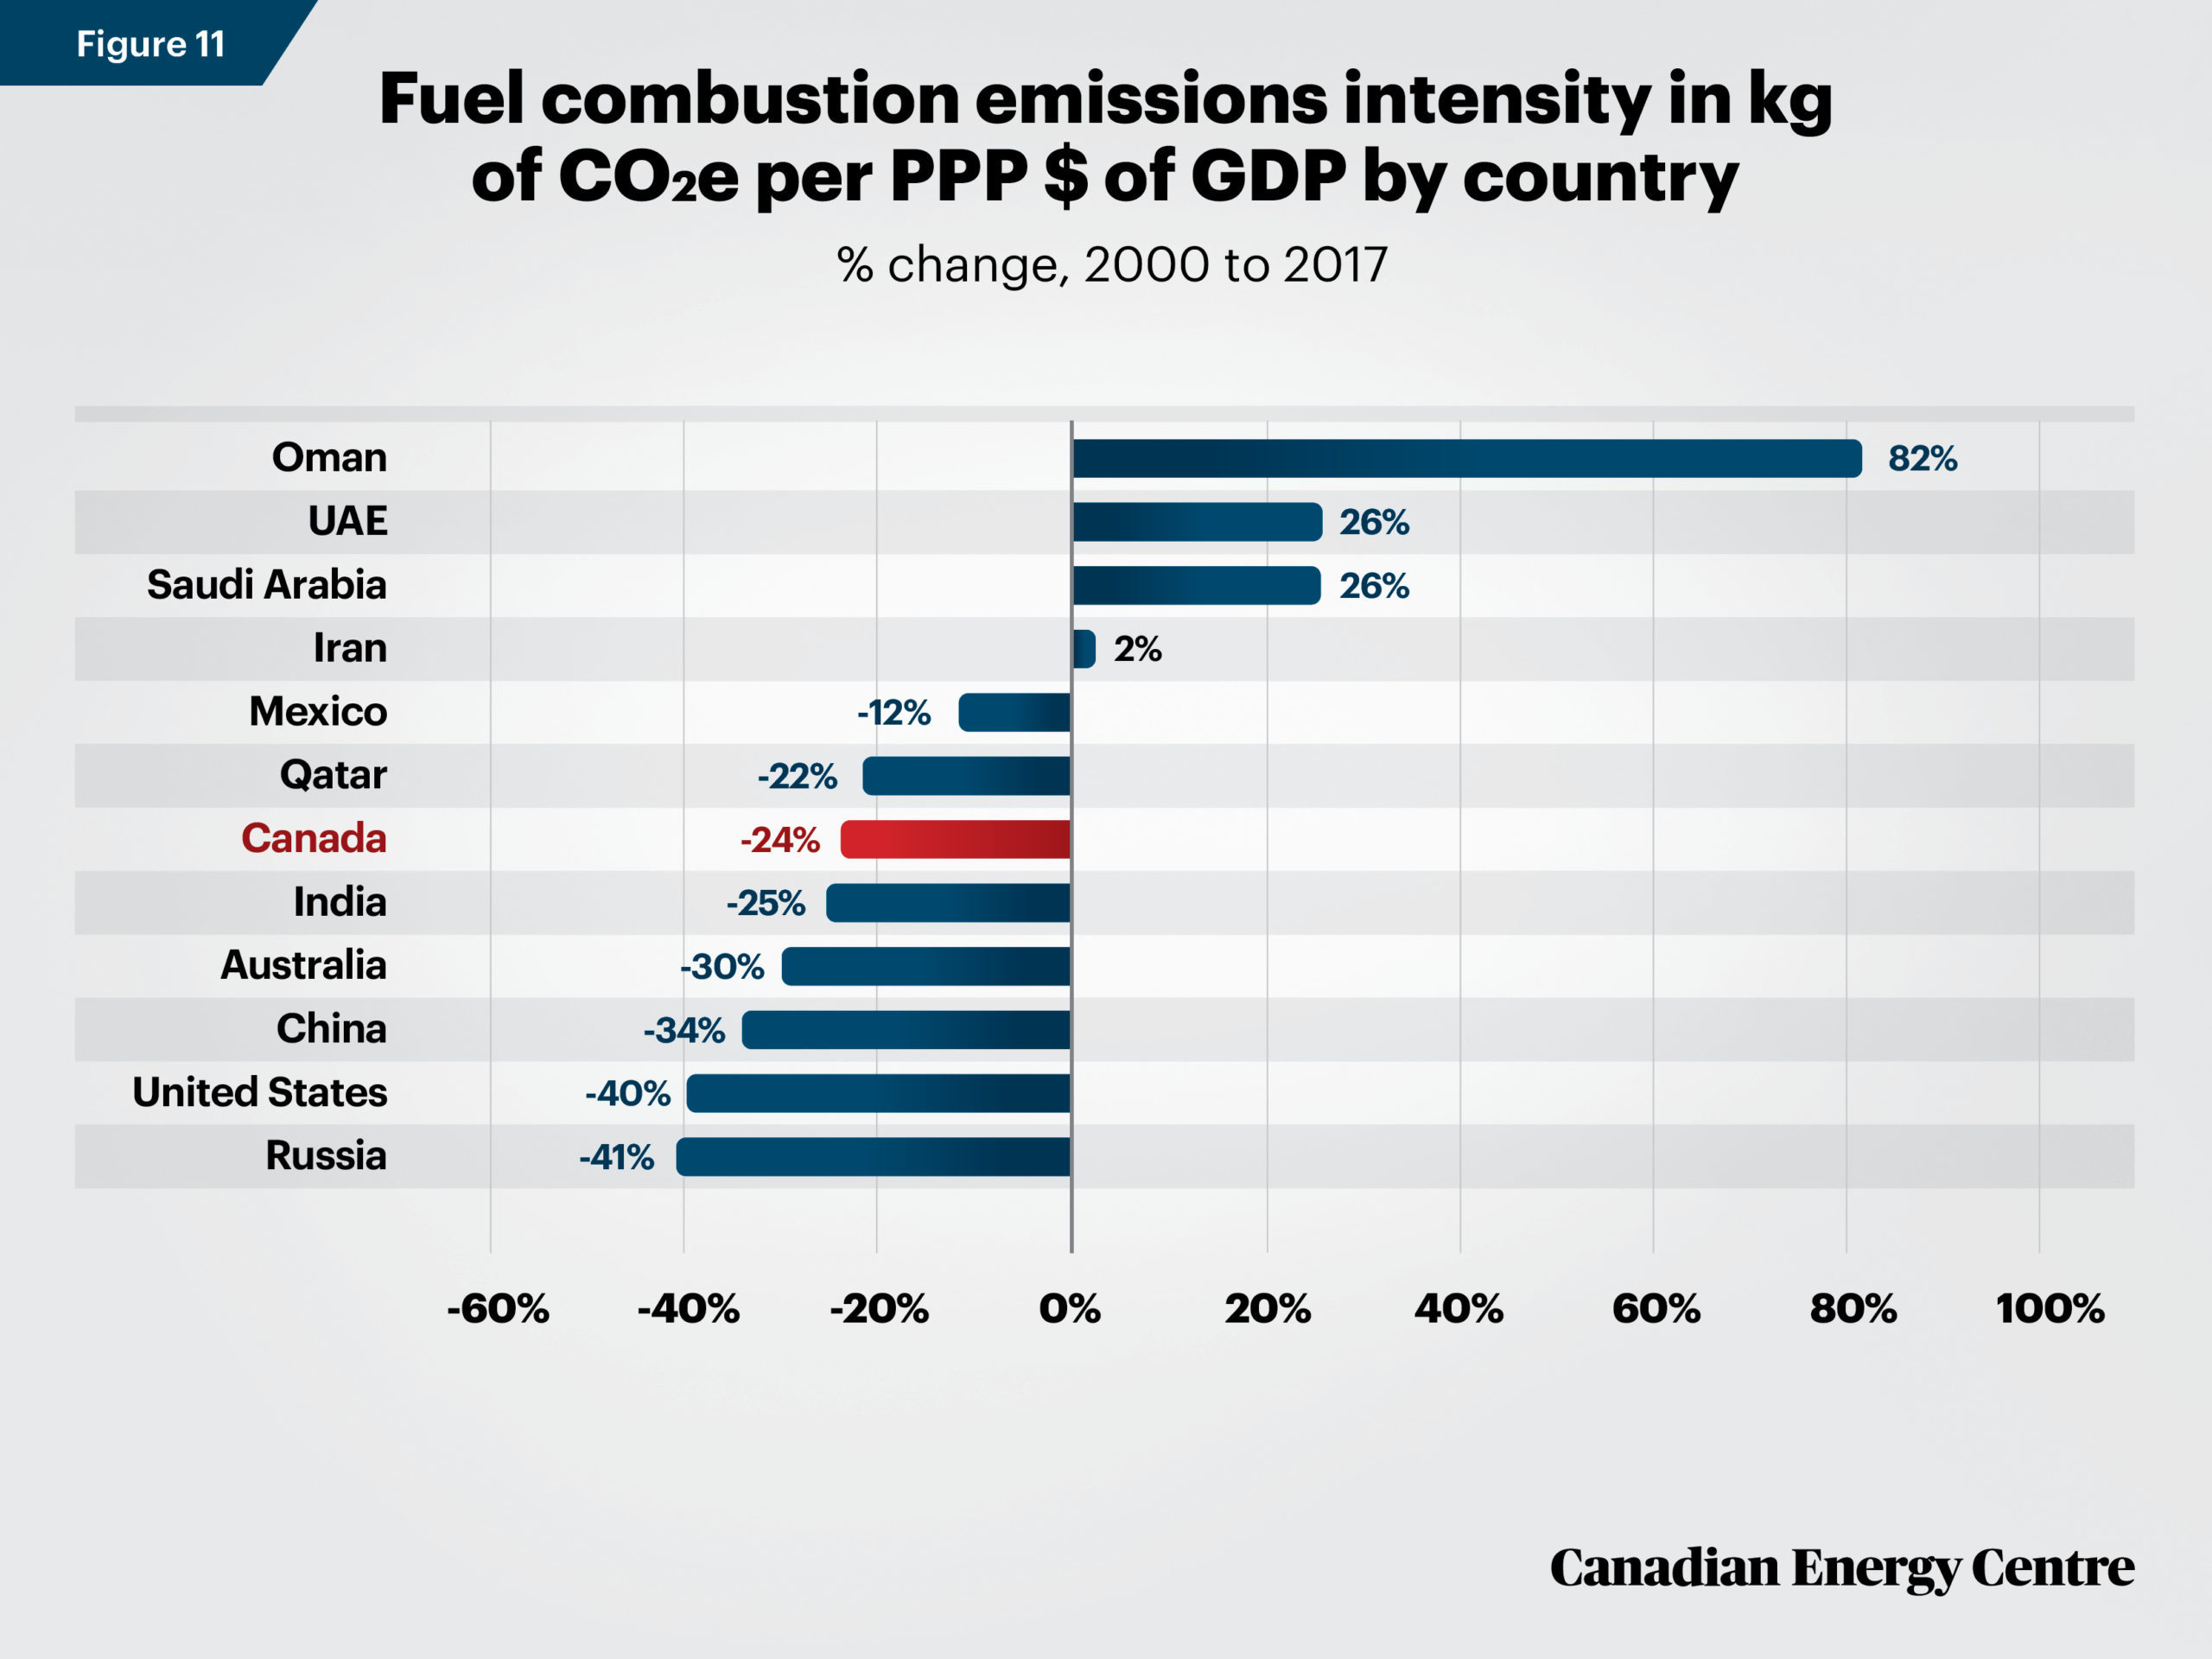
By comparison, fuel combustion emissions intensity expressed in kg of CO2e per PPP in 2010 US dollars of GDP fell in a span that ranged from -41 per cent in Russia to an increase of 82 per cent in Oman over the same period (see Figure 11) (International Energy Agency, 2020).
Source: International Energy Agency (2020).
In 2017, Canada’s GHG fuel combustion emissions of 0.292 kg of CO2e per PPP in 2010 US dollars of GDP ranked just above Australia and the United States, but lower than India, Iran,Mexico, Oman, Qatar, Russia, Saudi Arabia, and the United Arab Emirates (see Figure 12) (International Energy Agency, 2020).
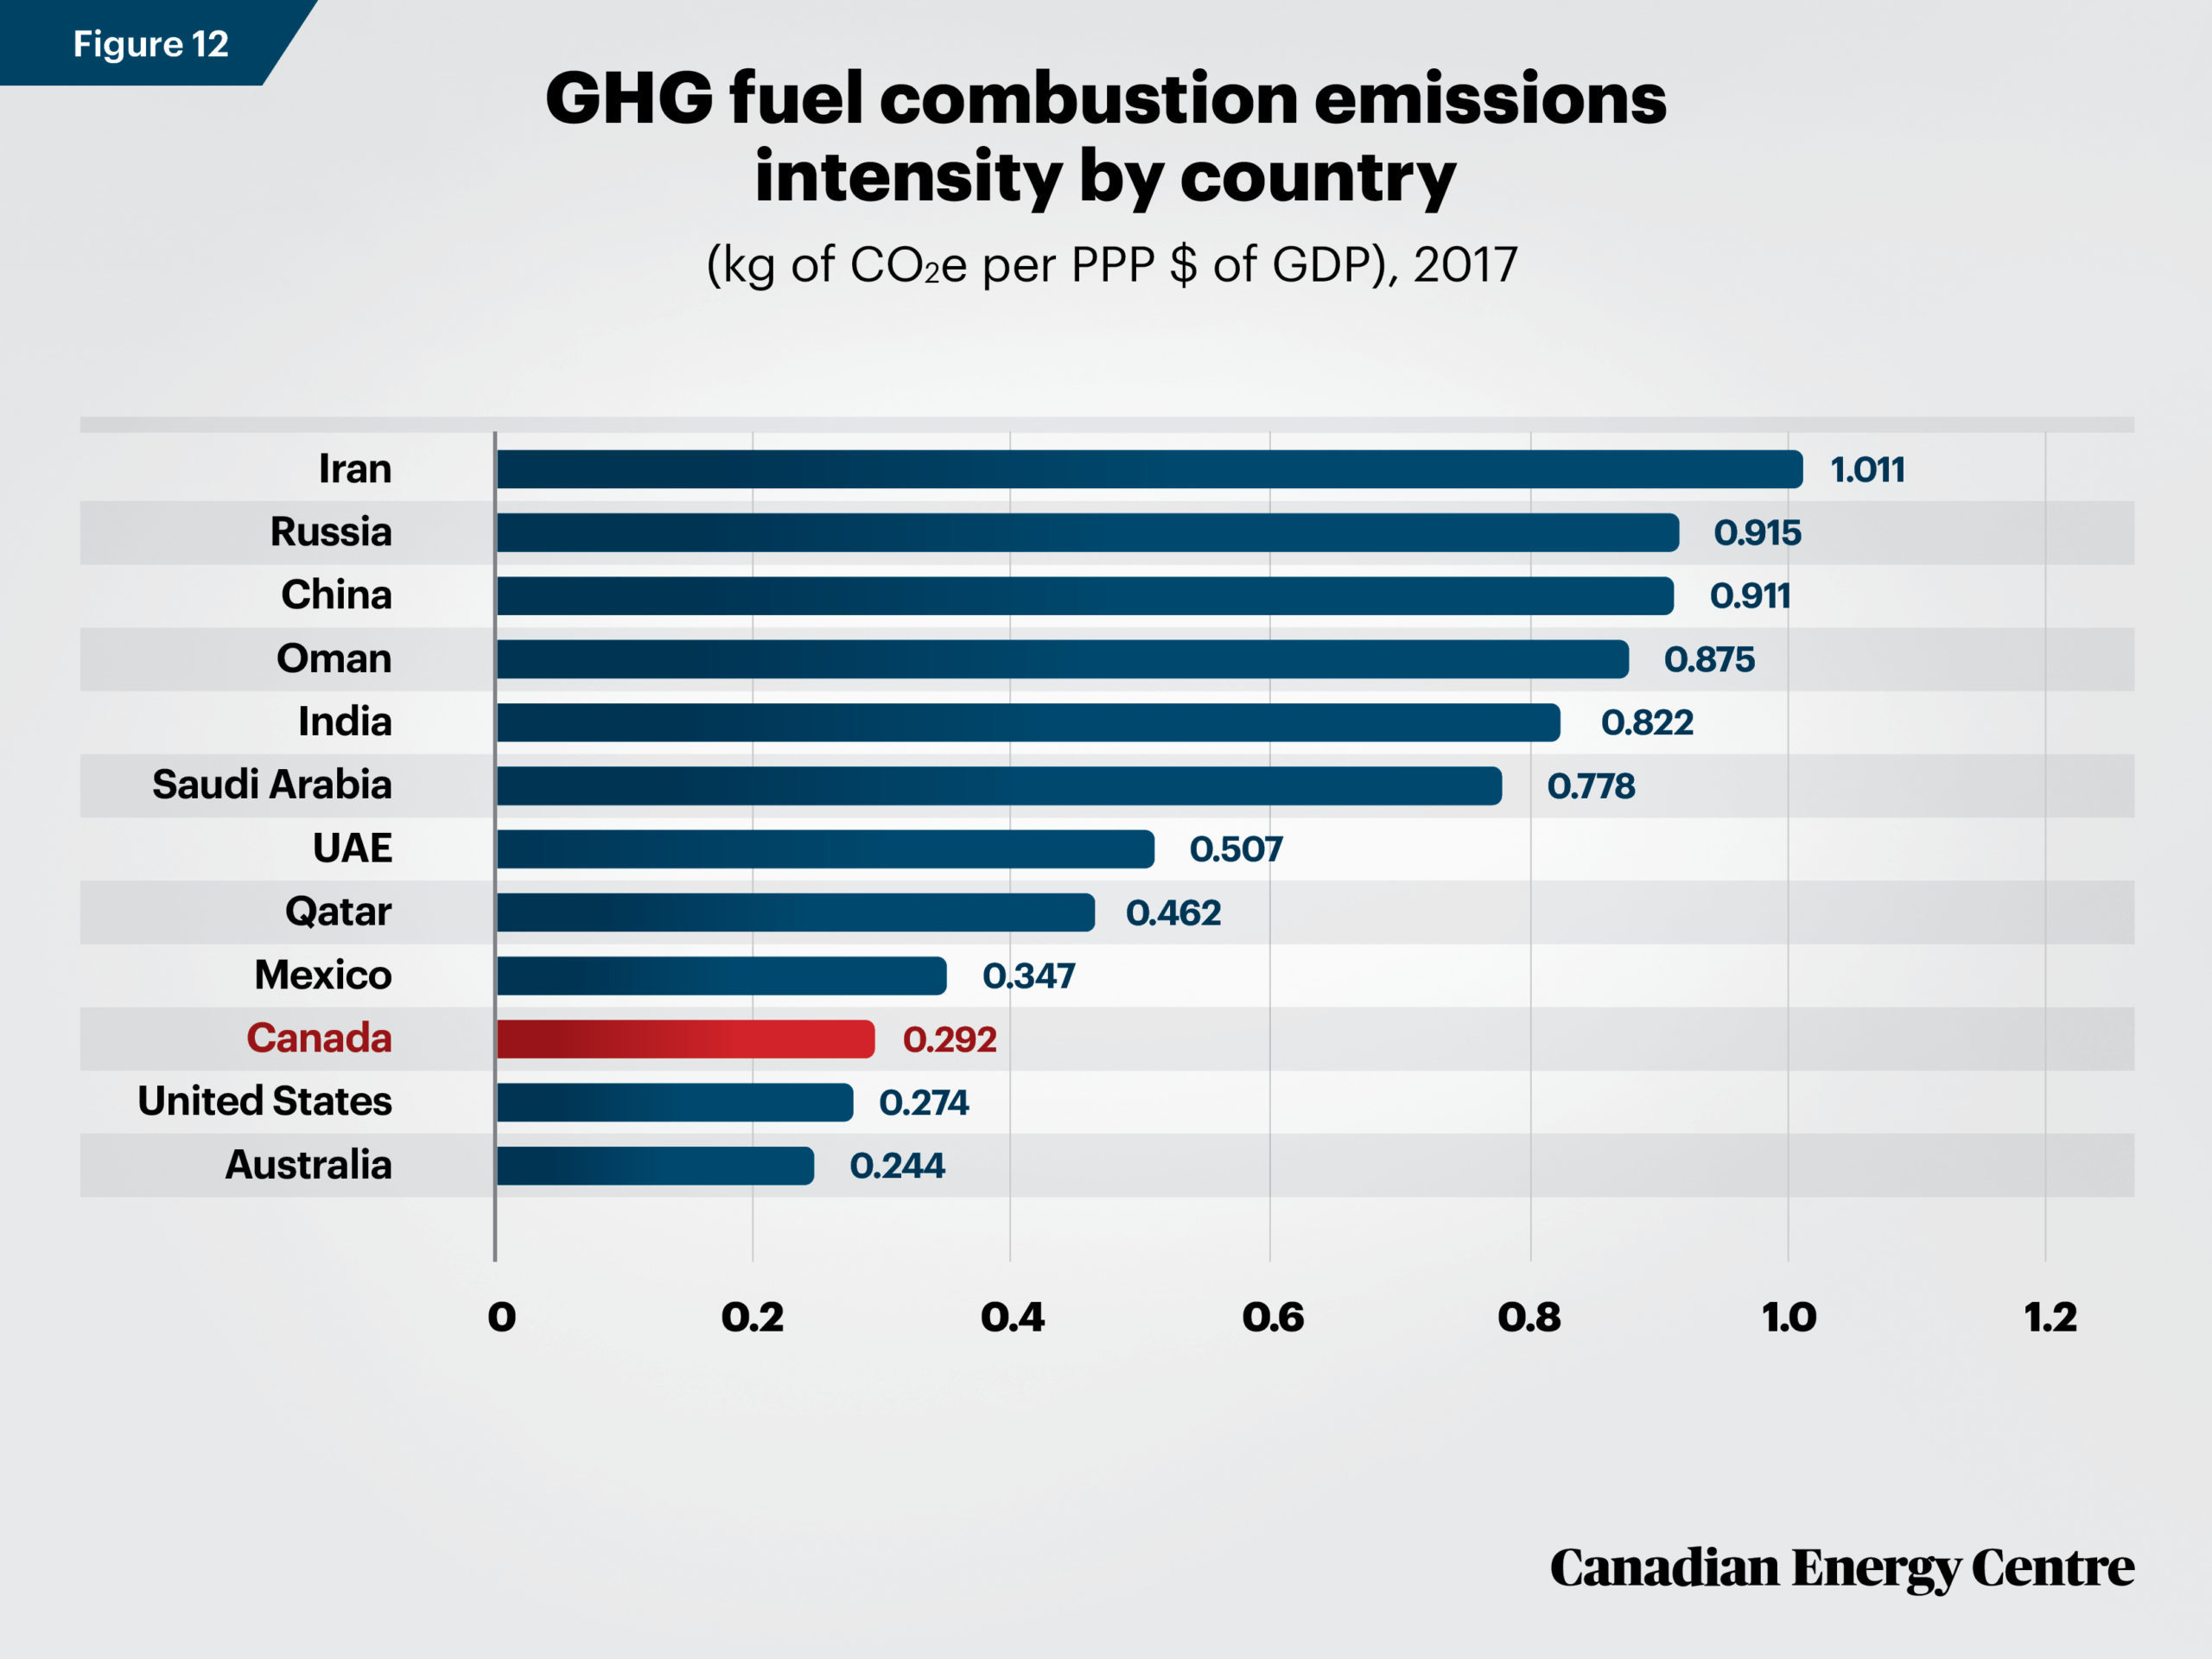
Source: International Energy Agency (2020).
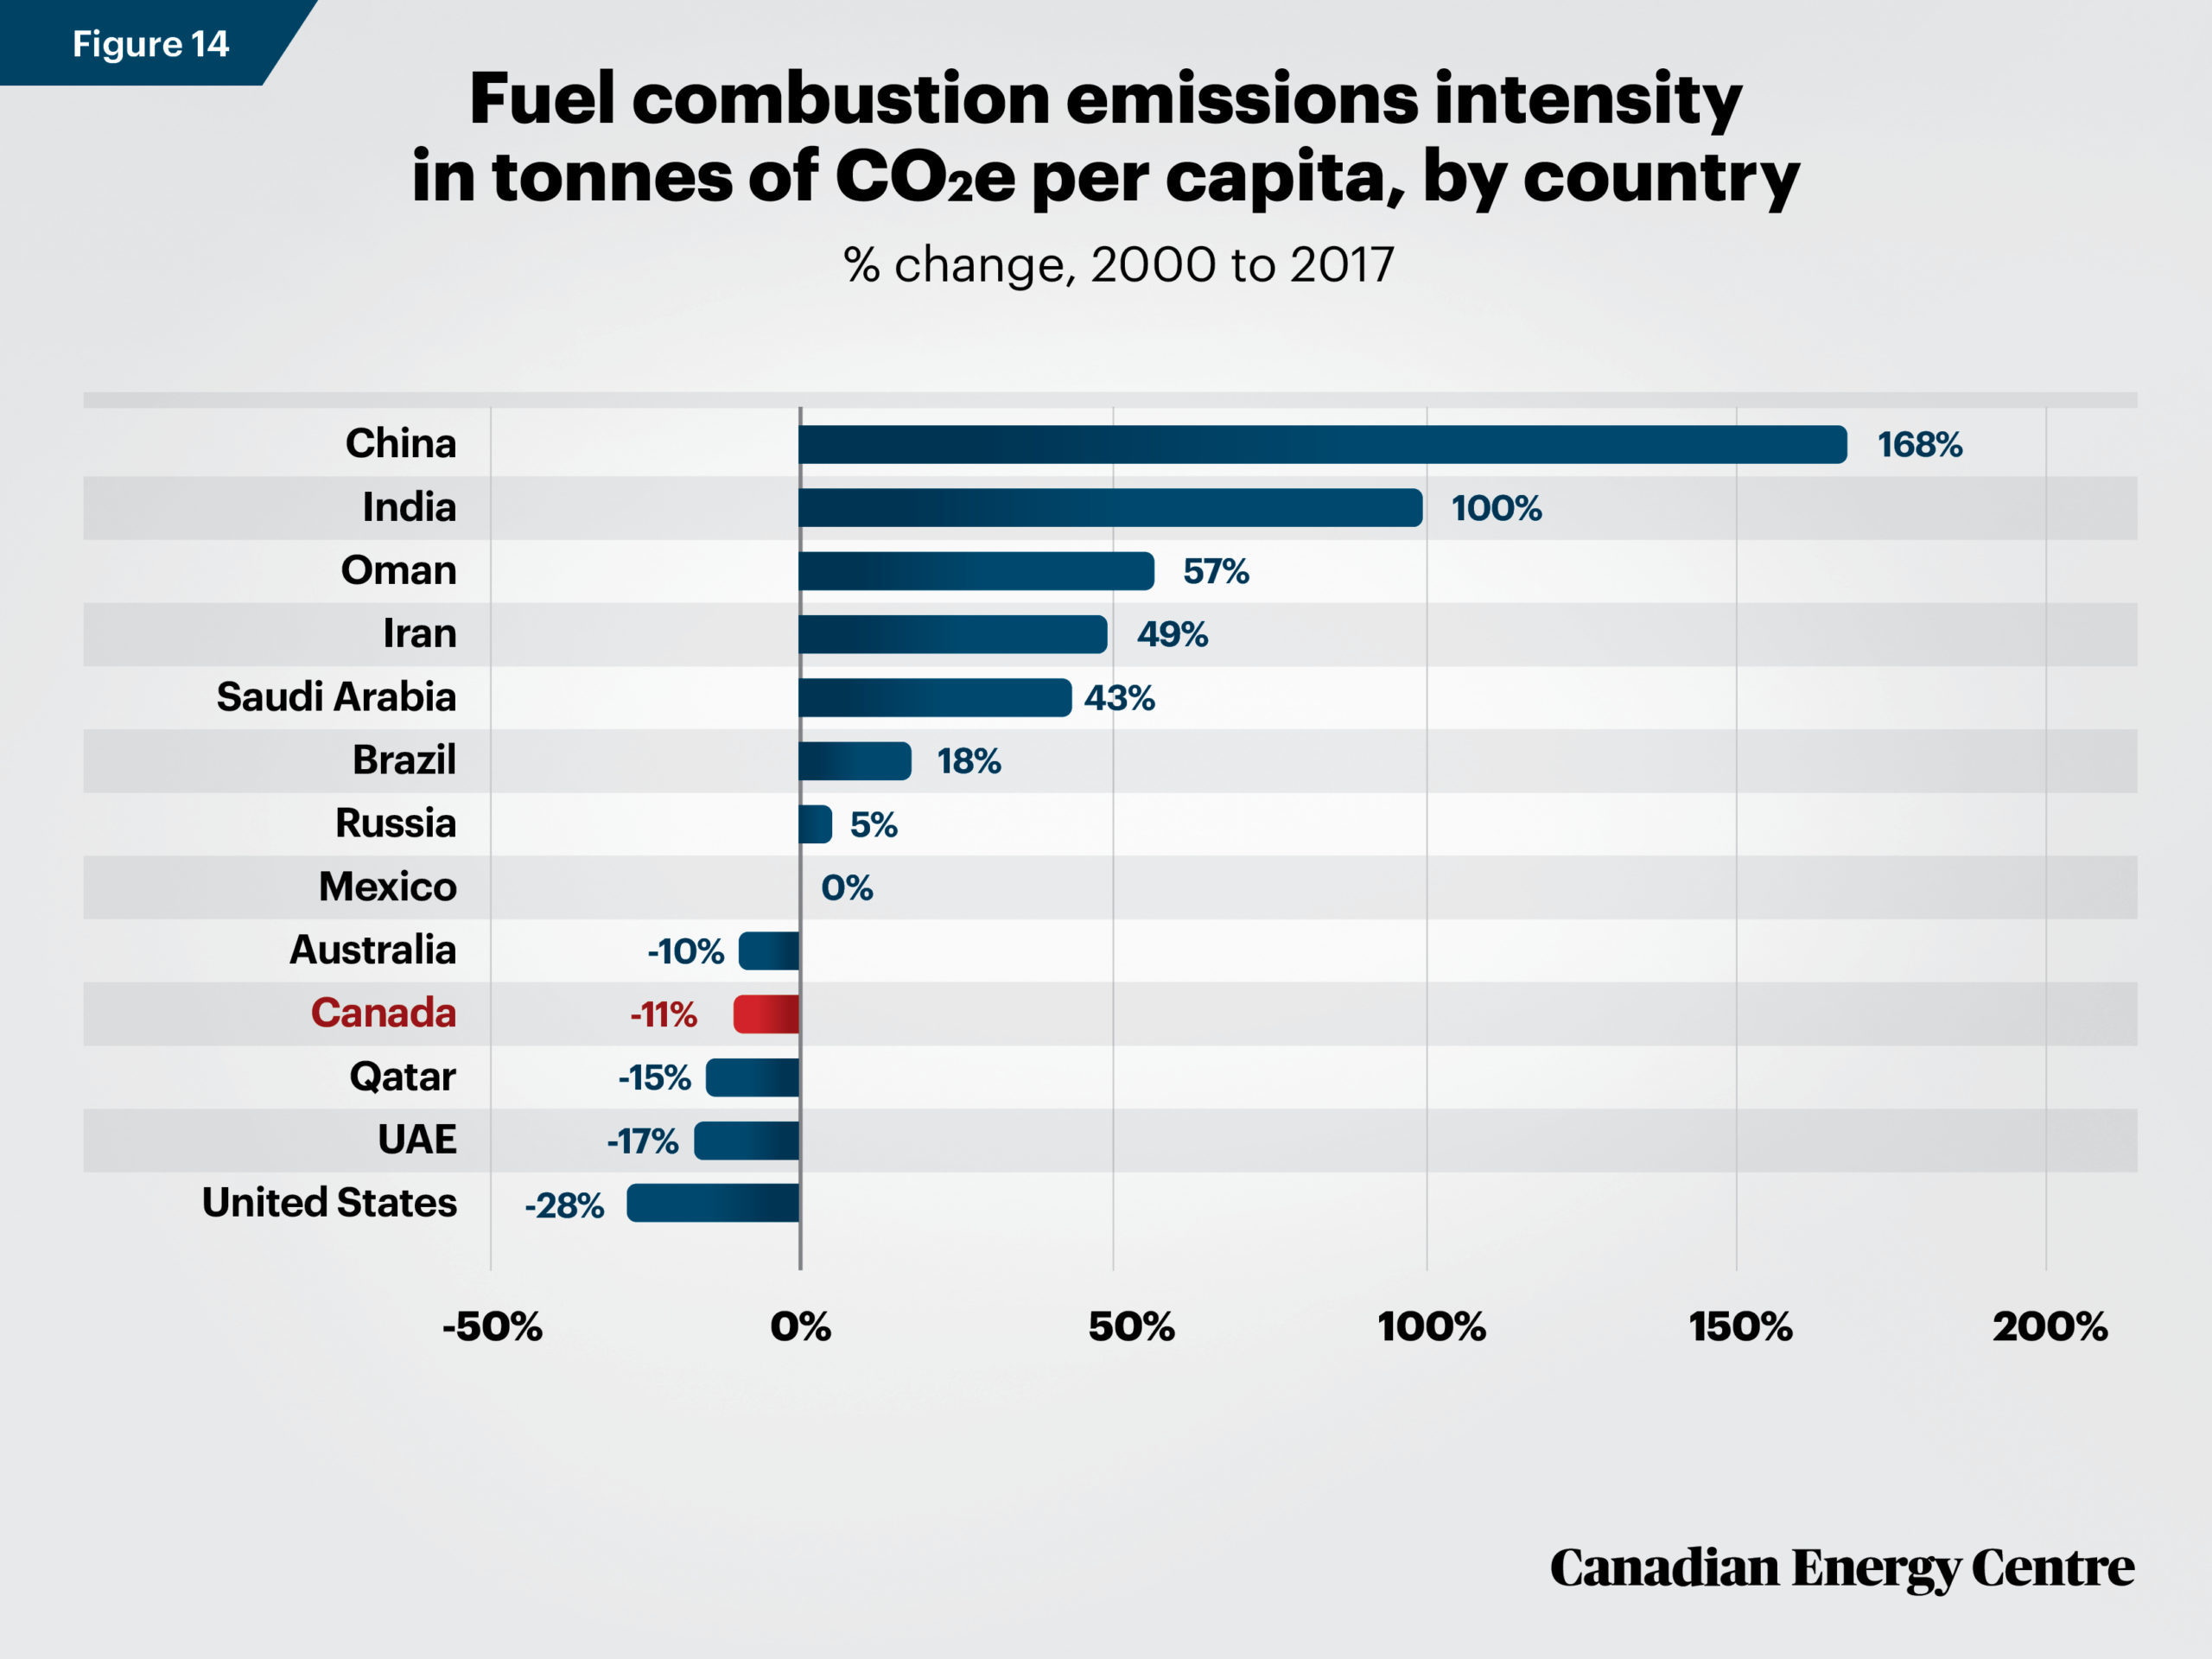
Between 2000 and 2017, Canada’s fuel combustion emissions intensity fell from 16.8 tonnes of CO2e per capita to 15.0 tonnes of CO2e per capita, a decline of nearly 11 per cent (see Figures 13 and 14) (International Energy Agency, 2020). By comparison, fuel combustion emissions intensity expressed in CO2e per capita ranged from a reduction (-28 per cent) in the United States to an increase of 168 per cent in China (see Figure 14) (International Energy Agency, 2020).
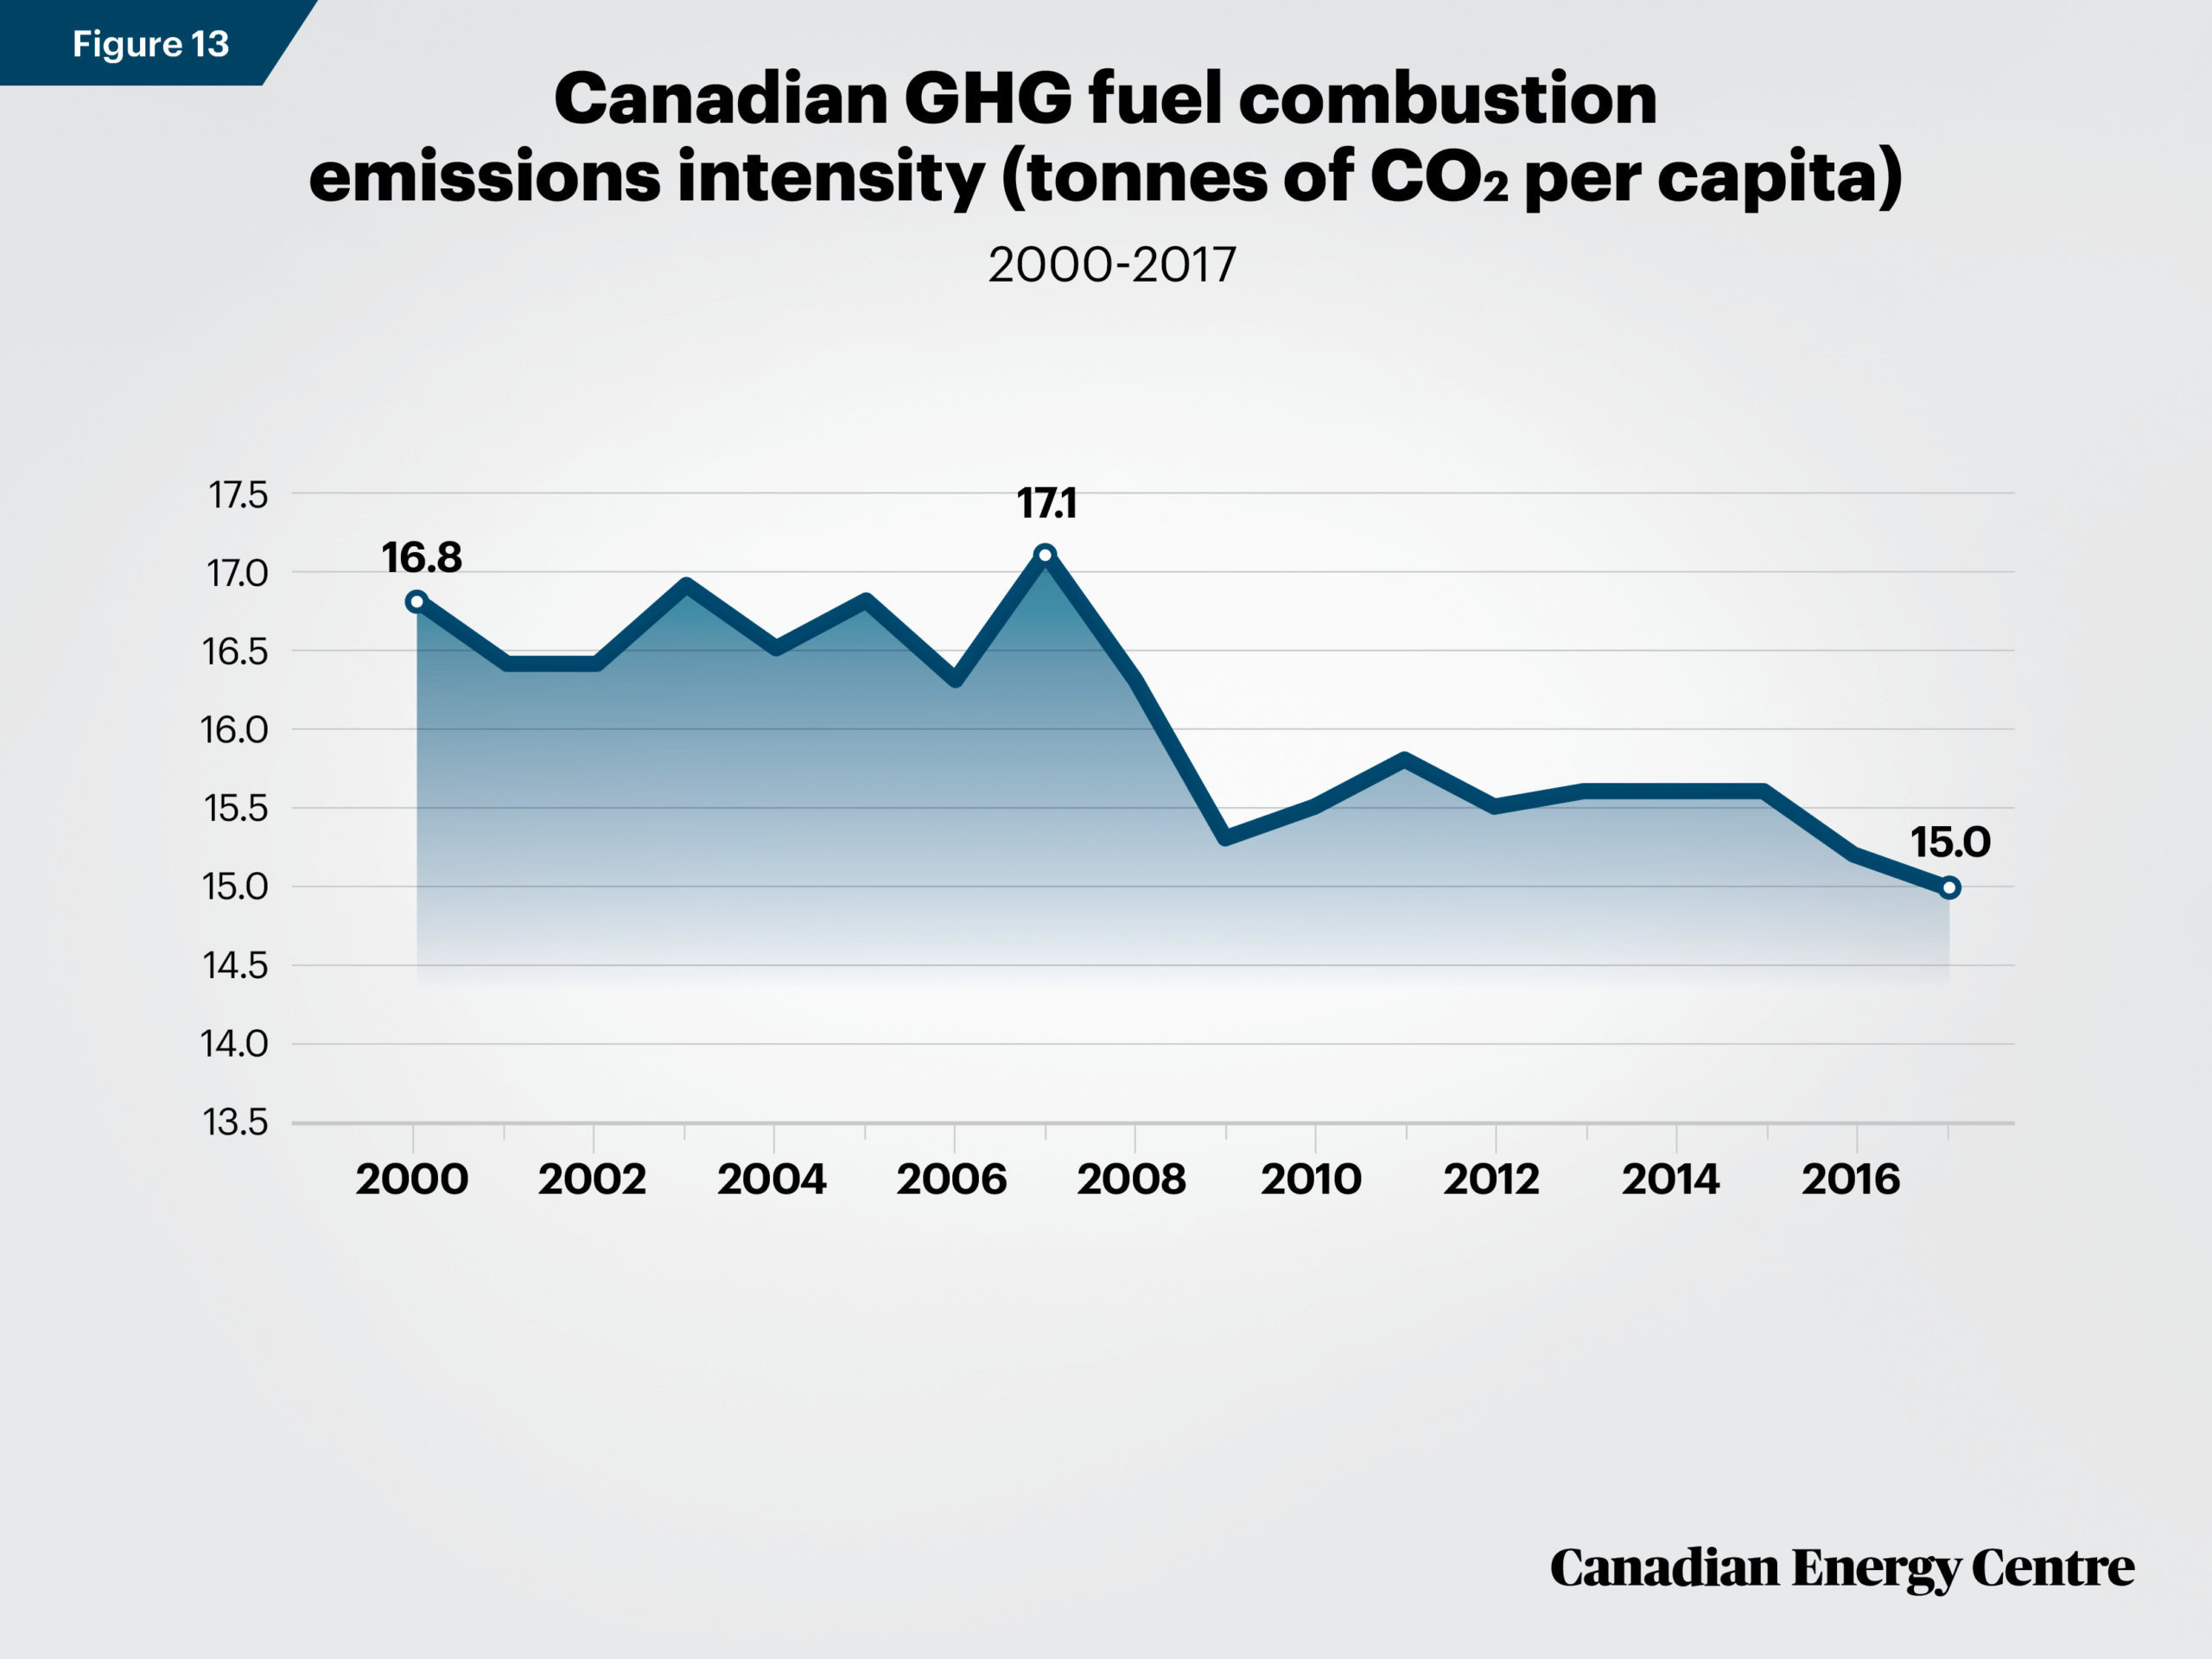
Source: International Energy Agency (2020).
Source: International Energy Agency (2020).
In 2017, Canada’s fuel combustion emissions intensity of 15.0 tonnes of CO2e per capita was higher than the United States and Oman, but lower than Australia, Qatar, Saudi Arabia, and the United Arab Emirates (see Figure 15) (International Energy Agency, 2020).
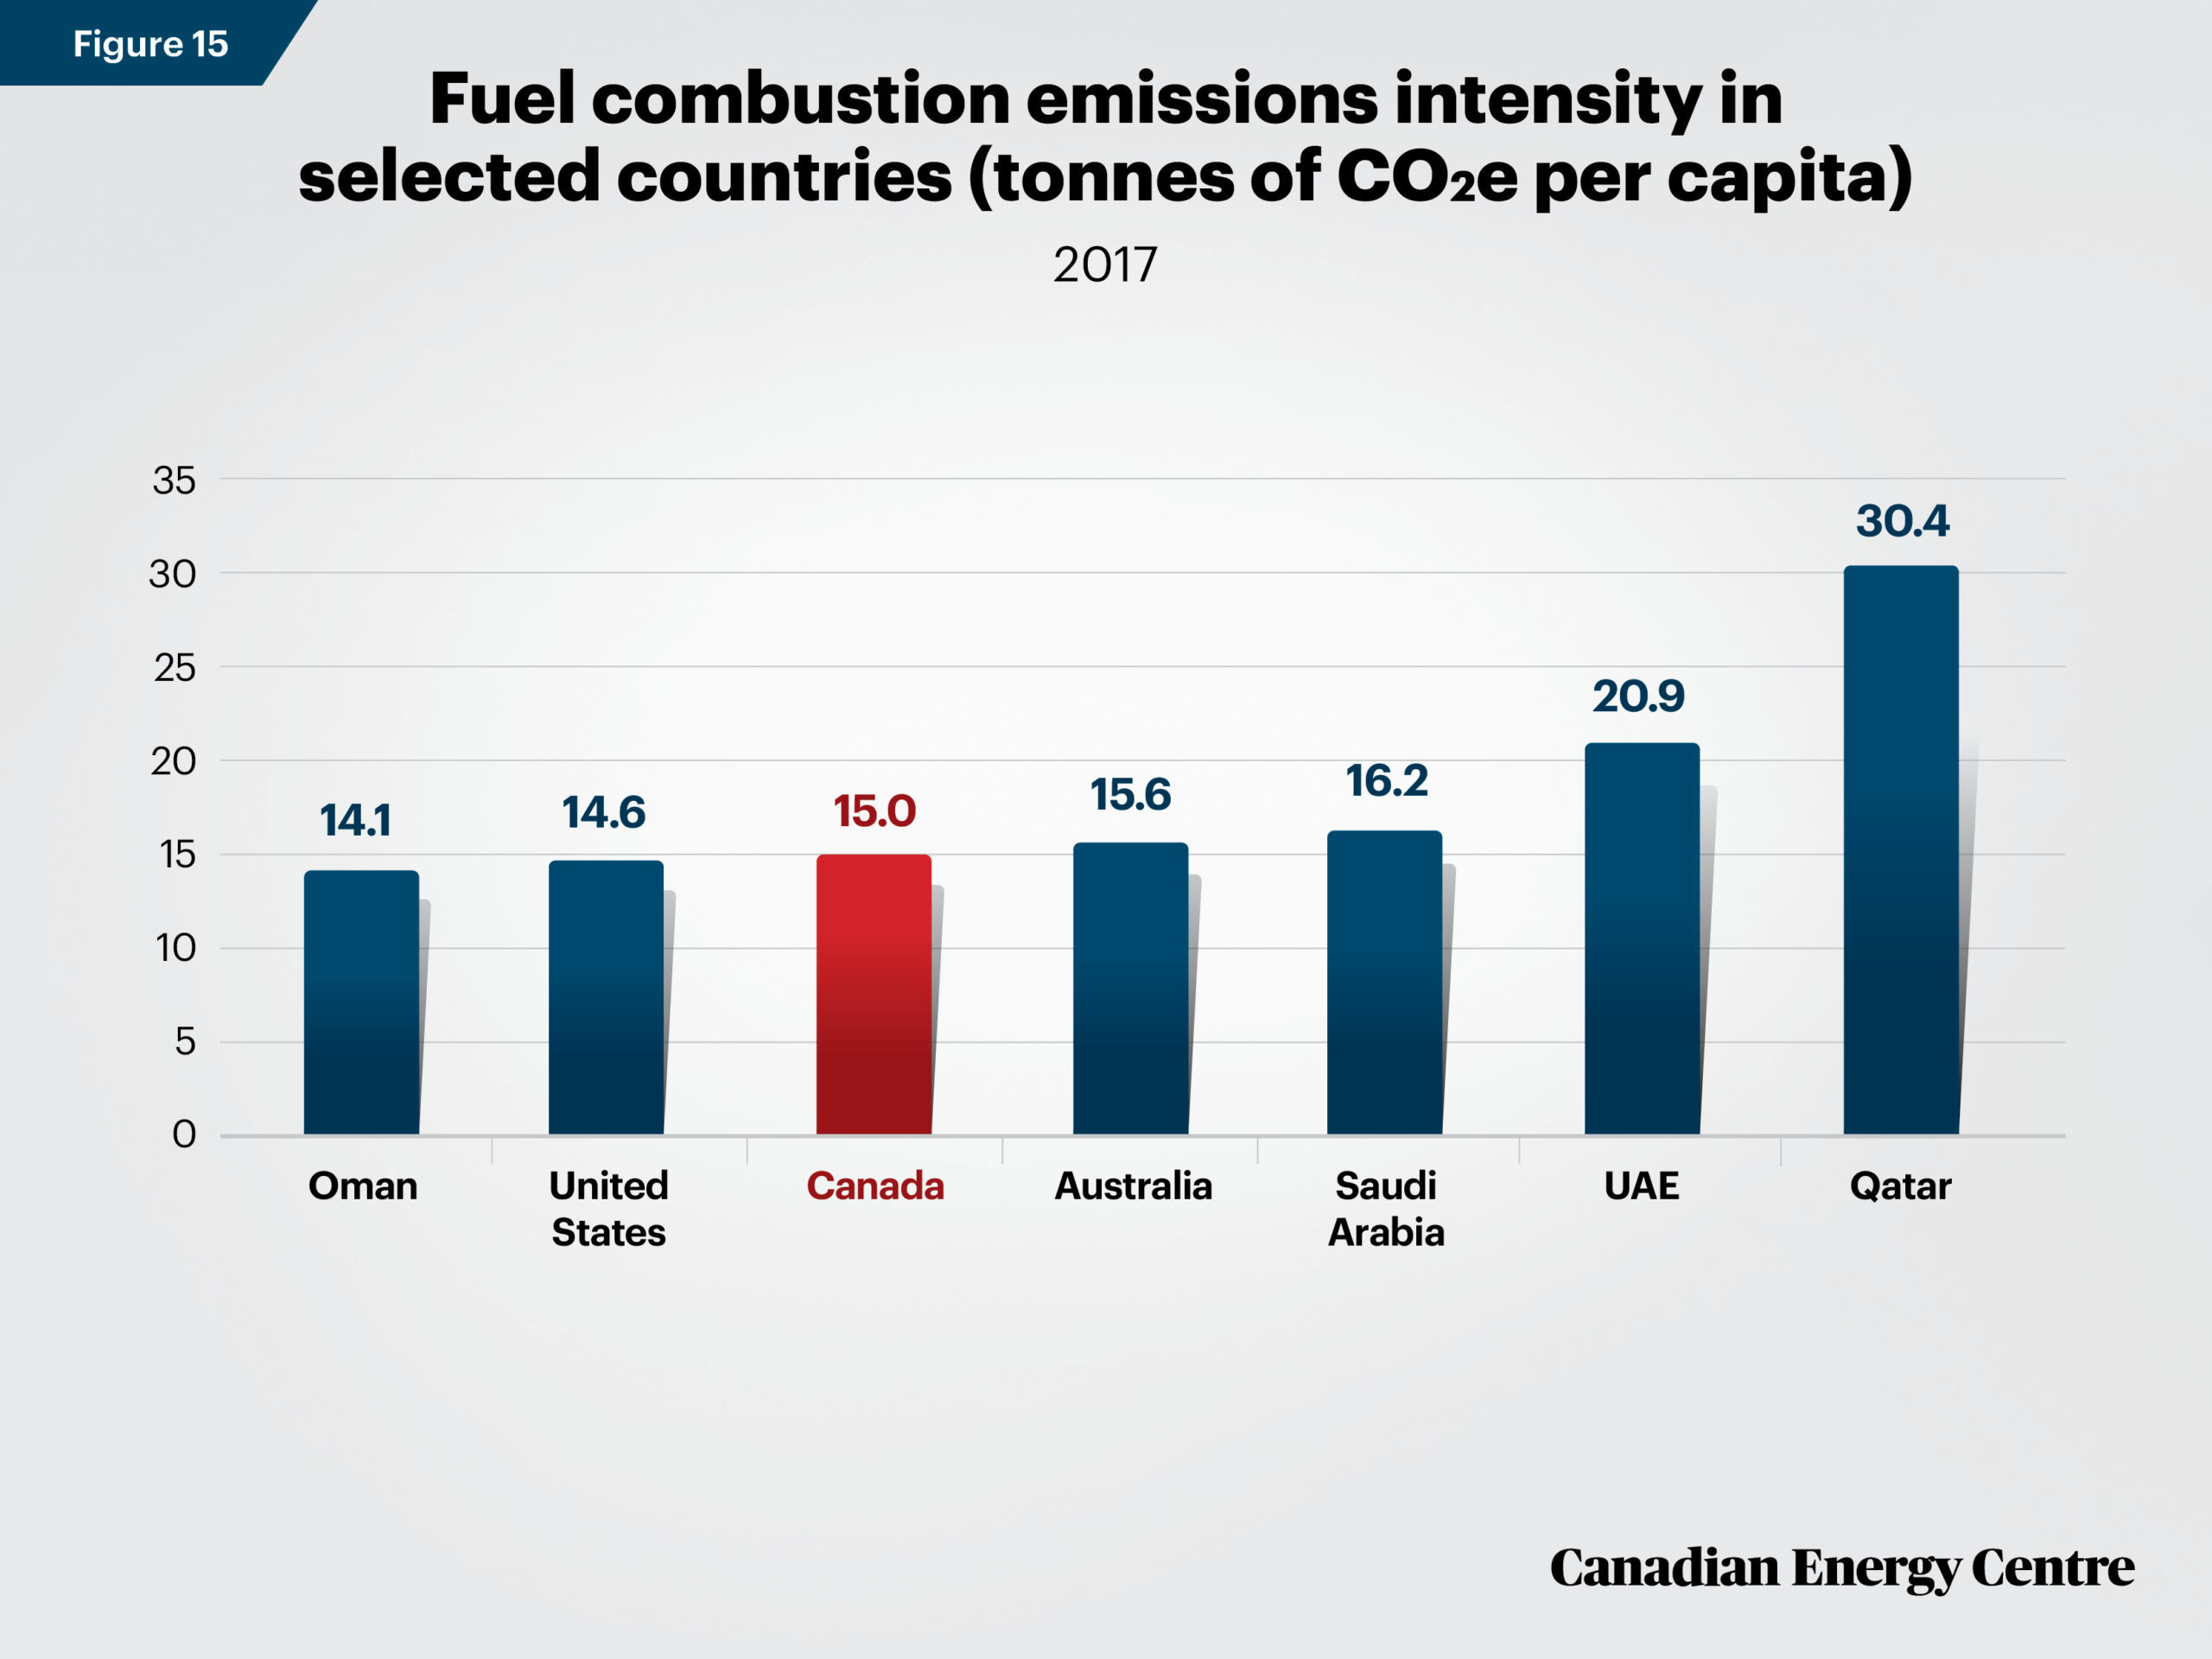
Source: International Energy Agency (2020).
Industrial fuel combustion GHG emissions intensity in Canada: Falling
Between 2000 and 2017, the GHG fuel combustion emissions intensity from Canada’s industrial sector fell from 0.073 kg of CO2e per PPP in 2010 US dollars of GDP to 0.042 kg, a decline of 42 per cent (see Figure 16) (International Energy Agency, 2020).
Source: International Energy Agency (2020).
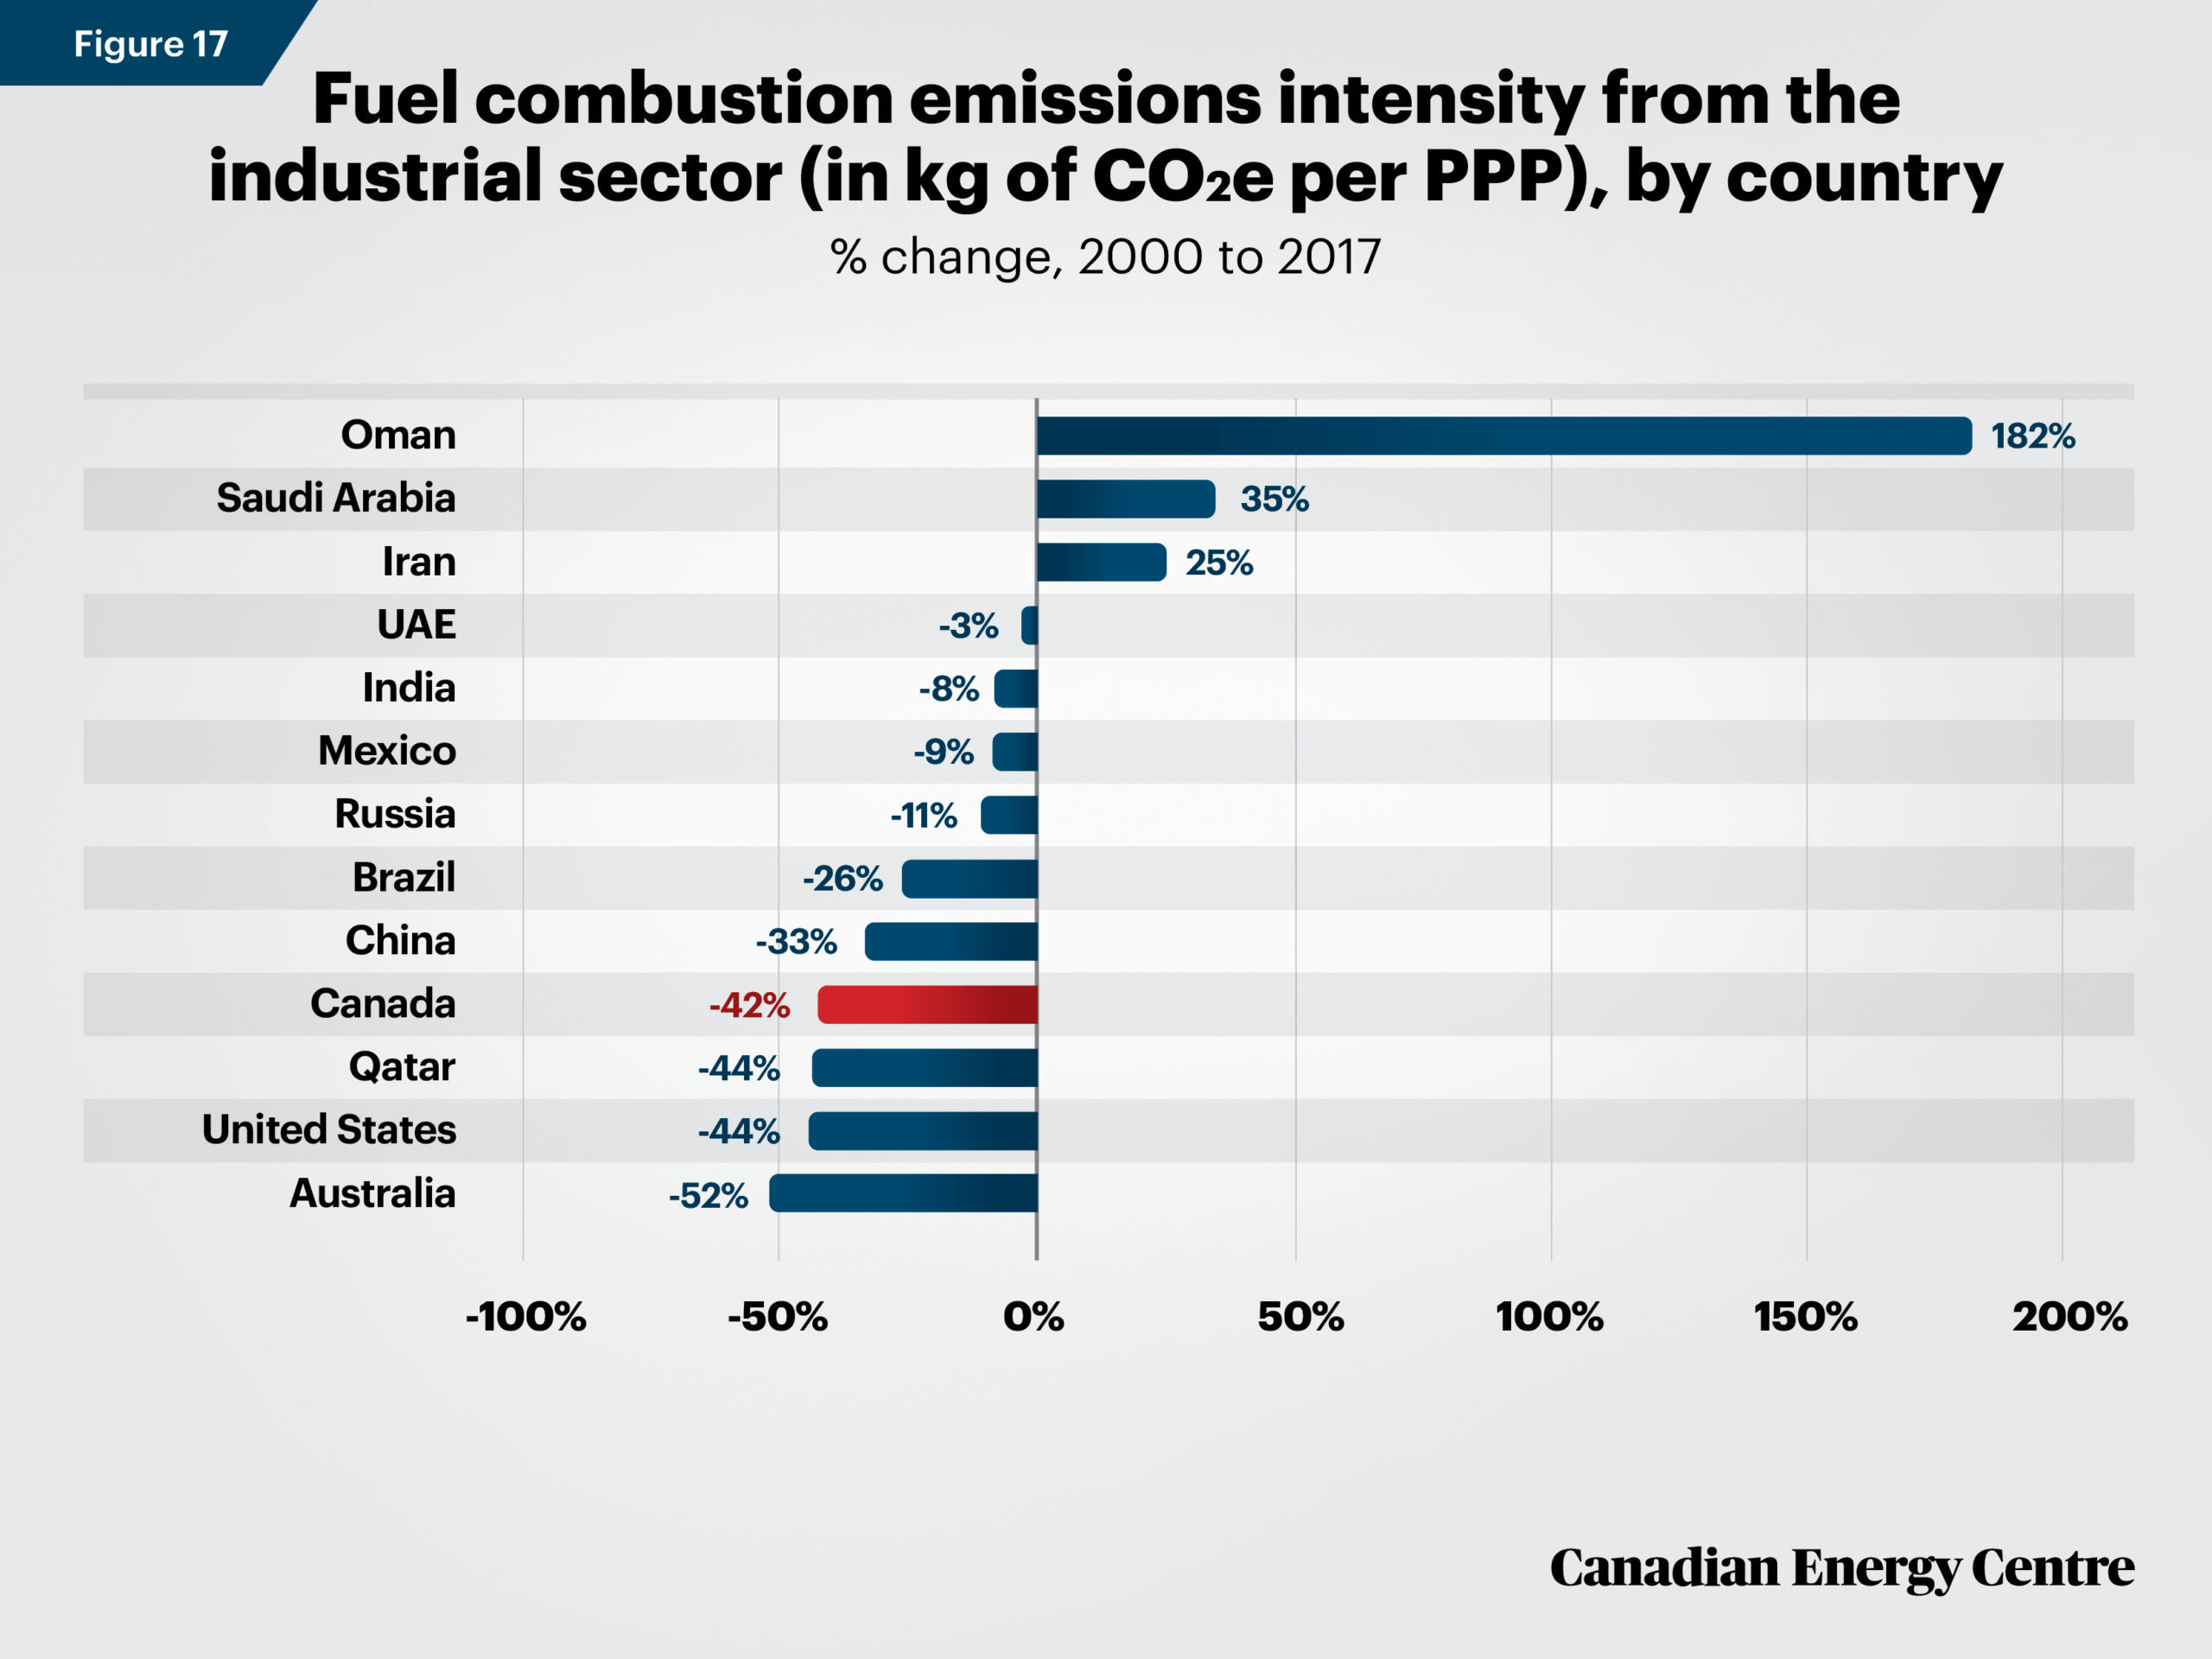
By comparison, the GHG fuel combustion emissions from the industrial sector expressed in kg of CO2e per PPP in 2010 US dollars of GDP ranged from a reduction of 52 per cent in Australia to an increase of 182 per cent in Oman over the same period (see Figure 17) (International Energy Agency, 2020).
Source: International Energy Agency (2020).
In 2017, the GHG fuel combustion emissions intensity from Canada’s industrial sector expressed in kg CO2e per PPP in 2010 US dollars of GDP was slightly higher than Australia, but lower than in India, Iran, Oman, Qatar, Russia, Saudi Arabia, and the United Arab Emirates, among others (see Figure 18) (International Energy Agency, 2020).
Source: International Energy Agency (2020).
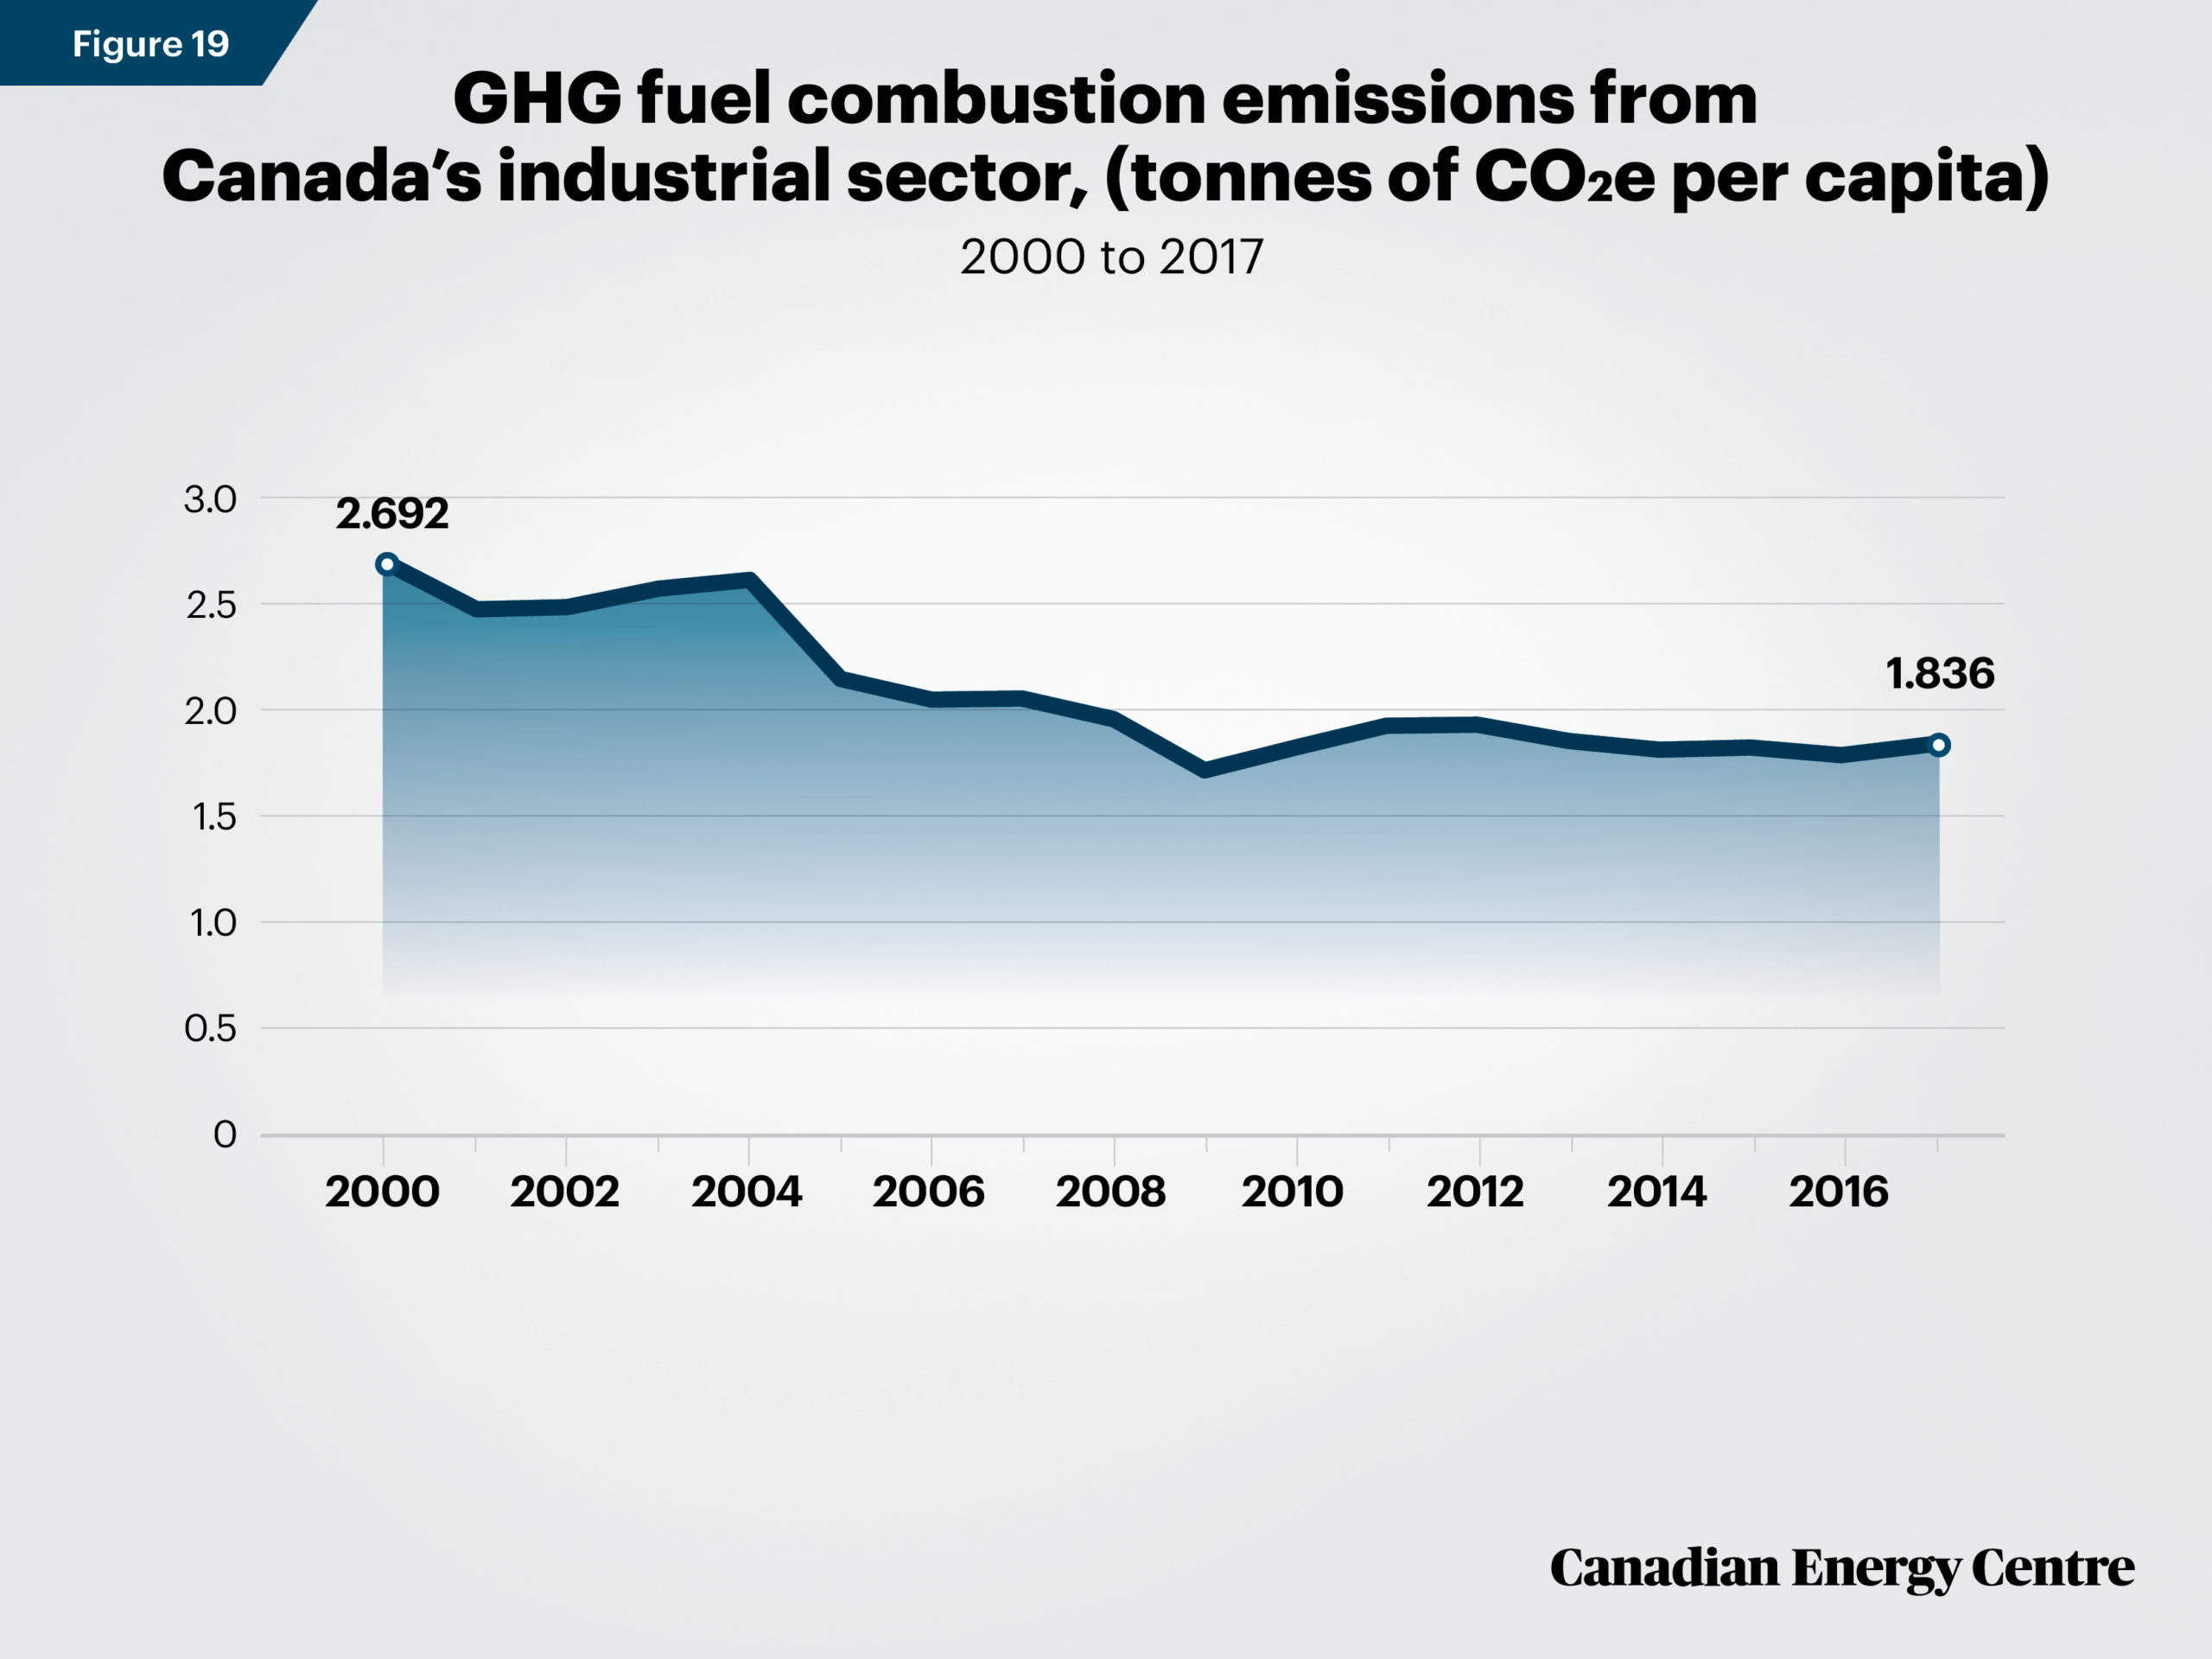
Between 2000 and 2017, the fuel combustion emissions intensity from Canada’s industrial sector fell from 2.692 tonnes of CO2e per capita to 1.836 tonnes of CO2e per capita, a decline of nearly 32 per cent (see Figure 19) (International Energy Agency, 2020).
Source: International Energy Agency (2020).
By comparison, the range of fuel combustion emissions intensity reductions and increases in the industrial sector of comparator countries expressed in tonnes of CO2e per capita range from a 39 per cent reduction in Qatar to an increase of 176 per cent in China over the same period (see Figure 20) (International Energy Agency, 2020).
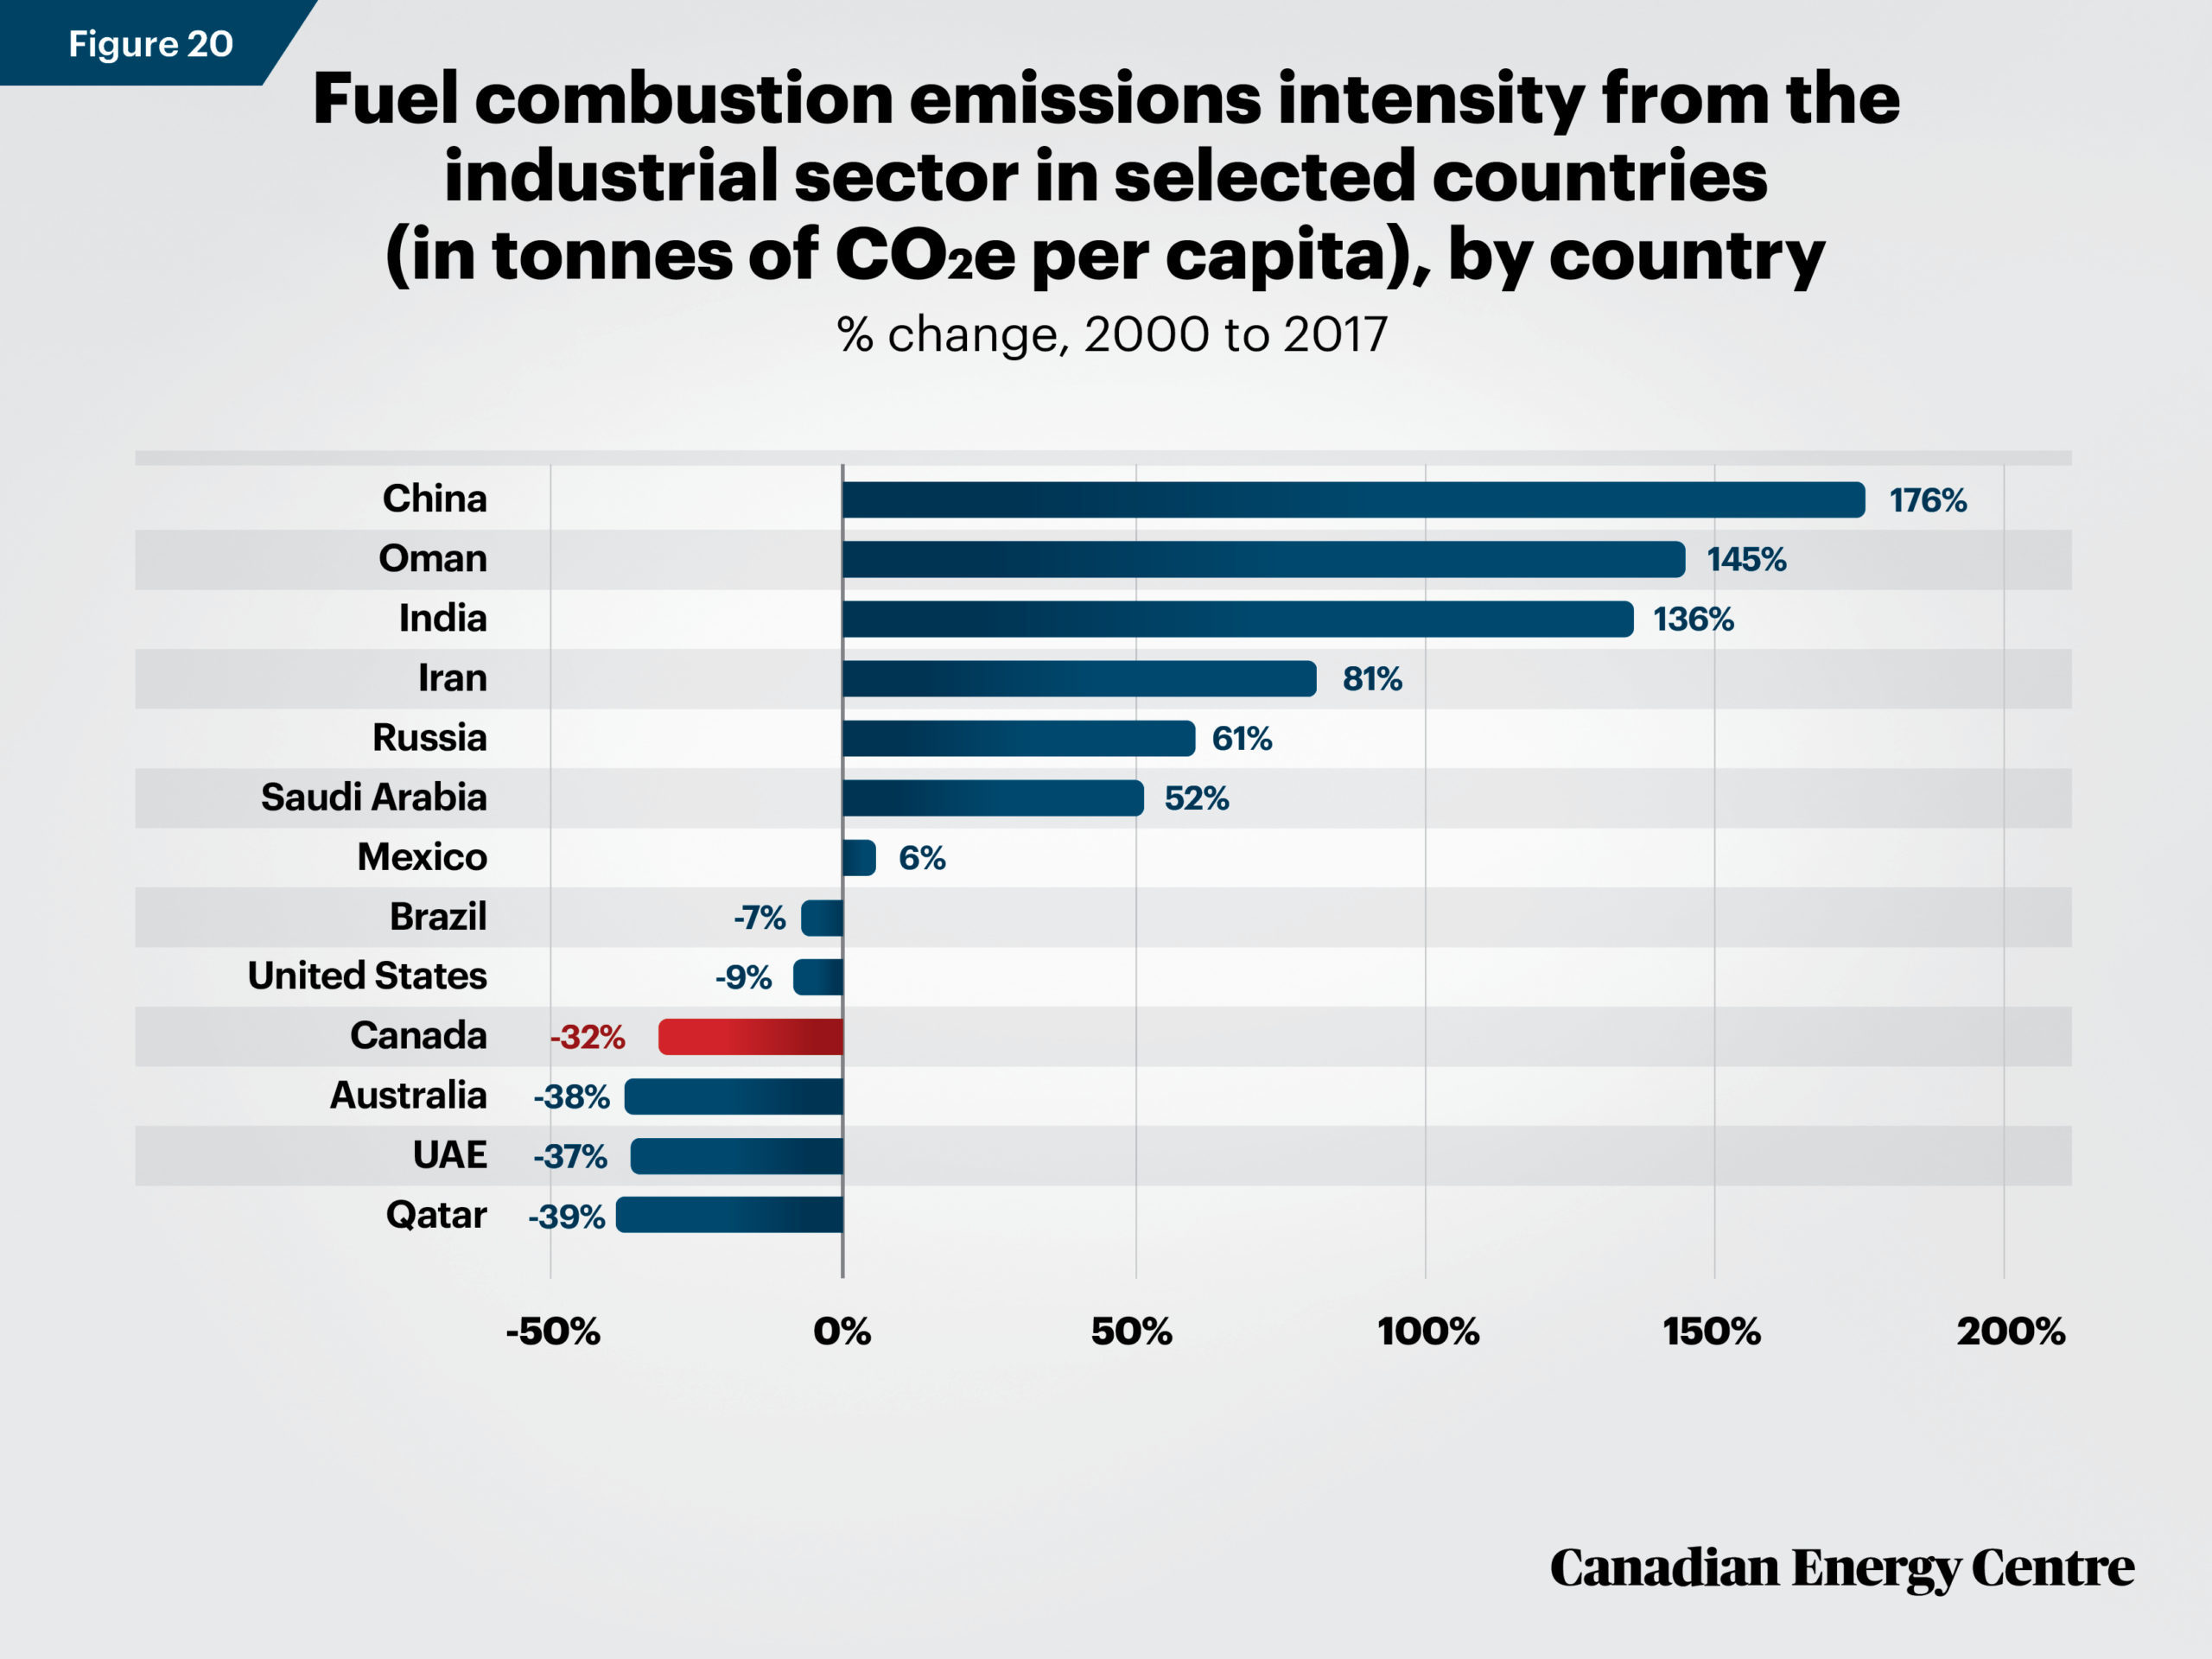
Source: International Energy Agency (2020).
In 2017, Canada’s fuel combustion emissions intensity from the industrial sector expressed in tonnes of CO2e per capita were higher than in the United States, Australia, and Russia, but lower than in China, Oman, Qatar, Saudi Arabia, and the United Arab Emirates (see Figure 21) (International Energy Agency, 2020)
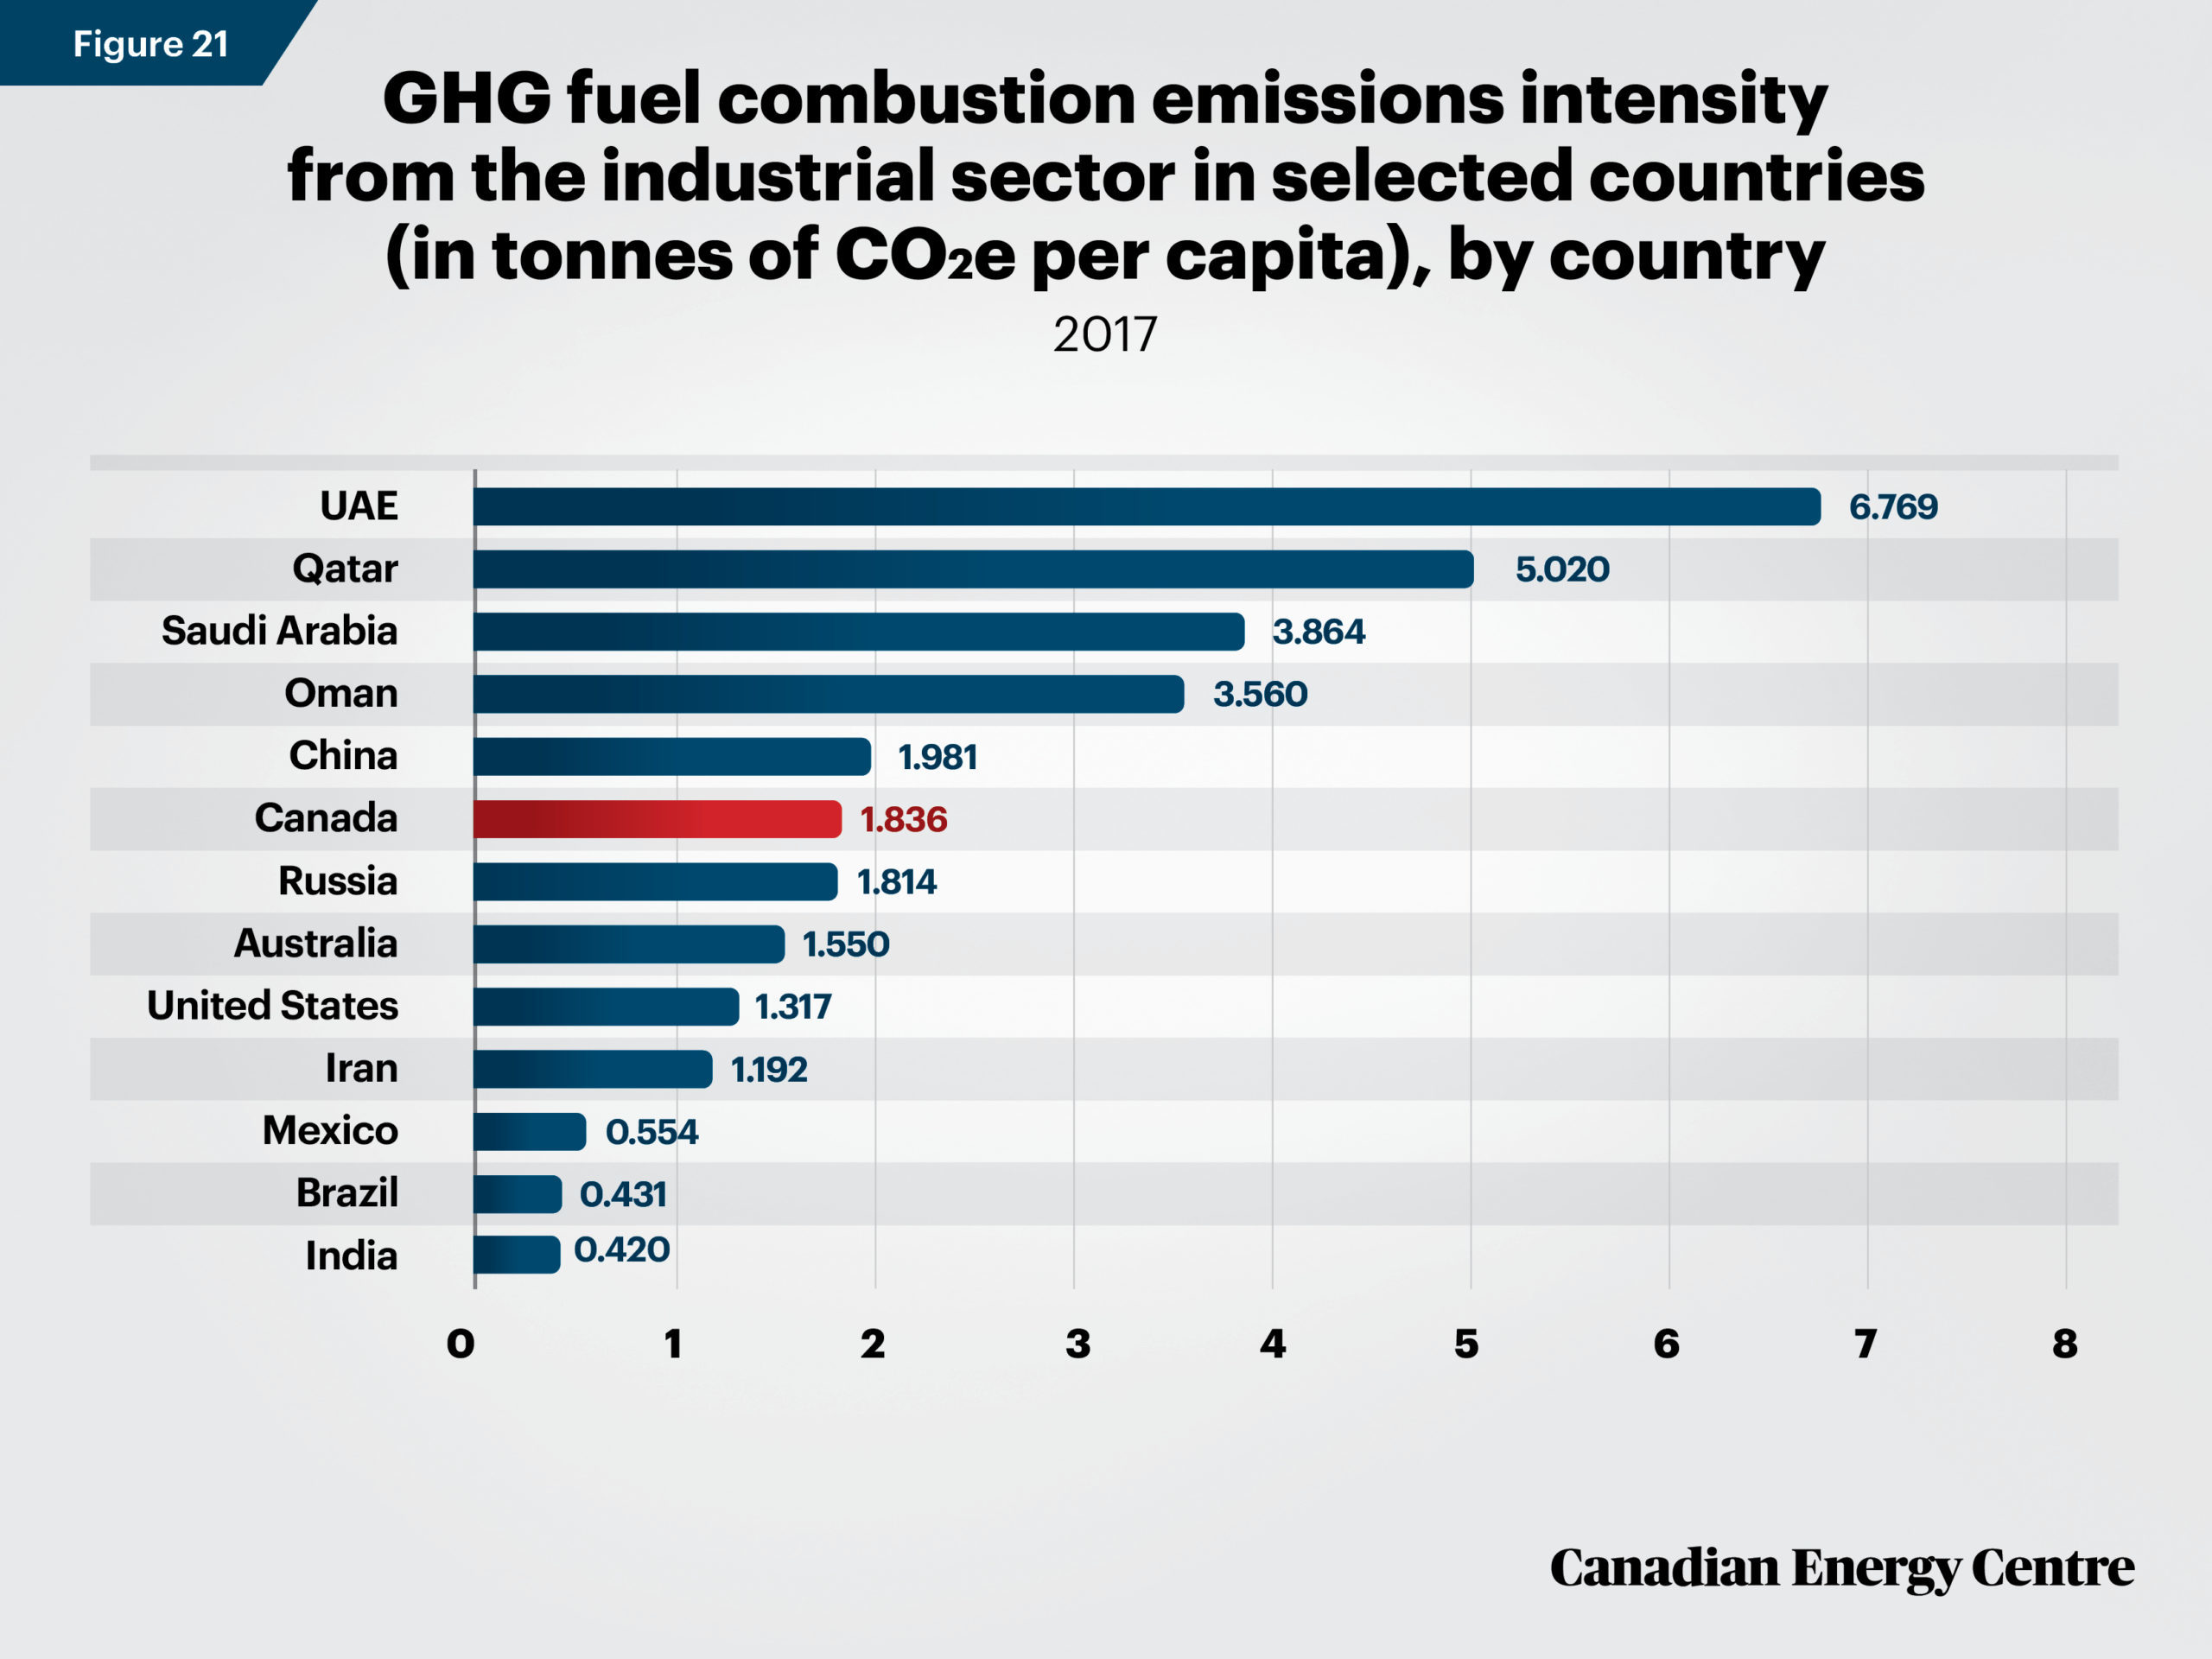
Source: International Energy Agency (2020).
Oil sands emissions intensity: Falling
Over the past decade, there has been a marked improvement in GHG emissions intensities (i.e. upstream GHG emissions associated with oil sands extraction and primary processing), for commonly traded Canadian oil sands crudes.
• Between 2011 and 2018, the crude production GHG emissions intensity of Alberta oil sands commonly exported to the United States fell from 0.086 tonnes of CO2e per barrel to 0.067 tonnes, a decline of about 22 percent (see Figure 22) (Alberta, 2019).
• Between 2011 and 2018, the crude production GHG emissions intensity of Alberta in-situ oil sands commonly exported to the United States fell from 0.079 tonnes of CO2e per barrel to 0.070 tonnes, a decline of about 11 per cent (see Figure 23) (Alberta, 2019).
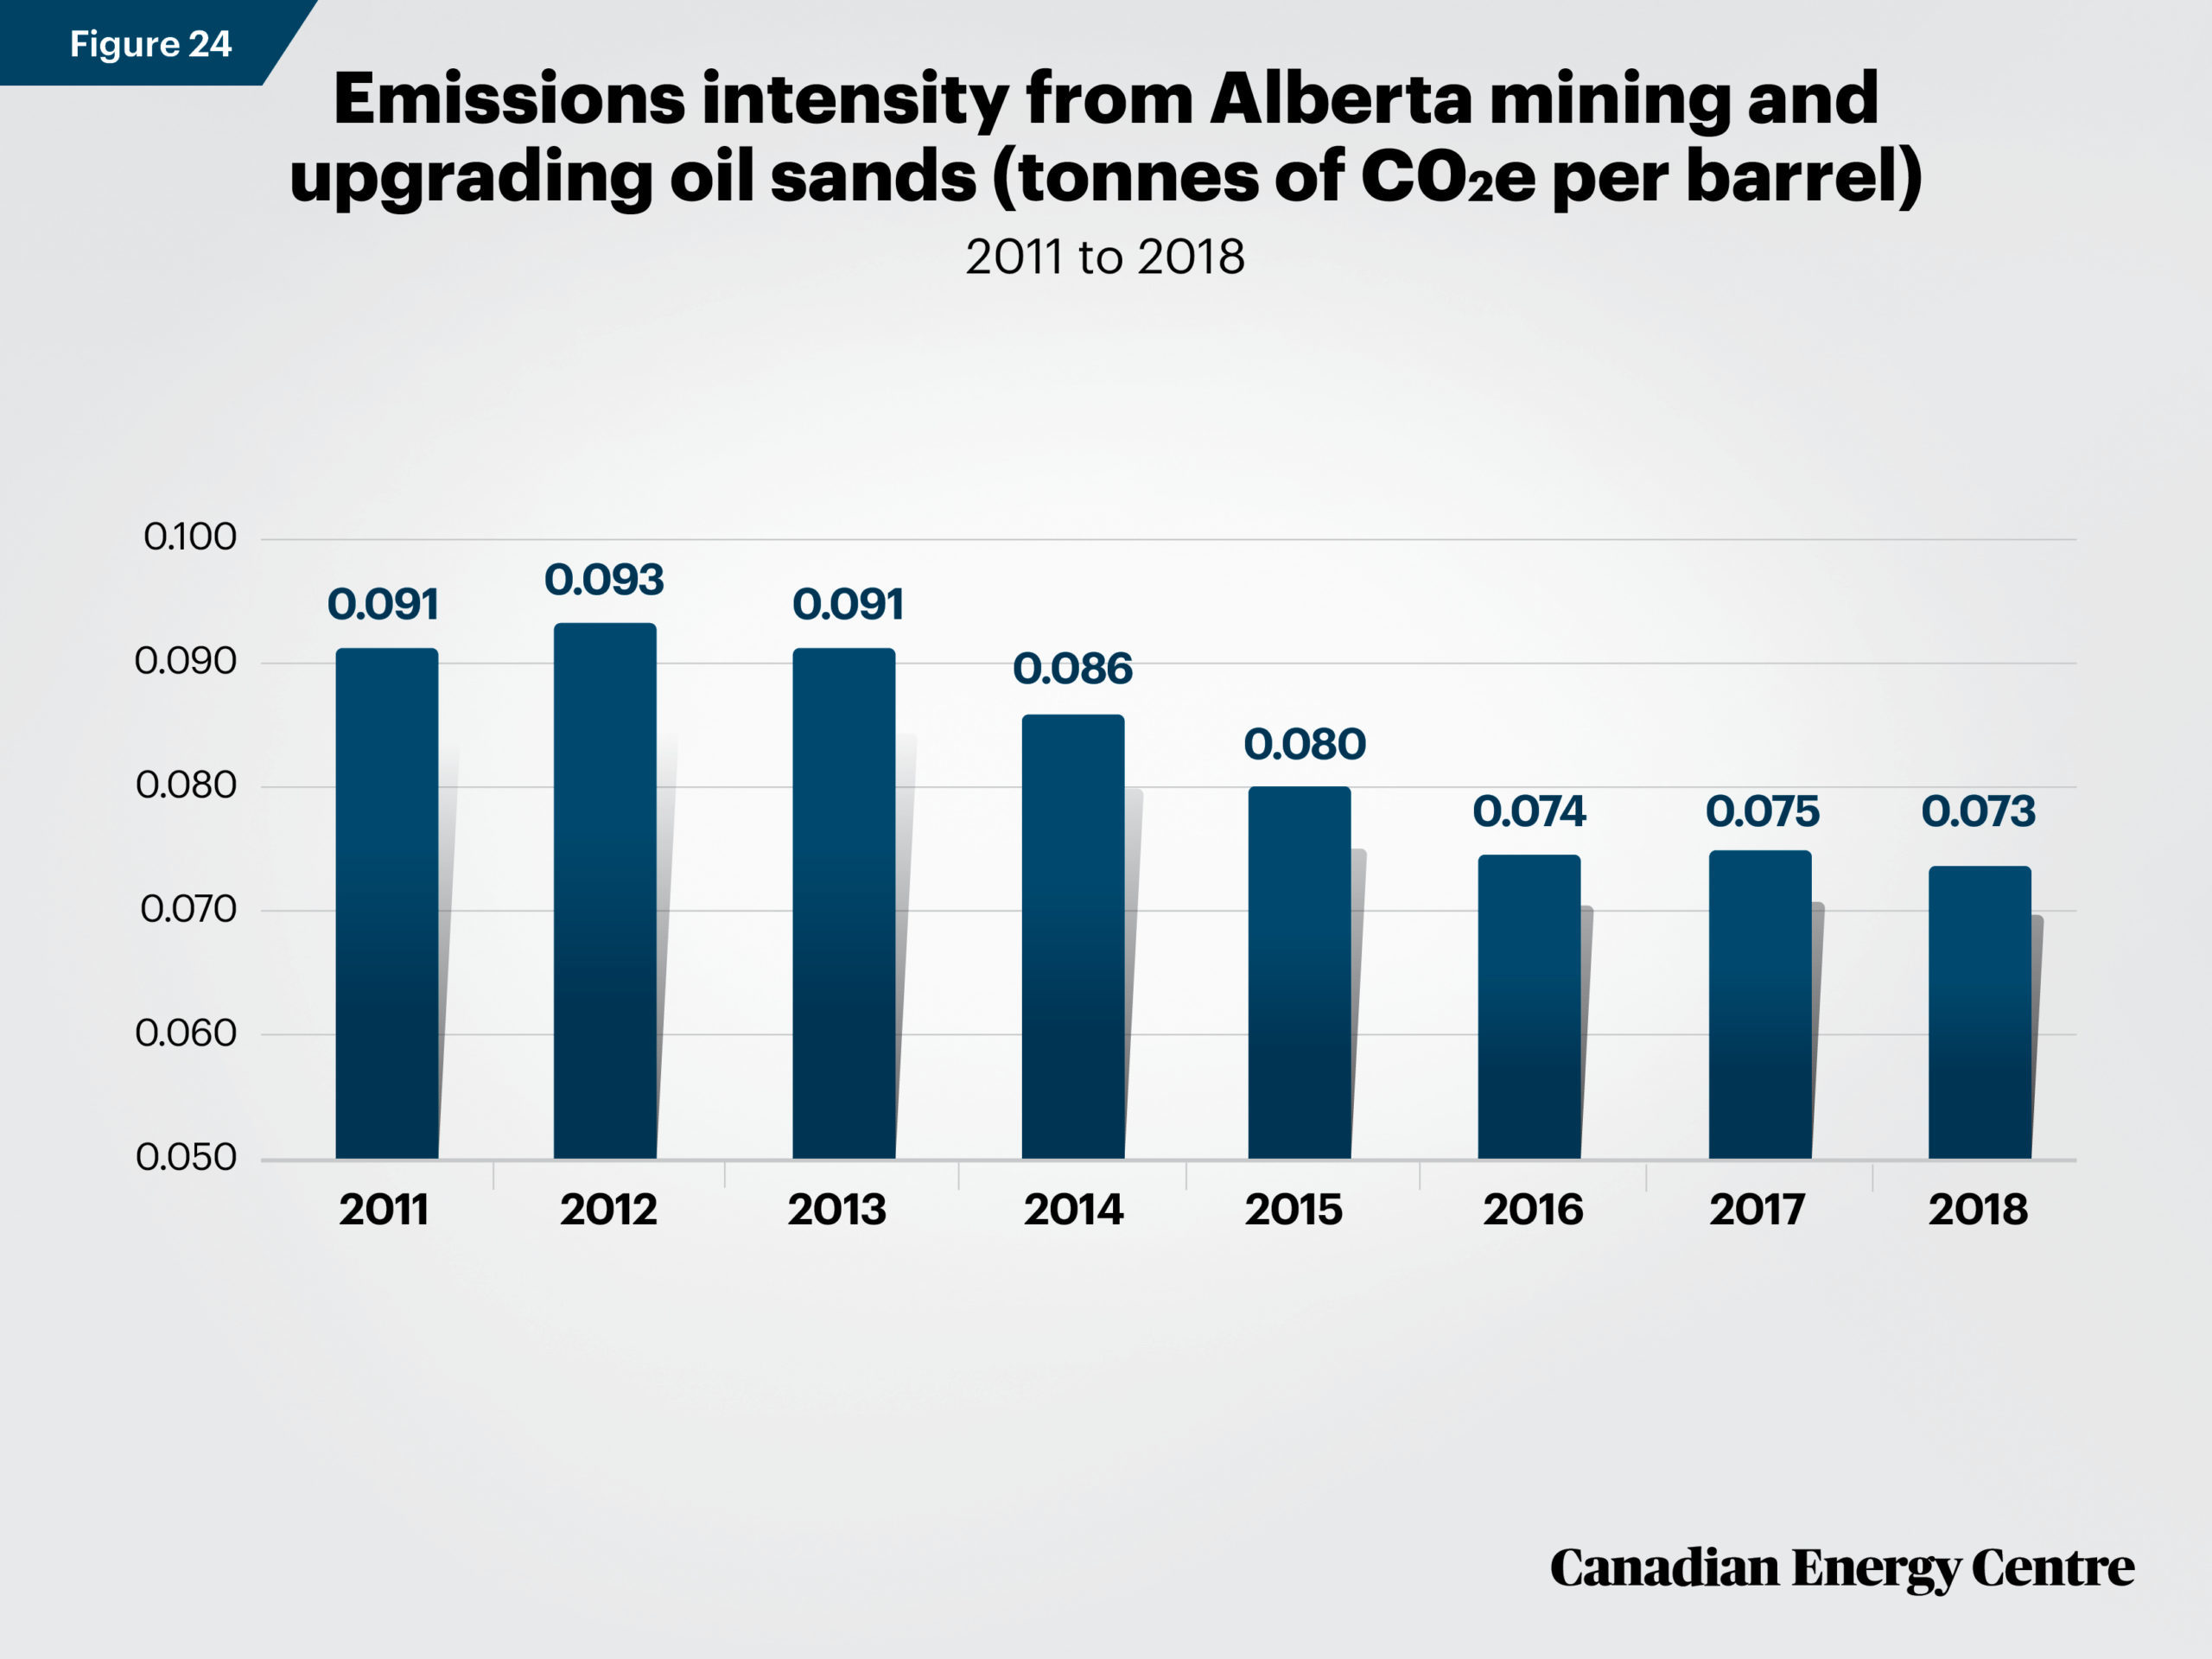
• Between 2011 and 2018, the crude production GHG emissions intensity of Alberta mining and upgrading oil sands commonly exported to the United States fell from 0.091 tonnes of CO2e per barrel to 0.073 tonnes, a decline of about 20 per cent (see Figure 24) (Alberta, 2019).
• According to IHS Markit, the overall weighted average of the upstream GHG intensity of Canadian oil sands (includes steam-assisted gravity drainage, mined synthetic crude oil, mined dilbit, primary, experimental, and enhanced oil recovery) continued to decline in 2018— falling 2 per cent from 72 kilograms of carbon dioxide equivalent per barrel (kgCO2e/bbl) in 2017 to 70 kgCO2e/bbl in 2018. This is about 20 per cent, or about 17 kgCO2e/bbl lower, than a decade earlier in 2009 (IHS Markit, 2020).
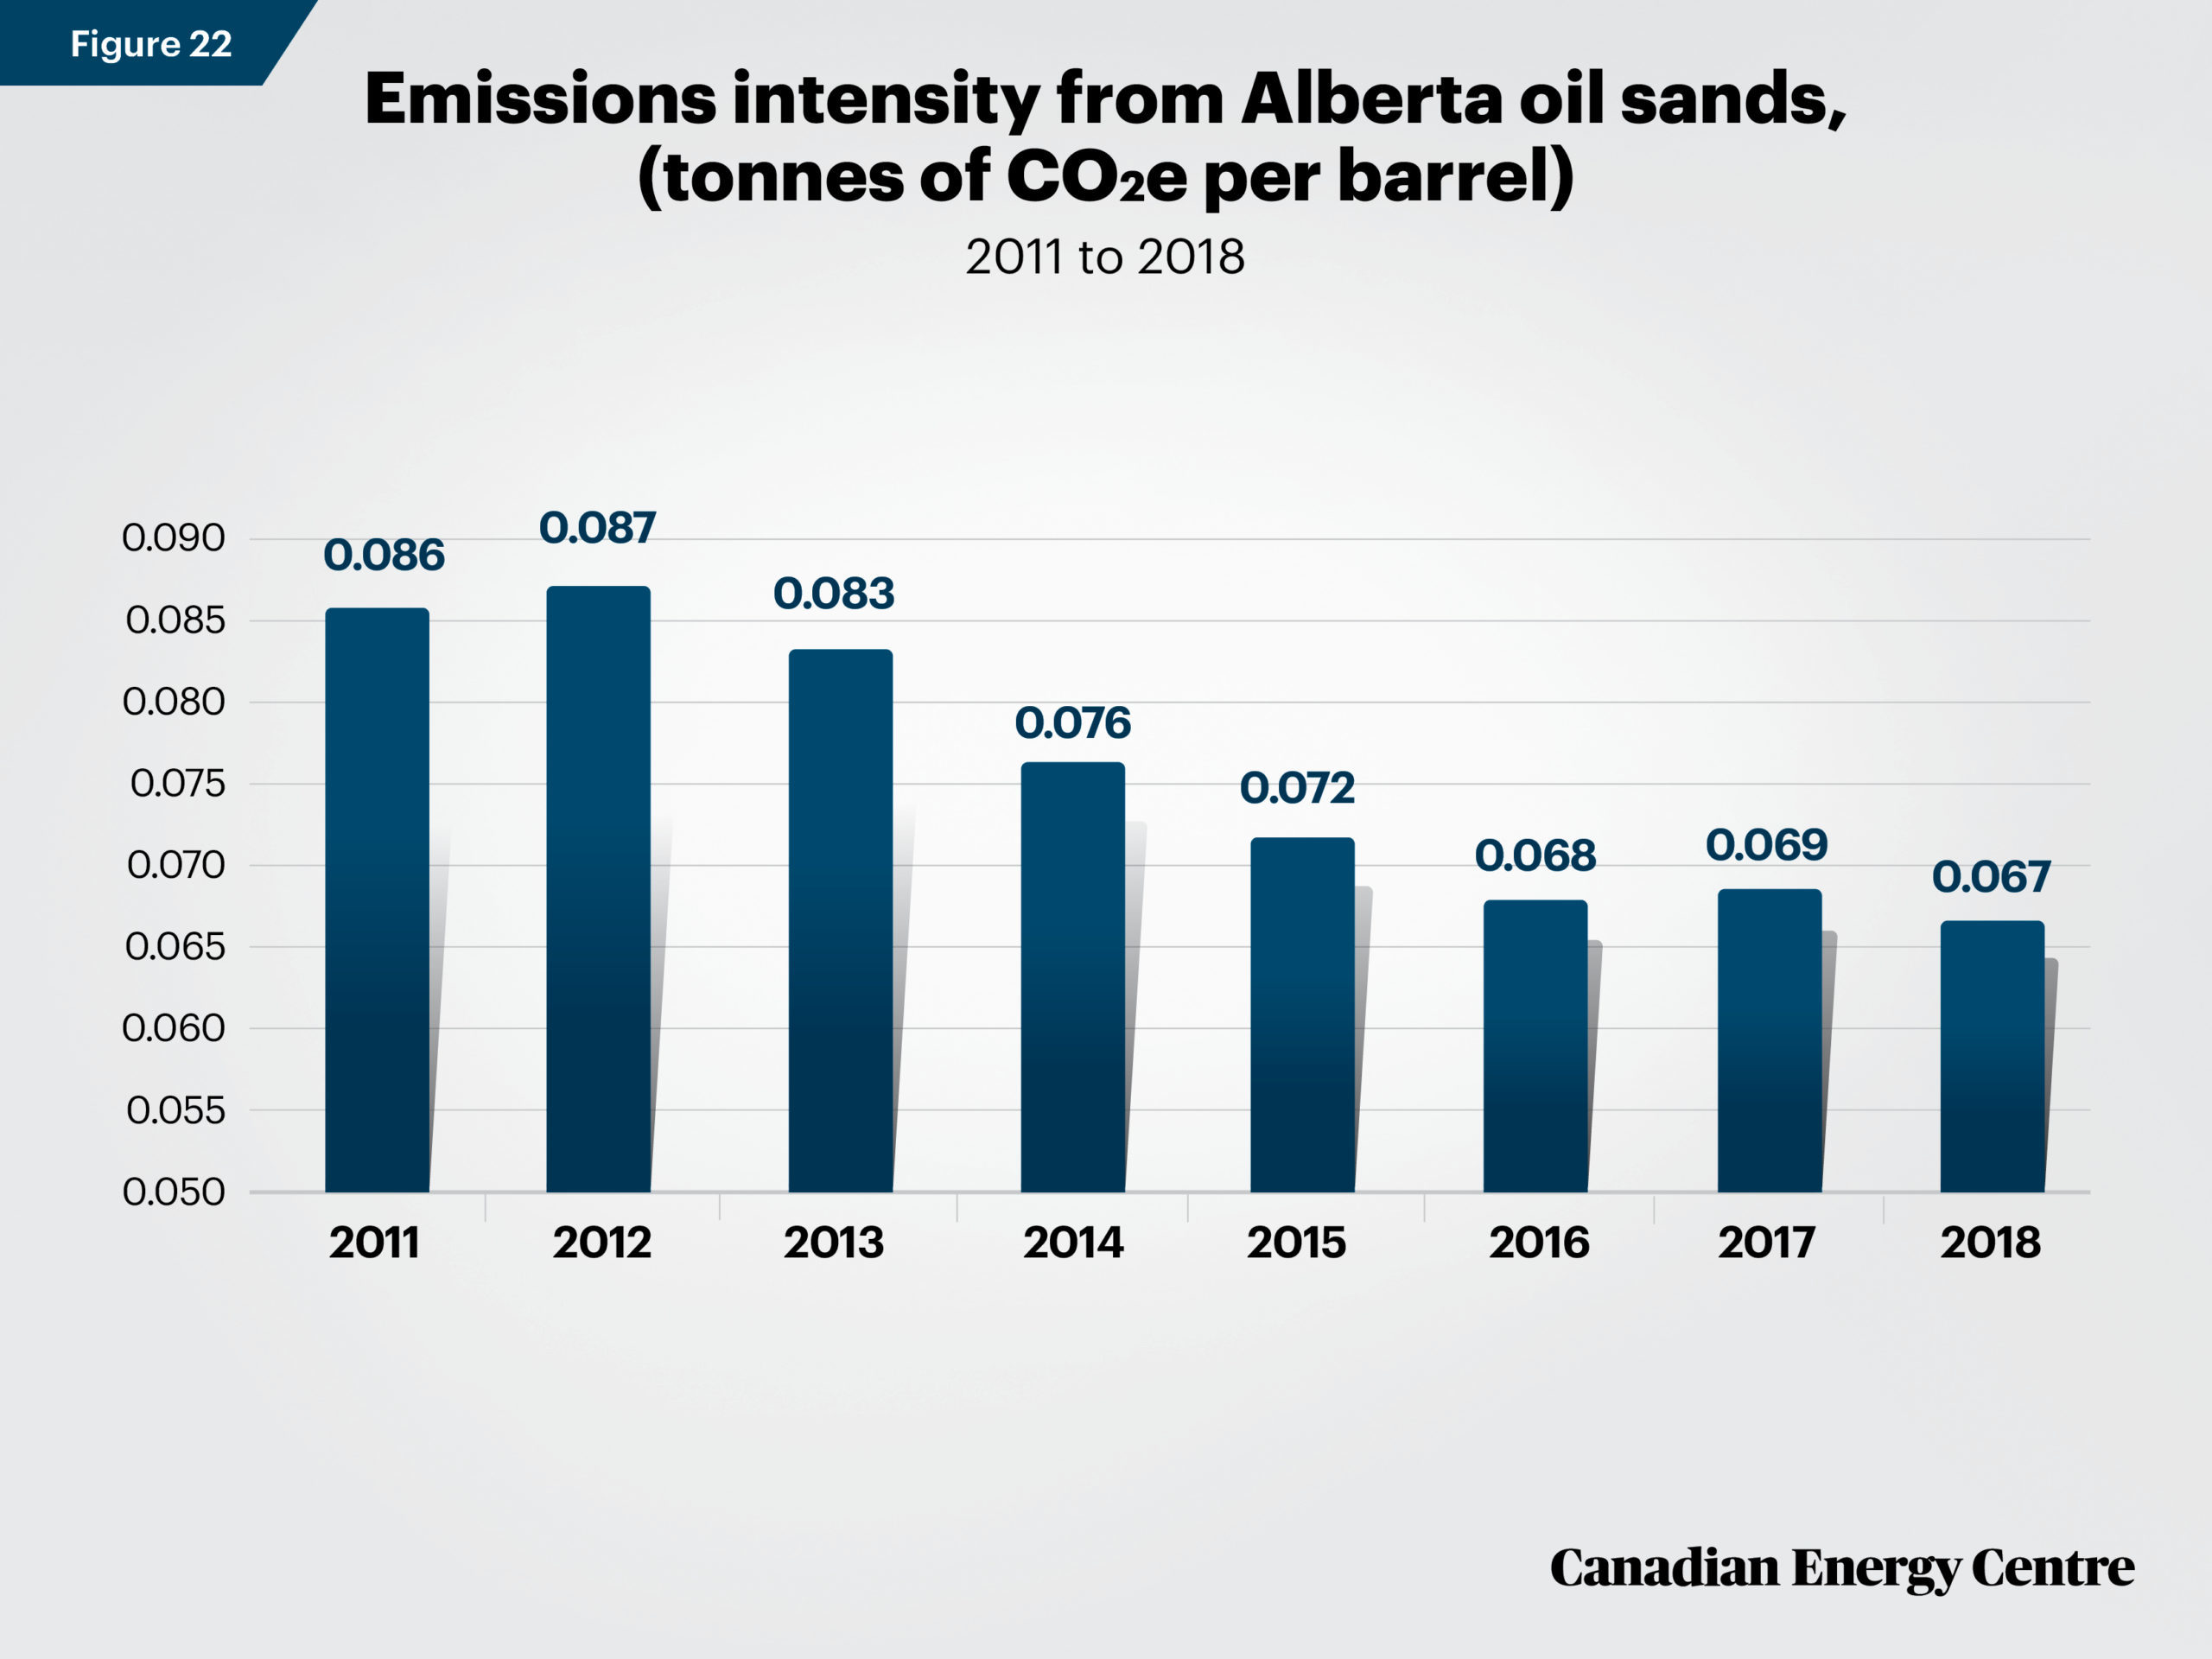
Source: Alberta Oil Sands Greenhouse Gas Emission Intensity Analysis (2019).
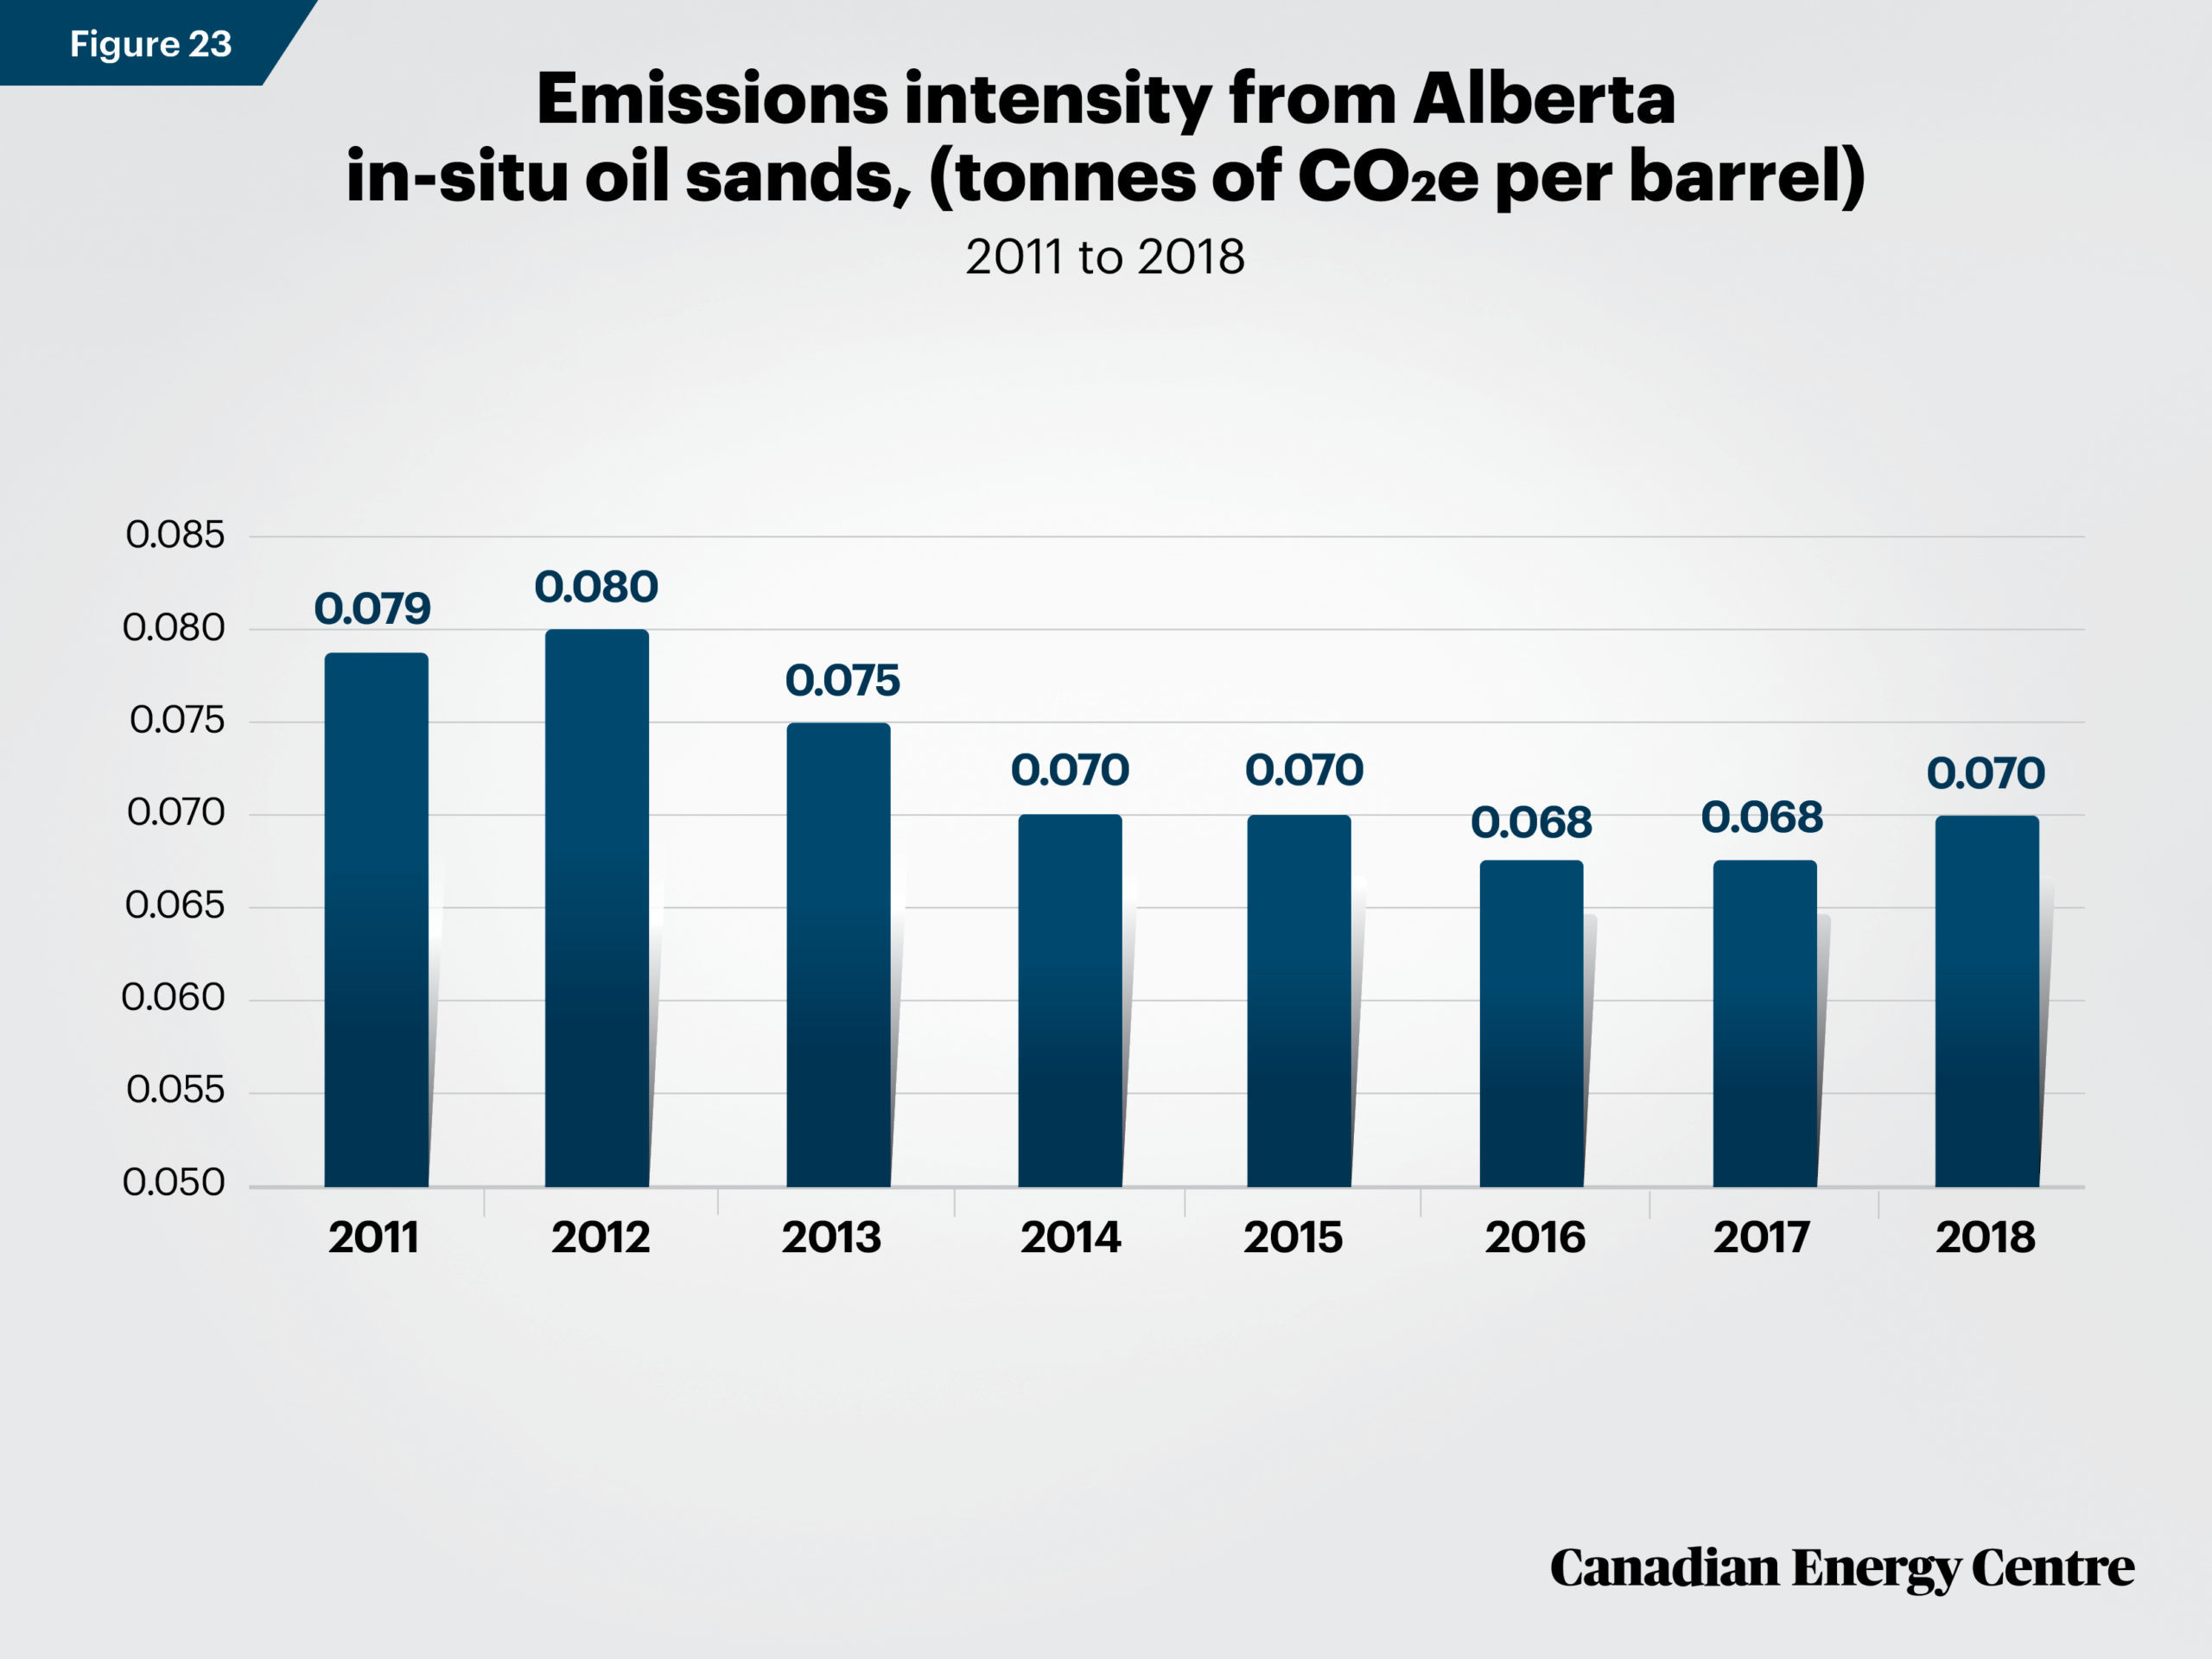
Source: Alberta Oil Sands Greenhouse Gas Emission Intensity Analysis (2019).
Source: Alberta Oil Sands Greenhouse Gas Emission Intensity Analysis (2019).
Alberta oil sands now emit only about 4 to 6 per cent more than the global average of crude oils from production to end-use
Average life-cycle intensity of the Canadian oil sands in 2018 to range from 1.6 per cent below the U.S. average (the lowest to date) to 19 per cent above
An analysis of the amount of GHG emissions per unit of output over the life and use of the product — production, transportation, refining, and end use — is known as “lifecycle analysis” (LCA) of GHG emissions intensity. Crude oil is not homogenous and the differences in properties, geography, geology, and among operators, give rise to differences in emissions.
IHS Markit found the average life-cycle intensity of the Canadian oil sands in 2018 to range from 1.6 per cent below the US average (the lowest to date) to 19 per cent above (IHS Markit, 2020).
Furthermore, IHS Markit notes that GHG emissions intensity of the Canadian oil sands has continued to decline as new lower GHG emissions intensity forms of production increased output and as legacy mining operations saw their intensities improve (or “made improvements that led to improved intensities”) (IHS Markit, 2020).
According to BMO, with GHG intensity down about 24 per cent since 2012, the oil sands now emit just 4 to 6 per cent more than the global average of crude oils, from production to end use, and several projects already boast below average carbon footprints (BMO Capital Markets, 2020).
Part III: What about the Future?
According to IHS Markit’s 2018 study, by 2030 the deployment of commercial and near-commercial technologies and efficiencies could result in a 17 to 27 percent reduction in the GHG intensity of steam-assisted gravity drainage operations (which accounted for 45 percent of oil sands supply in 2017) and a 15 to 20 percent reduction in the GHG intensity of mined oil sands. On a full life-cycle basis (inclusive of emissions from production to combustion), these upstream intensities would place these sources within 2–4 percent and 5–7 percent of the average crude oil refined in the United States, respectively (IHS Markit, 2018).
The base emissions forecast from BMO Capital Markets implies that average oil sands emissions intensity in Alberta could improve by at least another 17 percent, or about 1.7 percent per year by 2030, to about 62 kgCO2e per barrel. This trend is led by improvements in SAGD efficiencies and less carbon intensive PFT (Paraffinic Froth Treatment) bitumen mining, which will both be responsible for a growing portion of supply over time (BMO Capital Markets, 2020).
Assuming that the industry deploys promising emerging technologies, BMO Capital Markets anticipates that deployed, average emissions intensity could improve another 25 to 30 percent overall by 2040, to about 55 kg per barrel, roughly in line with the global average, with average SAGD intensity below the global average, at roughly 50 kg per barrel (BMO Capital Markets, 2020).
Conclusion: Canada Primed to Continue Reducing GHG Emissions Intensity
Data from a number of credible sources show that Canada’s oil and gas sector has been working to lower its GHG emissions intensity and is improving in comparison with other energyproducing and consuming countries.
Canada’s GHG emissions intensity per person, per unit of GDP, per unit of energy used, and per barrel of oil produced, have all been in decline over the past two decades.
Oil sands emissions intensity levels have been falling and are expected to continue to decline over the next two decades.
Despite some claims to the contrary, Canada and its energy sector are making progress in reducing emissions intensity and are primed to continue to do so in the future.
Definitions and Terminology
CO2: Carbon dioxide, or CO2, is a heat-trapping (greenhouse) gas, which is released through human activities such as deforestation and the burning of fossil fuels, as well as through natural processes.
CO2e: Carbon dioxide equivalent, or CO2e, is a term that describes different greenhouse gases in a common unit. For any quantity and type of greenhouse gas, CO2e signifies the amount of CO2 that would have the equivalent global warming impact.
Emissions intensity: Emissions intensity is the emission rate of a given pollutant relative to the intensity of a specific activity or industrial production process; for example, grams of carbon dioxide released per megajoule of energy produced, or the ratio of greenhouse gas emissions produced to gross domestic product (GDP). Emissions intensities are used to derive estimates of air pollutant or greenhouse gas emissions based on the amount of fuel combusted. Emissions intensities may also be used to compare the environmental impact of different fuels or activities.
GDP: Gross domestic product, or GDP, is the total value of goods produced and services provided in a country during one year.
GHGs: Greenhouse gas, or GHG, emissions are produced when hydrocarbons, such as oil and natural gas, are burned. GHGs include carbon dioxide (CO2), methane, nitrous oxide, and ozone, all of which contribute to climate change.
Kilograms (kg) of CO2e per barrel: A measure of emissions intensity, defined as absolute greenhouse gases emitted in kilograms divided by the number of barrels of oil.
Kilograms (kg) CO2e per purchasing power parity (PPP) in 2010 $US of GDP: A measure of emissions intensity to compare fuel combustion by country and the industrial sector, defined as absolute greenhouse gases emitted in kilograms divided by gross domestic product (GDP), converted to international dollars, with the international dollar having the same purchasing power over GDP as a US dollar has in the United States.
MT of CO2e: Megatonne, or MT of carbon dioxide equivalents, is the metric unit equivalent to 1 million tonnes of common units of greenhouse gases.
MT of CO2e per billion dollars of GDP: A measure of emissions intensity, defined as the absolute amount of greenhouse gases emitted in megatonnes divided by each billion dollars of gross domestic product (GDP).
PPP: Purchasing Power Parity, or PPP, is gross domestic product (GDP) converted to international dollars using purchasing power parity rates. An international dollar has the same purchasing power over GDP as a US dollar has in the United States.
Terajoules: A terajoule, or TJ, is a unit of energy in the International System of Units. Tera denotes a factor of a trillion, so there are 1,000,000,000,000 joules in a terajoule.
Tonnes of CO2e per capita or per person: A measure of emissions intensity to compare countries, defined as absolute greenhouse gases emitted in tonnes divided by the population of a country.
Tonnes of CO2e per TJ of energy used: A measure of emissions intensity to compare industrial sectors in Canada, defined as absolute greenhouse gases emitted in tonnes divided by the amount of fossil fuels used that can be attributed to the operations of the establishments of a specific industrial sector.
Tonnes of CO2e per million dollars of GDP: A measure of emissions intensity to compare countries, defined as absolute greenhouse gases emitted in tonnes divided by each million US dollars of gross domestic product.
Tonnes of CO2e per barrel: A measure of oil emissions intensity, defined as absolute greenhouse gases emitted in tonnes divided by the number of barrels of oil.
References as July 6, 2020
Alberta (2019). Alberta Oil Sands Greenhouse Gas Emission Intensity Analysis. <https://bit.ly/2Vc89oy>.
BMO Capital Markets (2020). The 400 Billion Barrel Opportunity for Friendly Oil, and Canada’s Evolving Role. <https://bit.ly/2Z32ySs>.
Environment and Climate Change Canada (2020a). National Inventory Report 1990-2018: Greenhouse Gas Sources and Sinks in Canada. <https://bit.ly/3e0mSJy>.
Environment and Climate Change Canada (2020b). Greenhouse Gas Emissions. <https://bit.ly/38qXPhO>.
Government of Canada (2020). Global Greenhouse Gas Emissions. <https://bit.ly/3f1aKJV>.
IHS Markit (2018). Greenhouse Gas Intensity of Oil Sands Production. <https://bit.ly/2VJiDvG>.
IHS Markit (2020). The GHG intensity of Canadian oil sands production: A new analysis. <https://bit.ly/2D2jrp5>.
International Energy Agency (2020). World CO2 Indicators. <https://bit.ly/3gspTnW>.
Natural Resources Canada (2020). Energy Efficiency Trends Analysis Tables. <https://bit.ly/3gsgwEB>.
Statistics Canada (2020a). Table 36-10-0369-01: Gross Domestic Product at 2012 Constant Prices, Expenditure-Based, Annual. <https://bit.ly/2Z0fg5y>.
Statistics Canada (2020b). Table 17-10-0005-01: Estimates of Population, by Age Group and Sex for July 1, Canada, Provinces and Territories, Annual. <https://bit.ly/38DlCeJ>.
World Resource Institute (2020). Historical GHG Emissions. <https://bit.ly/3hRfvYi>.
CEC Research Briefs
Canadian Energy Centre (CEC) Research Briefs are contextual explanations of data as they relate to Canadian energy. They are statistical analyses released periodically to provide context on energy issues for investors, policymakers, and the public. The source of profiled data depends on the specific issue, necessary context, and each brief.
About the authors
This CEC Research Brief was compiled by Lennie Kaplan, Chief Research Analyst at the Canadian Energy Centre and Mark Milke, Executive Director of Research for the Canadian Energy Centre: www.canadianenergycentre.ca.
Acknowledgements
The authors and the Canadian Energy Centre would like to thank and acknowledge the assistance of Dennis Sundgaard and two anonymous peer reviewers.
Creative Commons Copyright
Research and data from the Canadian Energy Centre (CEC) is available for public usage under creative commons copyright terms with attribution to the CEC. Attribution and specific restrictions on usage including non-commercial use only and no changes to material should follow guidelines enunciated by Creative Commons here: Attribution-NonCommercial-NoDerivs CC BY-NC-ND.