To sign up to receive the latest Canadian Energy Centre research to your inbox email: [email protected]
Download the PDF here
Download the charts here
Overview
With energy security becoming a major issue globally, the importance of the Canadian oil sands sector as a secure and reliable supplier of oil cannot be overstated.
The prospects for higher prices over the next few years could see Canadian oil sands sector performance metrics experience a profound turnaround from previous years. Improvements under higher oil prices have benefits for producers, federal and provincial governments, and all Canadians.
In this Fact Sheet, using the Rystad Energy UCube, we examine Canadian oil sands sector key performance metrics (free cash flow, capex and government take) under a reference oil price scenario and a high oil price scenario, over the next half decade.
Background on Rystad Energy UCube and energy price assumptions
Rystad Energy is an independent energy research company providing data, analytics and consultancy services to clients around the globe.
UCube is Rystad Energy’s global upstream database, including production and economics (costs, revenues, and valuations) for more than 80,000 assets, covering the portfolios of more than 3,500 companies.
The UCube data set is used to study all parts of the global exploration and production (E&P) activity value chain, including operational costs, investment (capex and opex), fiscal terms, and net cash flows for projects and companies, both globally and by country.
Under the UCube reference oil price case, WTI crude oil prices are estimated to average $69.02 U.S per barrel between 2021 and 2025 (see Figure 1).
Under the UCube high oil price case, WTI crude oil prices are estimated to average $110.79 U.S per barrel between 2021 and 2025 (see Figure 1).
The written content in this report has been prepared by the Canadian Energy Centre (CEC) and does not represent the views of Rystad Energy.
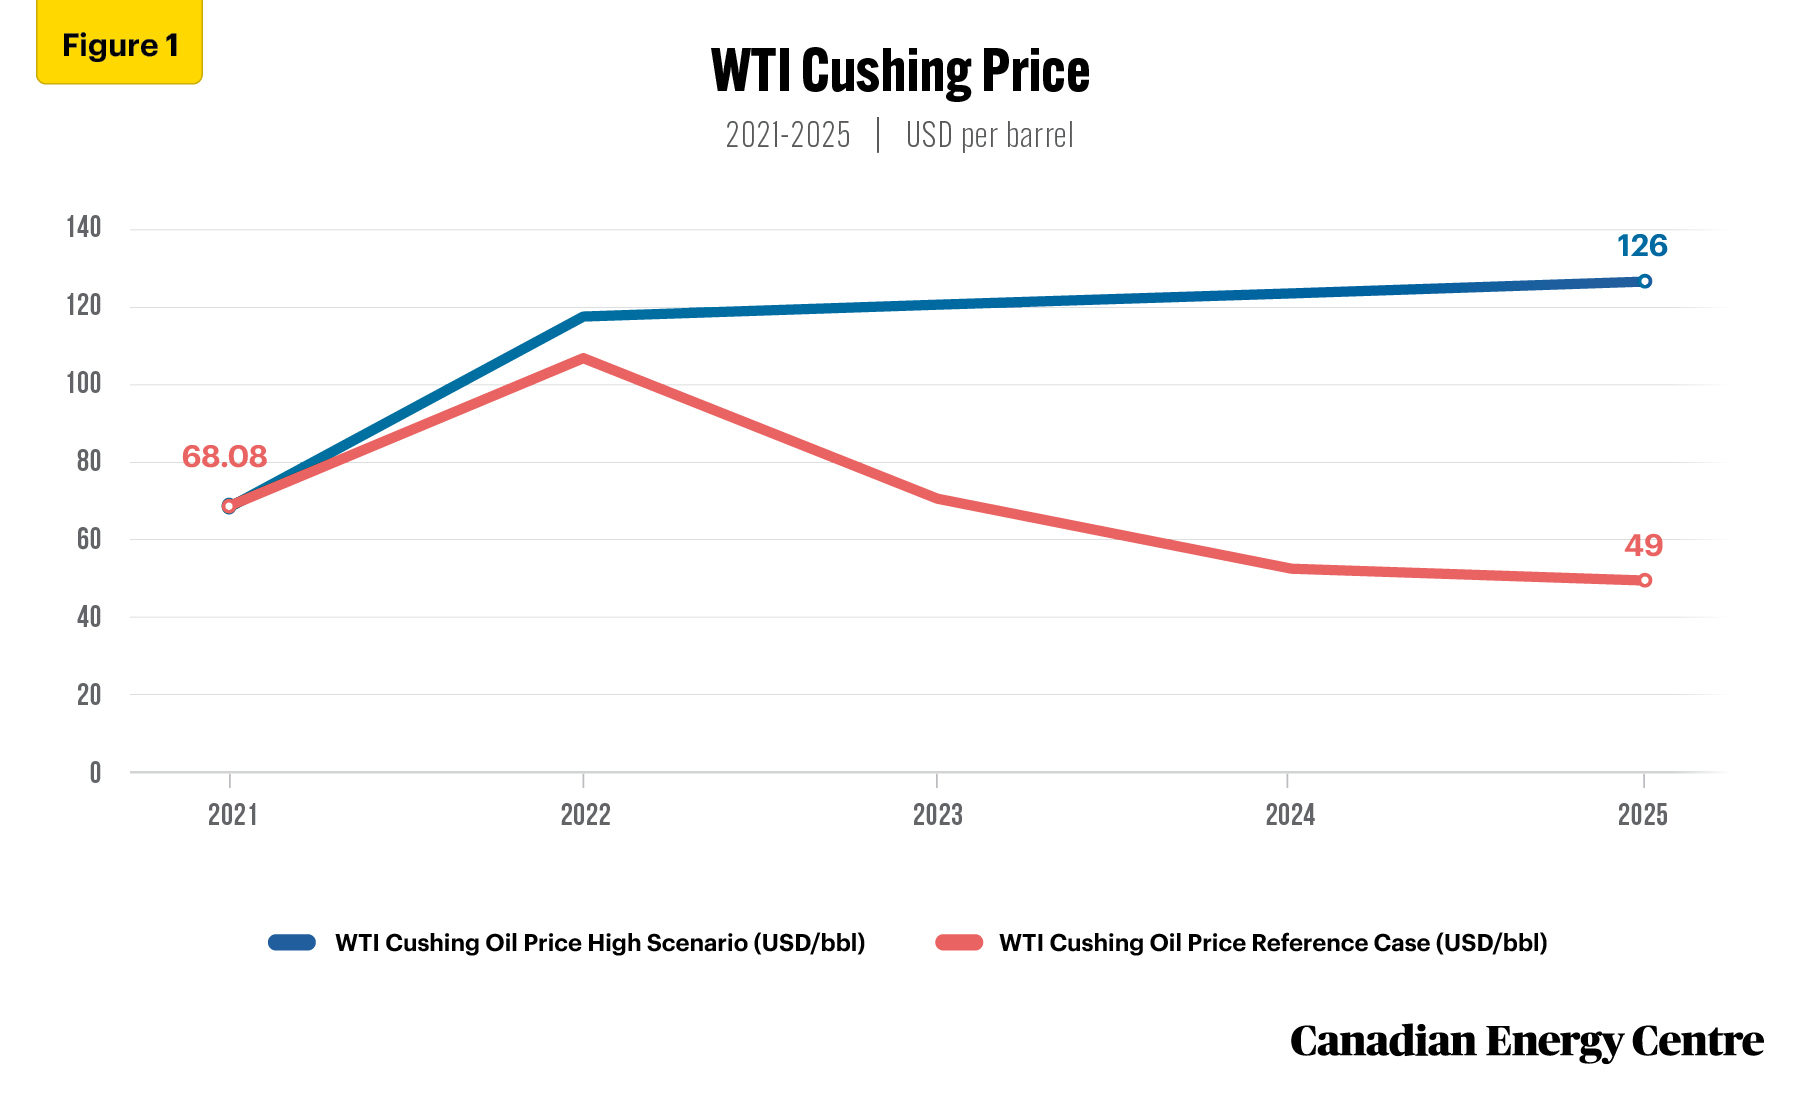
Source: Derived from the Rystad Energy UCube.
Oil sands free cash flow (FCF)
Under the oil price reference case, oil sands free cash flow (FCF) falls from US$20.5 billion in 2021 to U.S.$7.7 billion in 2025. Under the high oil price case, oil sands FCF rises from U.S.$ 20.5 billion in 2021 to U.S.$38.6 billion in 2025, an increase of over 88 per cent (see Figure 2).
By 2025, annual oil sands FCF is U.S.$30.9 billion or nearly five times greater under high oil prices than under the oil price reference case.
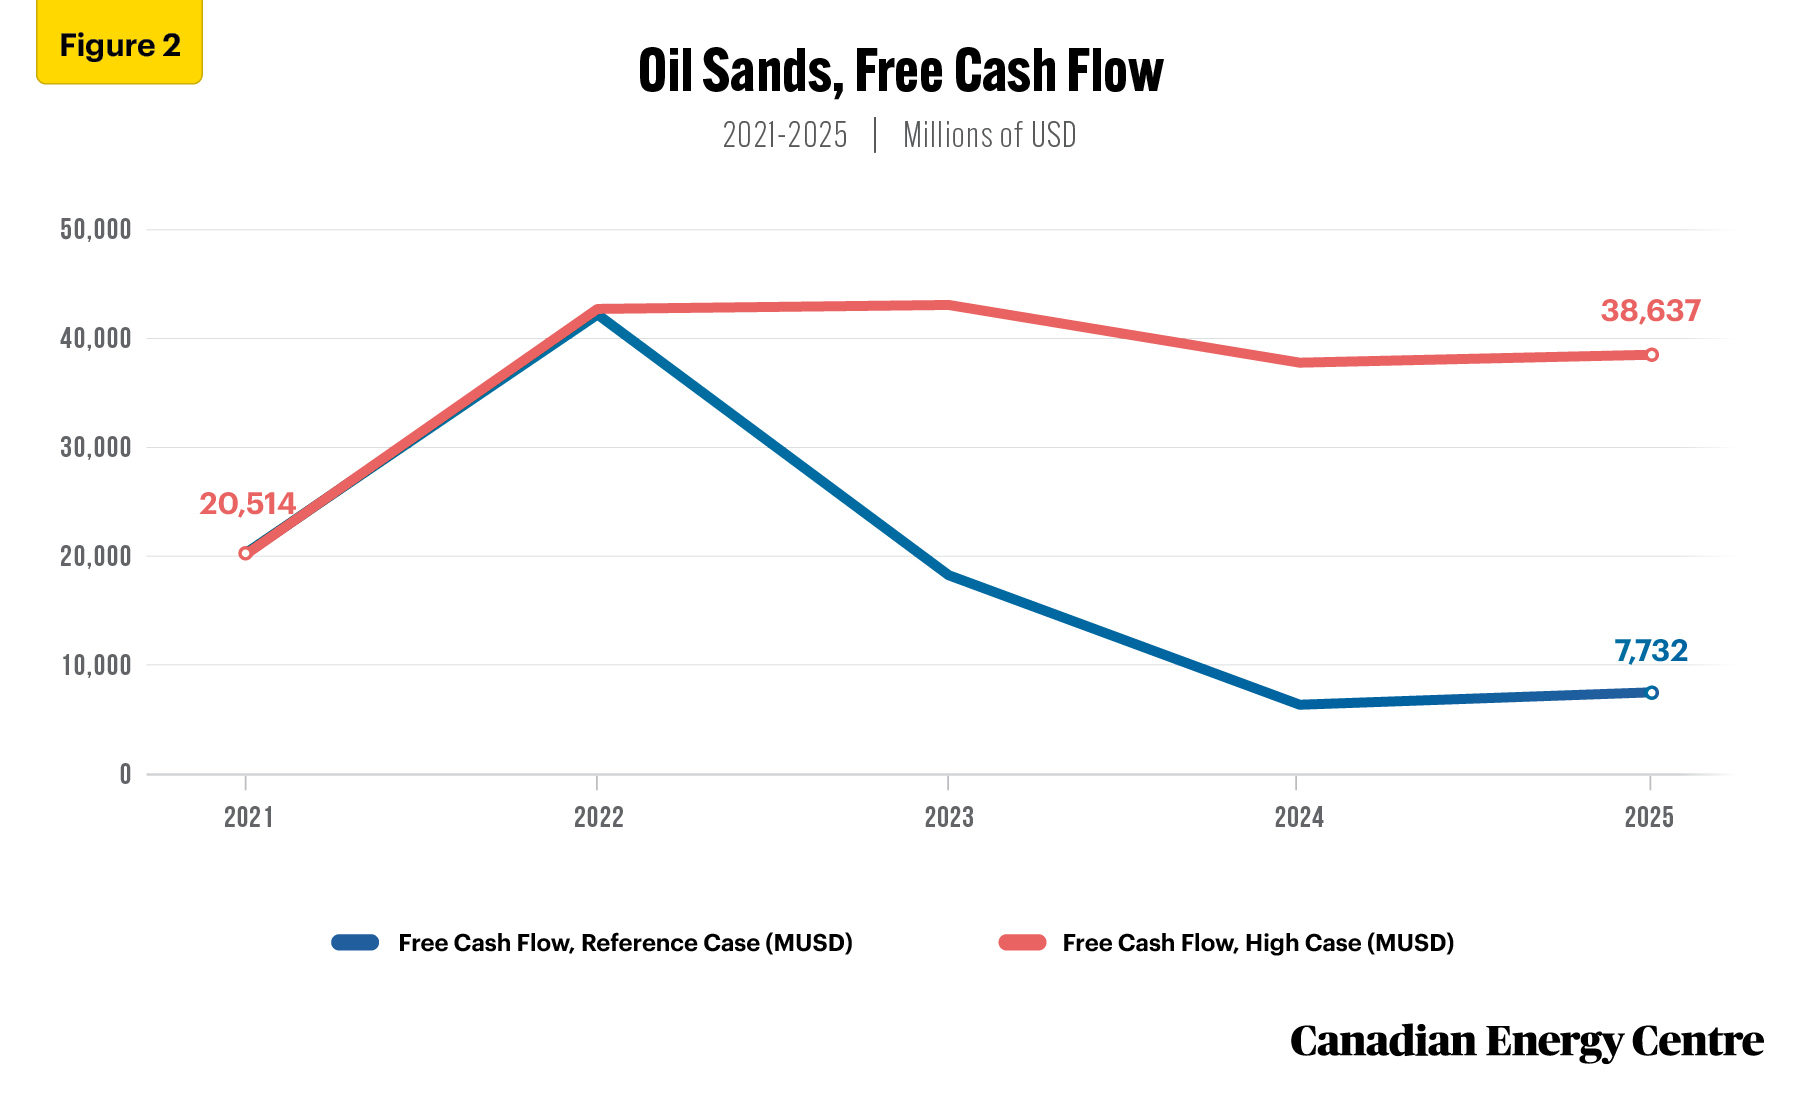
Source: Derived from the Rystad Energy UCube.
Oil sands capital expenditures (capex)
Under the oil price reference case, oil sands capex rises from U.S.$6.5 billion in 2021 to U.S. $8.9 billion in 2025, an increase of nearly 37 per cent. Under the high oil price case, oil sands capex rises from US$6.5 billion in 2021 to U.S.$11.7 billion in 2025, an increase of about 80 per cent (see Figure 3).
By 2025, annual oil sands capex is U.S.$2.8 billion or over 1.3 times greater under high oil prices than under the oil price reference case.
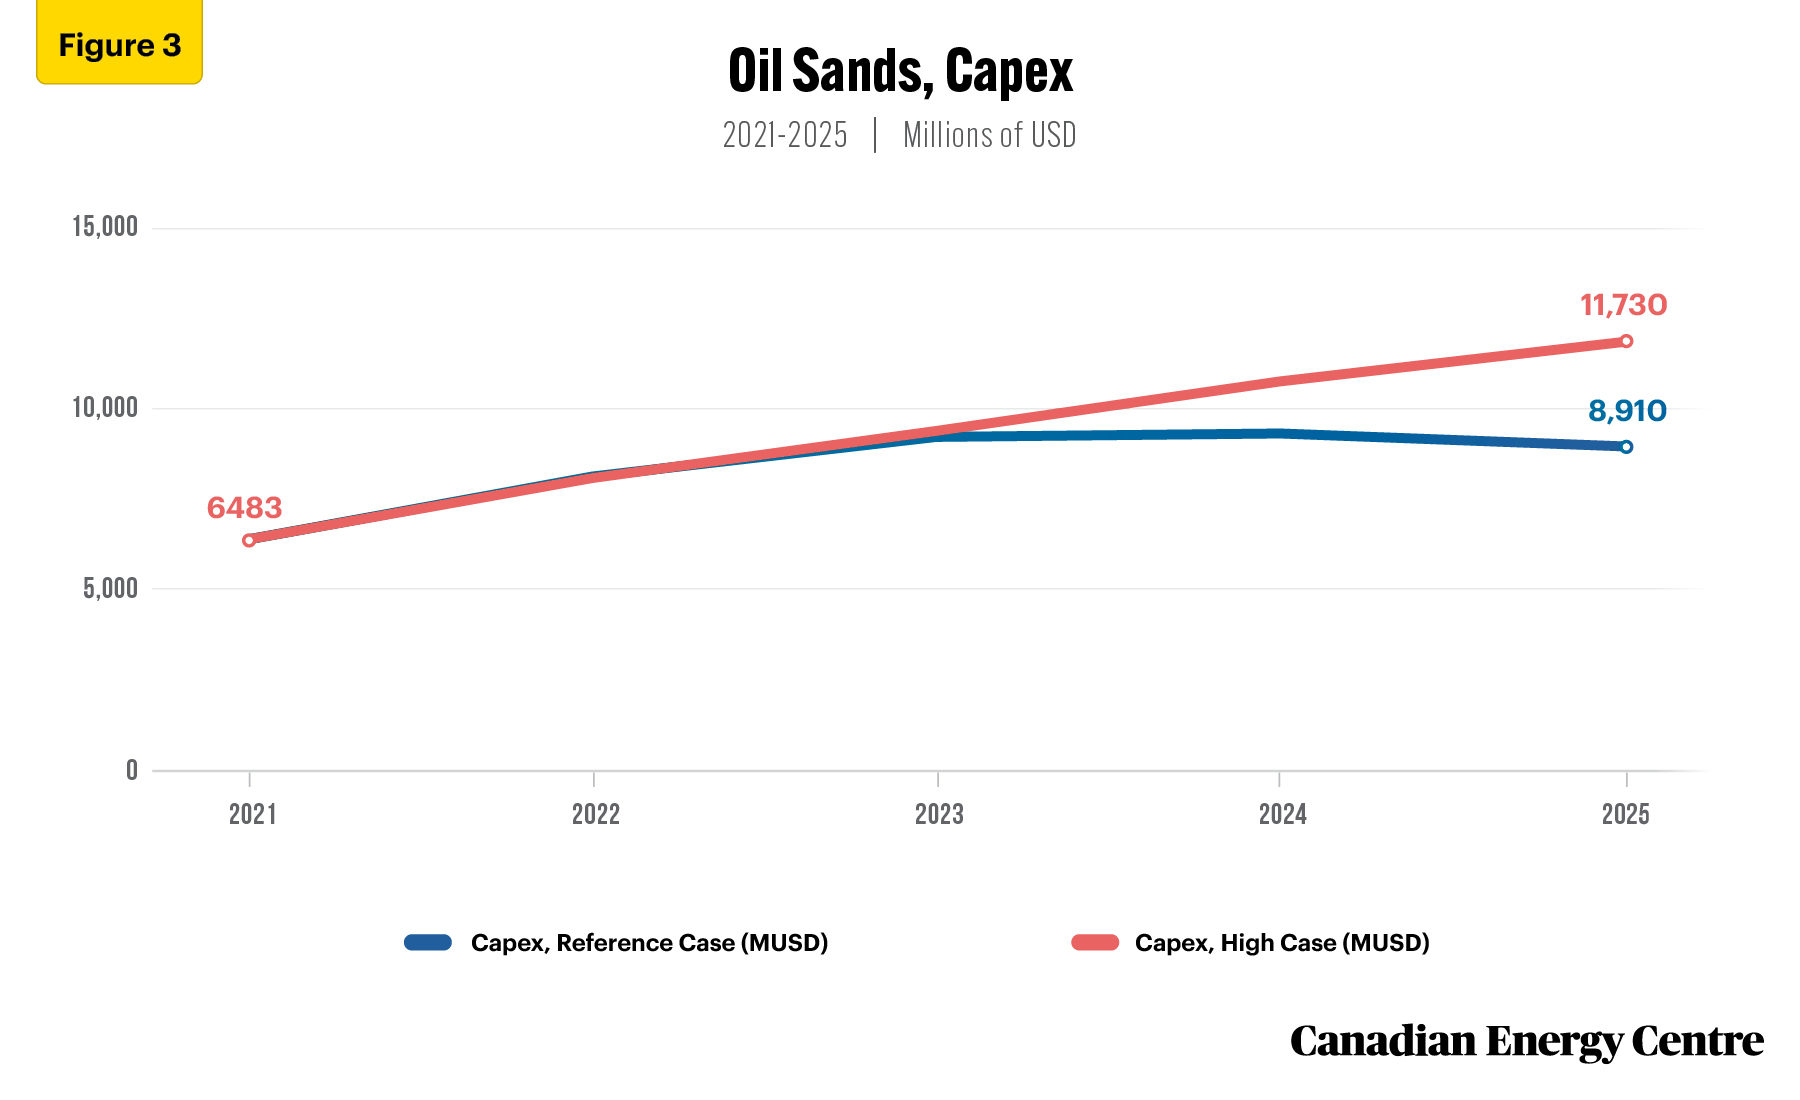
Source: Derived from the Rystad Energy UCube.
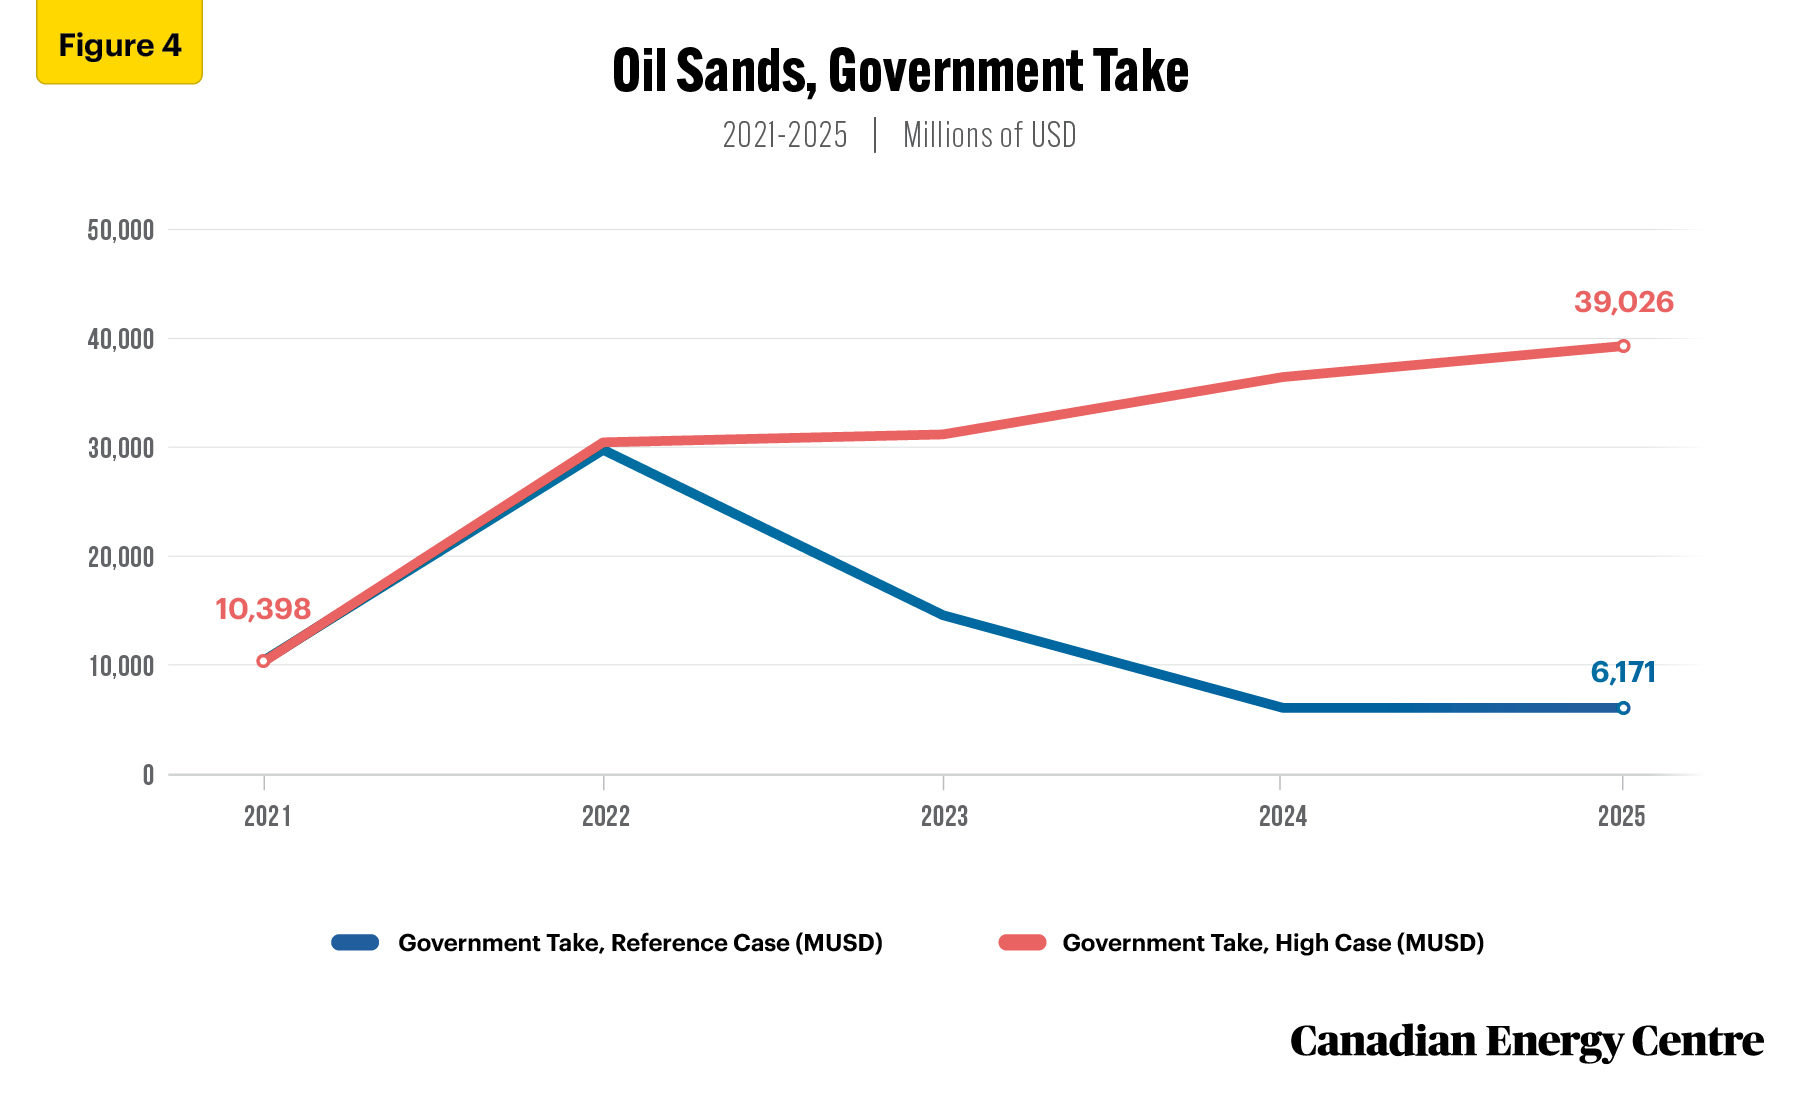
Oil sands government take
Under the oil price reference case, oil sands government take, including royalties and corporate income taxes, falls from U.S.$10.4 billion in 2021 to U.S.$6.2 billion in 2025. Under the high oil price case, oil sands government take rises from U.S.$10.4 billion in 2021 to U.S.$39 billion in 2025, an increase of 275 per cent (see Figure 4).
By 2025, annual oil sands government take is U.S.$32.8 billion or over six times greater under high energy prices than under the energy price reference case.
A major reason for the large difference in oil sands government take between the oil price reference case and the high oil price case is that with the prospects for higher crude oil prices over the next half decade, more oil sands projects move from pre-payout (1 per cent to 9 per cent of gross revenues) to post-payout royalty terms (25 per cent to 40 per cent of net revenues, depending on the price of oil) for the rest of their production lives (Government of Alberta, 2022).
Source: Derived from the Rystad Energy UCube.
Conclusion
A higher oil price environment over the next half-decade could have a significant impact on Canadian oil sands sector key performance metrics.
Improvements to oil sands metrics under higher oil prices have benefits for producers, federal and provincial governments, and all Canadians.
As a secure and reliable supplier of oil, the Canadian oil sands sector has been working diligently on increasing production, while reducing emissions per barrel by developing CCUS and other technologies to meet rising global demand.
Notes
This CEC Fact Sheet was compiled by Lennie Kaplan at the Canadian Energy Centre (www.canadianenergycentre.ca). The author and the Canadian Energy Centre would like to thank and acknowledge the assistance of two anonymous reviewers in reviewing the data and research for this Fact Sheet. Image credits: Imperial Oil.
The written content in this report was prepared by the Canadian Energy Centre (CEC) and does not represent the views of Rystad Energy.
References (all links live as of May 30, 2022)
Government of Alberta. 2022. Oil sands royalties – Overview. <https://bit.ly/3rUz4Wq>; Rystad Energy UCube. 2022. <https://bit.ly/3veaMIV>.
Creative Commons Copyright
Research and data from the Canadian Energy Centre (CEC) is available for public usage under creative commons copyright terms with attribution to the CEC. Attribution and specific restrictions on usage including non-commercial use only and no changes to material should follow guidelines enunciated by Creative Commons here: Attribution-NonCommercial-NoDerivs CC BY-NC-ND.