
To sign up to receive the latest Canadian Energy Centre research to your inbox email [email protected]
Overview
Despite Canada’s position as one of the world’s top oil producers, with the third-largest oil reserves, crude oil imports into Canada have become a significant part of the country’s energy mix, particularly since 2000.
In this Fact Sheet (which can be downloaded here as a pdf), using Statistics Canada’s International Trade Merchandise Data Base, we track the flow of crude oil imports (i.e. petroleum oil and oils obtained from bituminous minerals, crude) into Canada between 1988 and 2019. The source of those imports by country is then analyzed, followed by a breakdown of oil imports by province, and then a breakdown of the 2010-2019 figures. The value of crude oil imports is then compared with other imports to provide a sense of the relative size of oil imports.¹
In short:
- Between 1988 and 2019, Canada spent $477 billion on foreign oil imports;
- Quebec is by far the largest importer of foreign oil into Canada, with $225 billion in foreign oil imports since 1988;
- Between 2010 and 2019, Canada’s oil imports from just the United States and Saudi Arabia totaled $100 billion;
- Using census data from 2016 to arrive at per household value of foreign oil imports that year, the value of foreign oil imports amounted to $1,021 per household based on a national average (including Quebec); and
- When the value of Quebec’s foreign oil imports in 2016 is matched to the number of households in Quebec that year, foreign oil imports to Quebec were worth $1,576 per household annually as of 2016.
1. There are a number of factors that explain Canada’s level of foreign crude oil imports, including the type of oil a refinery is designed to process and ongoing pipeline constraints. In this Fact Sheet, we do not offer ‘pro’ or ‘con’ policy prescriptions; our goal is to offer hard data to inform public and policy discussions.
Canada imported over 8.7 billion barrels in foreign oil since 1988
Between 1988 and 2019, Canada imported over 8.7 billion barrels of crude oil from other countries, an average of nearly 749,000 barrels per day over the period. Crude oil imports into Canada more than doubled between 1988 and 2008, increasing from 148 million barrels to nearly 329 million barrels annually. Since 2008, crude oil imports into Canada have fallen by about 27 per cent, yet at nearly 241 million barrels in 2019 they remain nearly 62 per cent above the 1988 level.
The value of foreign oil imports 1988-2019: $477 billion nominal/$587 billion in 2020 dollars
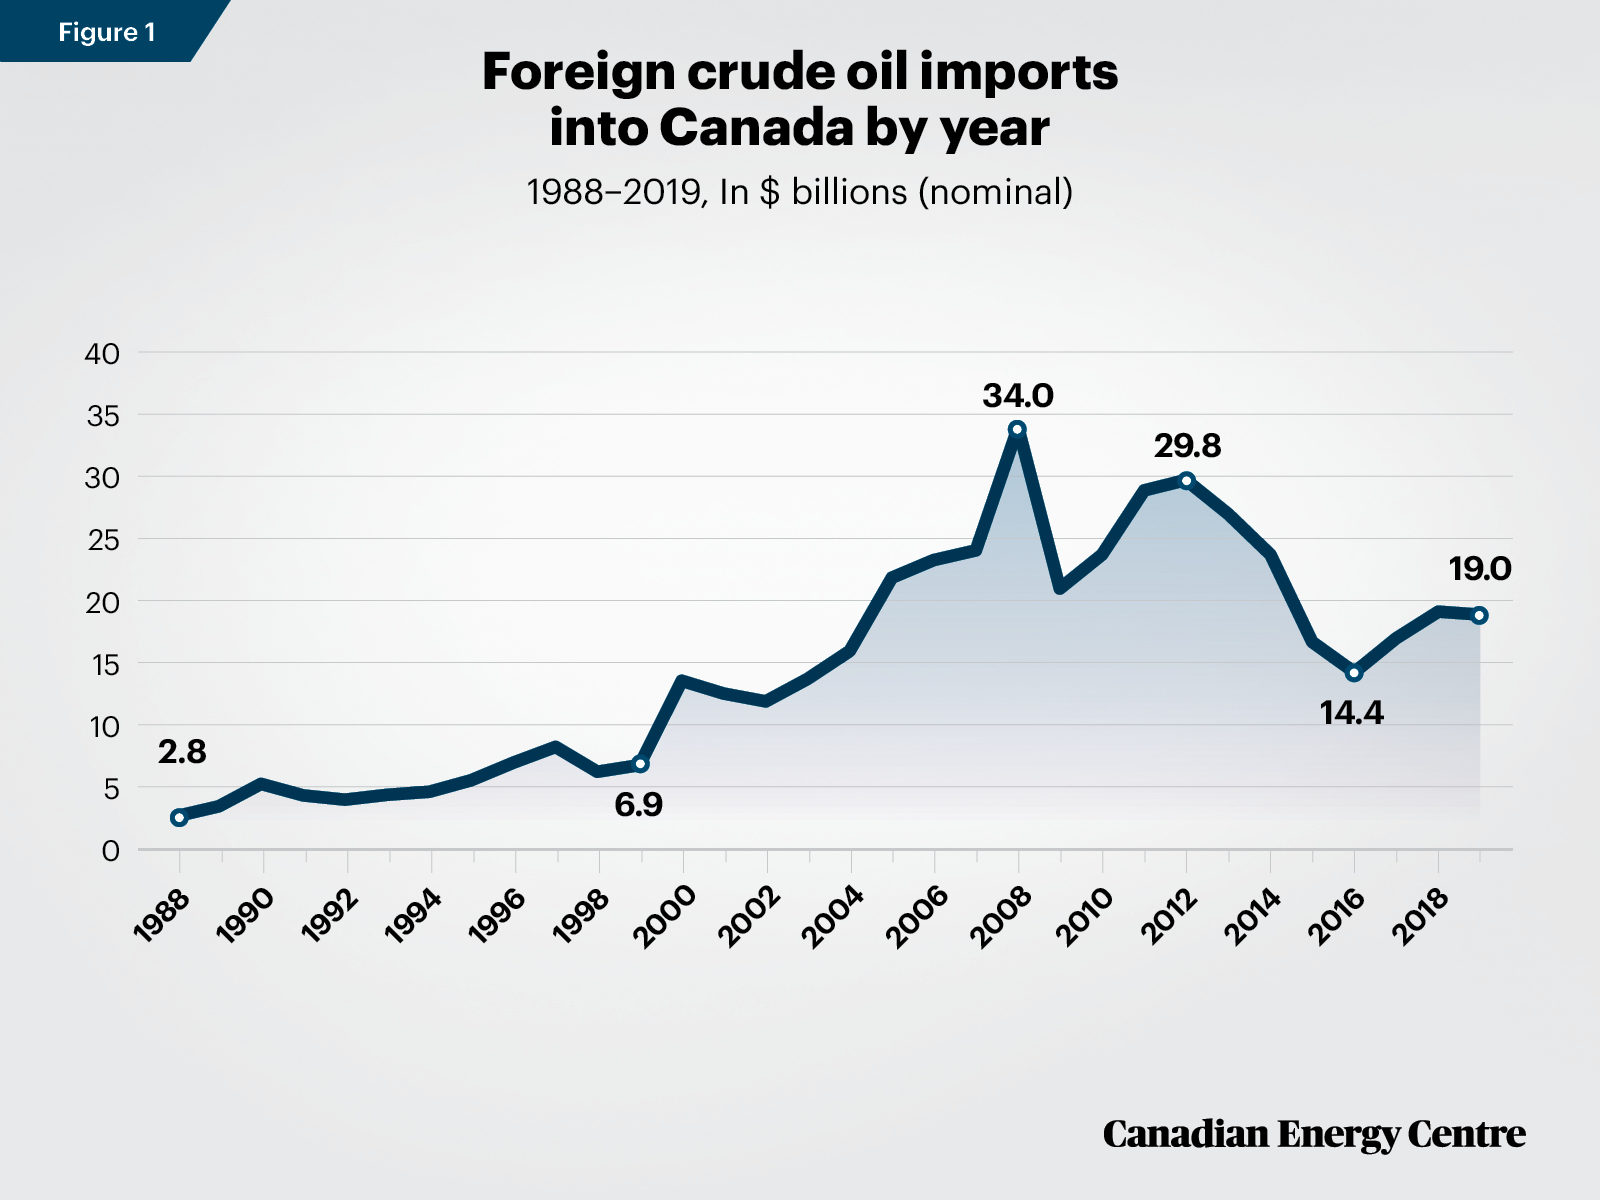
The value of foreign crude oil imports into Canada grew gradually between 1988 and 1999, reaching $6.9 billion in 1999. Foreign crude oil imports then nearly doubled to $13.7 billion in 2000 and continued to grow steadily to nearly $34 billion by 2008 (see figure 1). There was a sharp decline to $21 billion in 2009, coinciding with the Great Recession, but growth resumed to reach $29.8 billion in 2012. Despite lower crude oil prices beginning in 2014, the value of annual foreign crude oil imports into Canada remained at over $14 billion during the past five years, including nearly $19 billion in 2019.
In total, between 1988 and 2019, Canada spent $477 billion importing foreign crude oil from such countries as Saudi Arabia, Iraq, Russia, Azerbaijan, Nigeria, Algeria, Angola, Venezuela, and Kazakhstan, as well as the United Kingdom, Norway and, more recently, the United States. On an inflation adjusted basis, Canada spent $587 billion importing foreign crude oil between 1988 and 2019.
Source: Derived from Statistics Canada, Canadian International Merchandise Database.
Foreign oil imports by province: Quebec highest at $225 billion
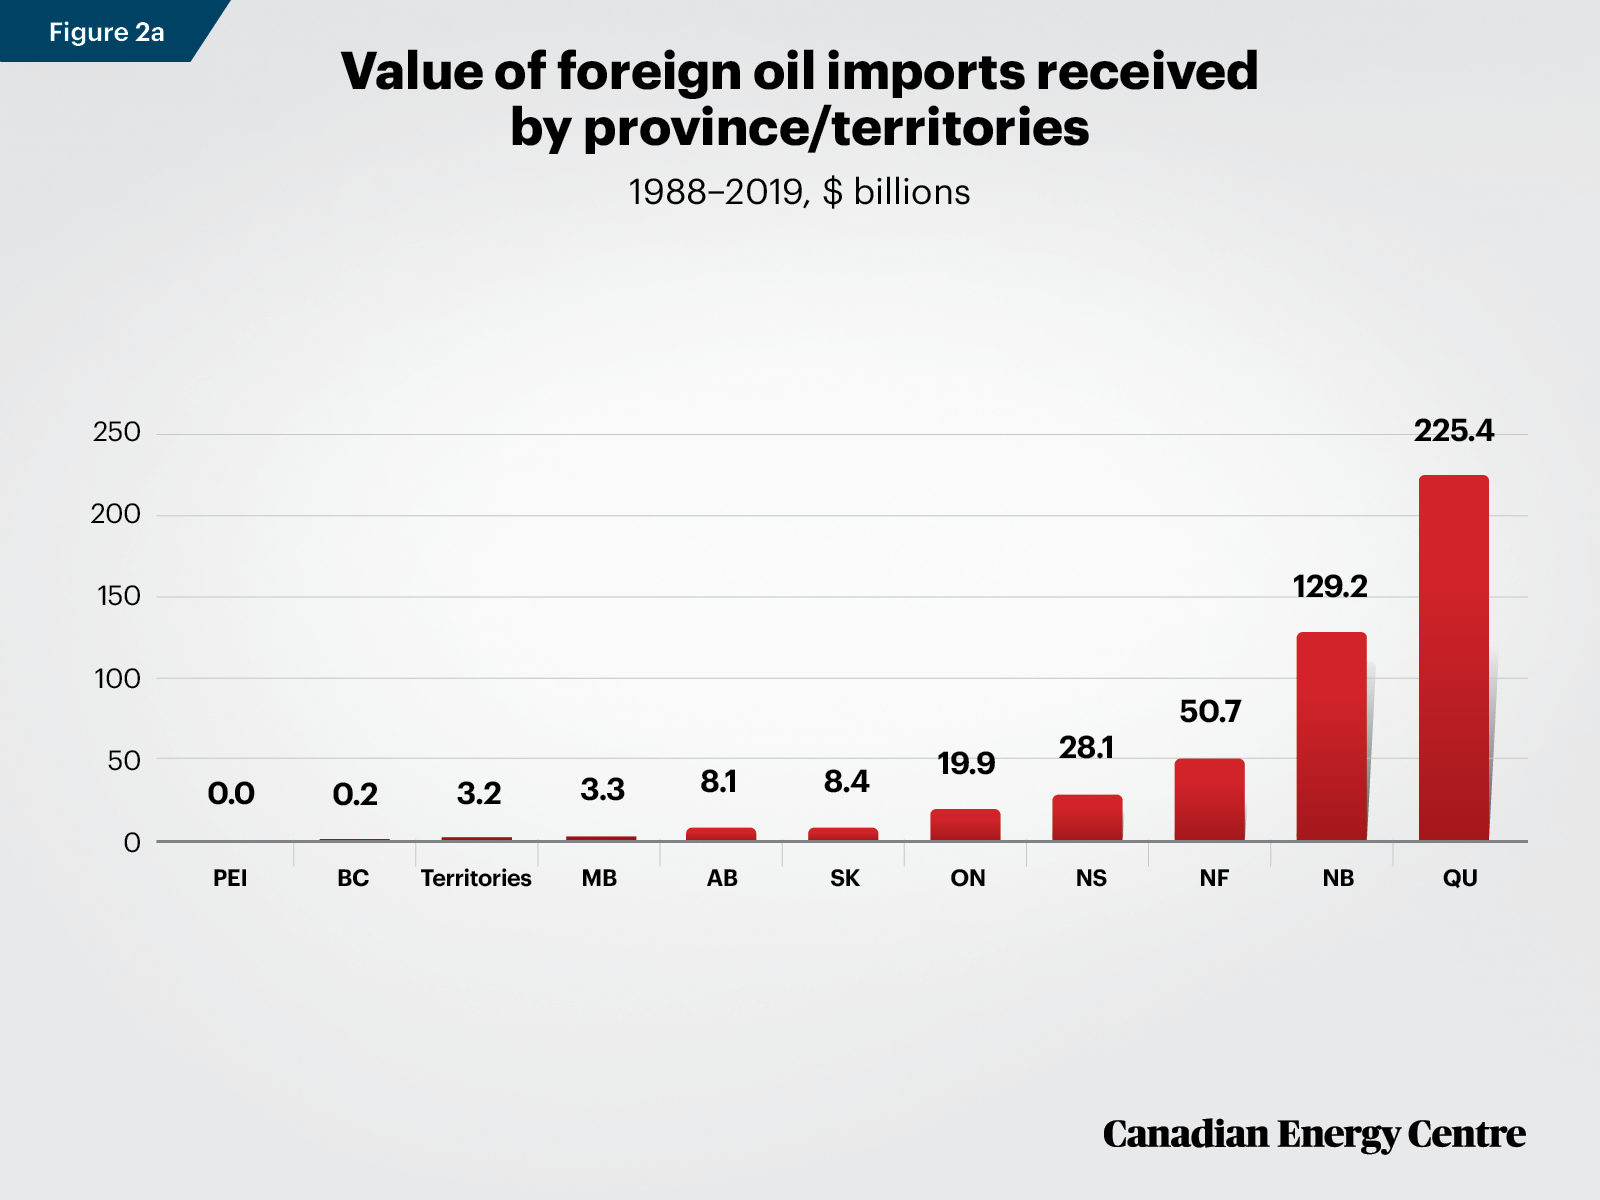
Between 1988 and 2019, Canada’s foreign crude oil imports were highest in Quebec ($225 billion), followed by New Brunswick ($129 billion), Newfoundland and Labrador (nearly $51 billion), Nova Scotia ($28 billion), and Ontario (nearly $20 billion) (see Figure 2a).
The lack of critical pipeline infrastructure from Western Canada is one reason why Ontario, Quebec and the Atlantic provinces rely on foreign oil imports. This continues despite the 2015 reversal/expansion of Enbridge’s Line 9B pipeline, which has allowed Ontario and Quebec refineries to source more oil from Western Canada. Historically, New Brunswick’s Irving Oil Refinery has also relied on foreign oil imports.
Source: Derived from Statistics Canada, Canadian International Merchandise Trade Database.
Foreign oil imports per household
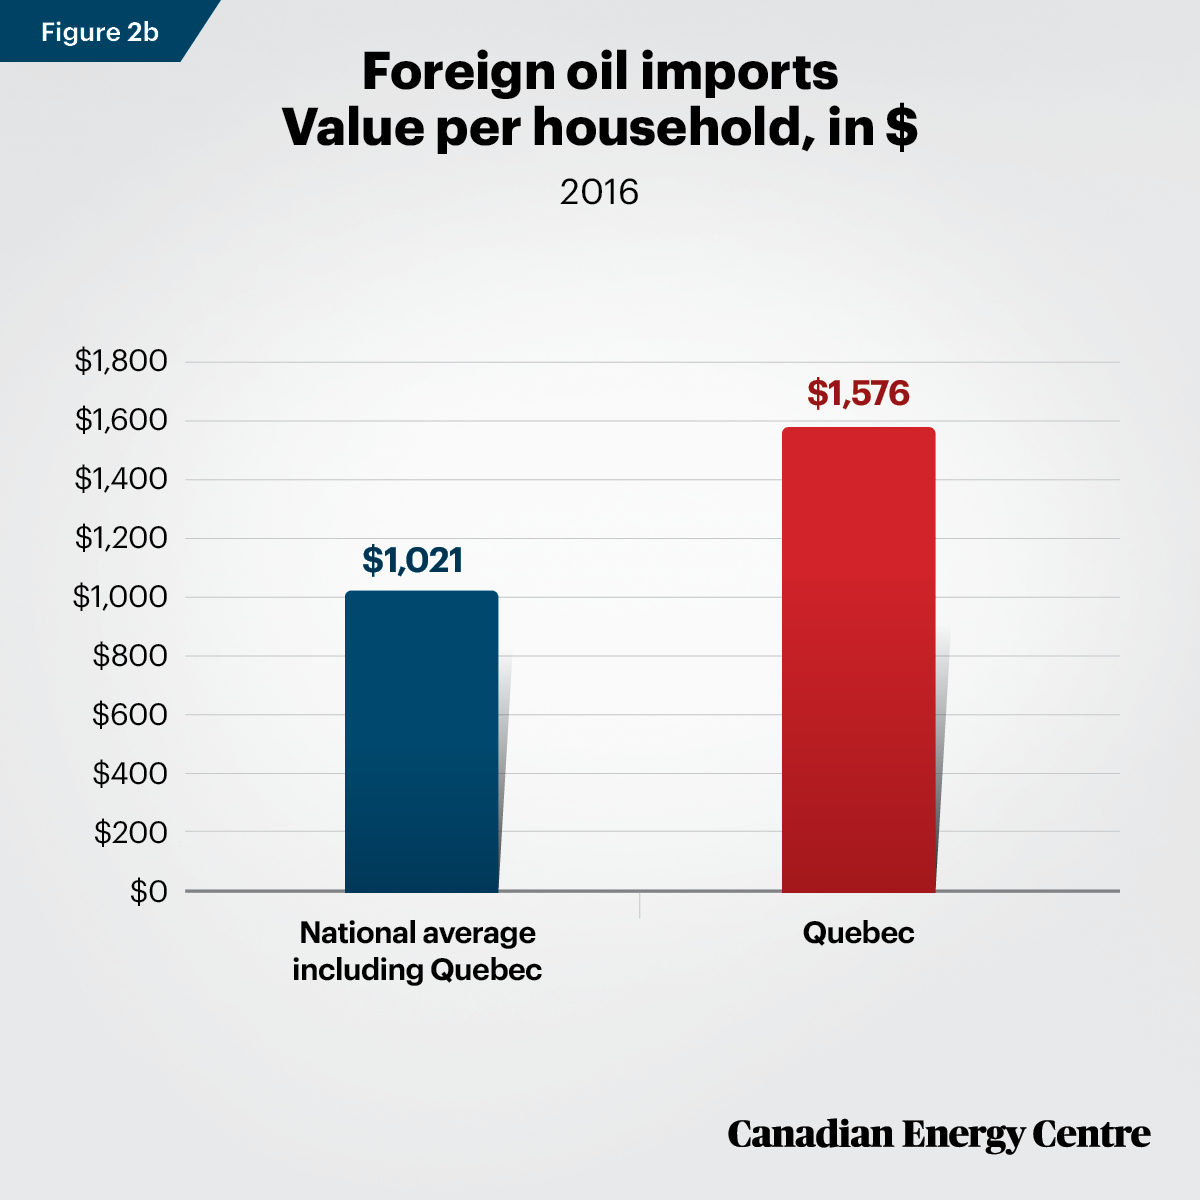
Combining census data from 2016 on the number of households with the value of foreign oil imports that year allows for a per household comparison (see figure 2b).
- In 2016, the value of foreign oil imports into all of Canada was just under $14.4 billion. Quebec’s portion of such imports amounted to nearly $5.6 billion. There were nearly 14.1 million households in Canada in total in 2016 with over 3.5 million of these households in Quebec;
- The value of foreign oil imports (the national average) amounted to $1,021 per household based on a national average (including Quebec); and
- When the value of Quebec’s foreign oil imports in 2016 is matched to the number of Quebec households, the value of foreign oil imports to Quebec was $1,576 per household.
Sources: Derived from Statistics Canada, Canadian International Merchandise Trade Database and the 2016 Census.
Foreign crude oil imports by country 1988-2019
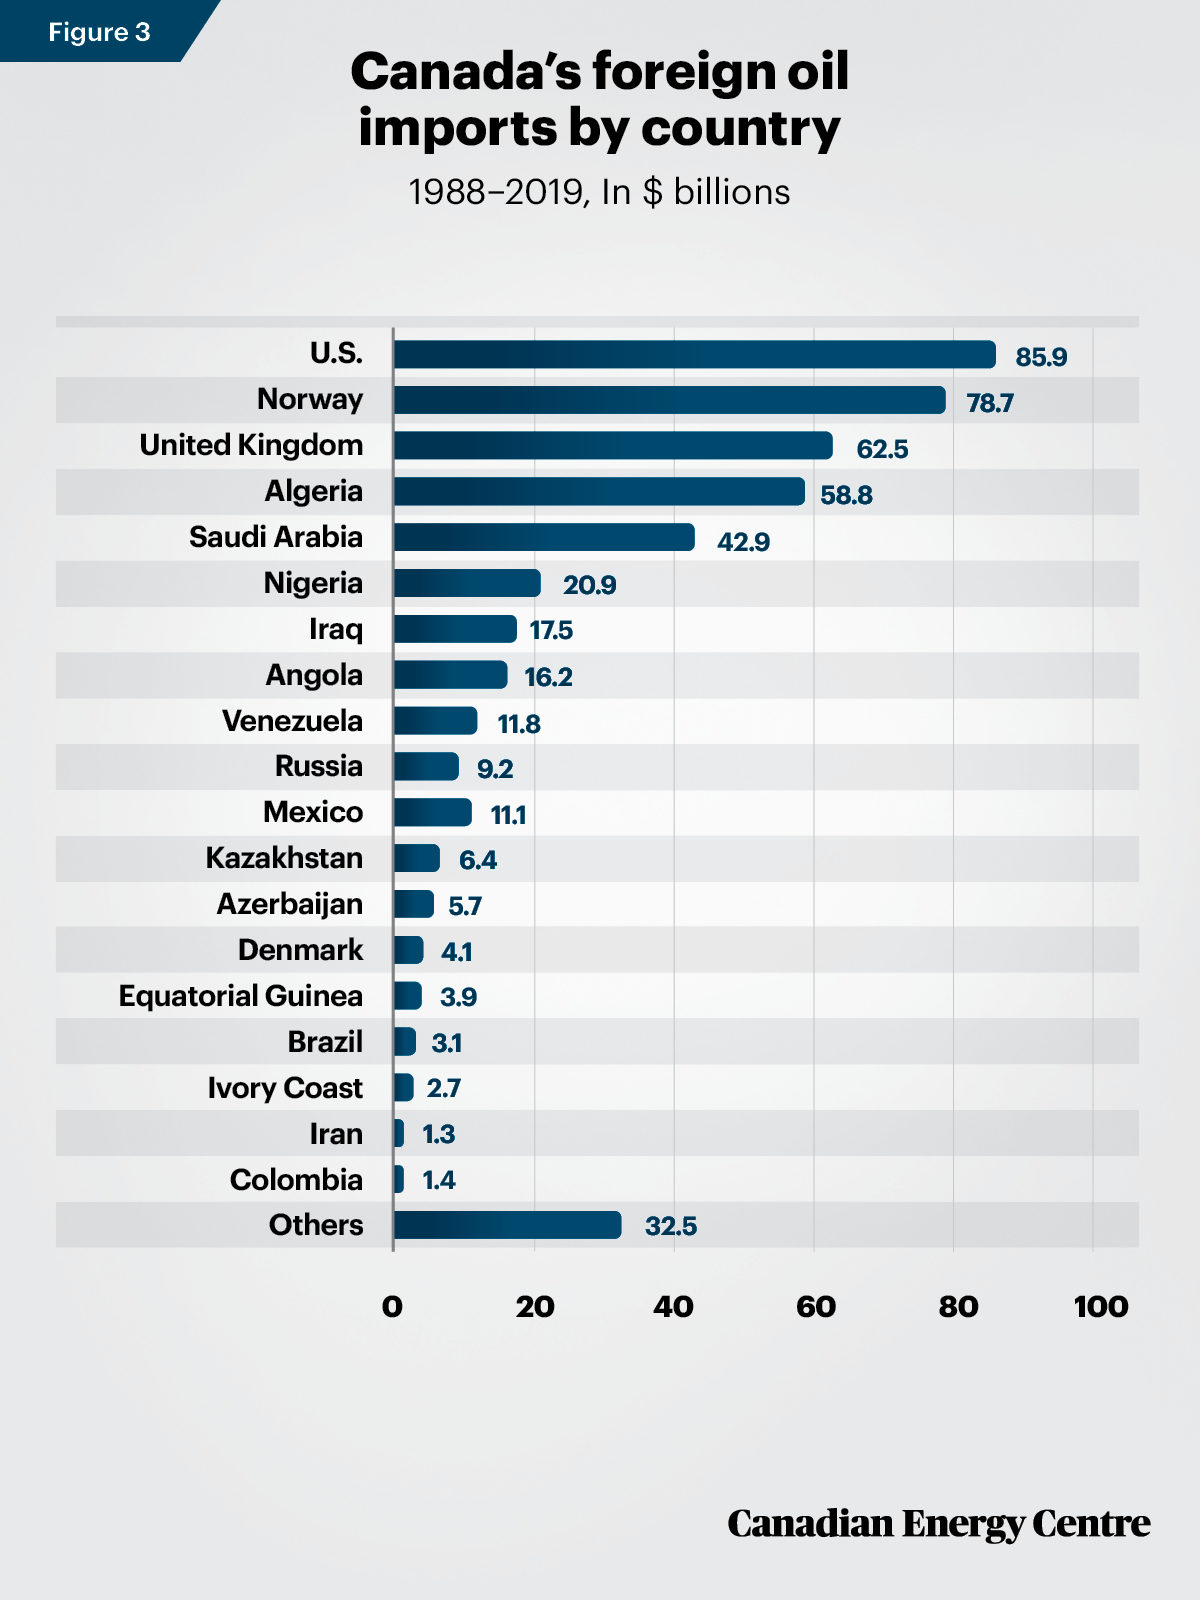
Canada has imported foreign crude oil from a number of countries over the past three decades (see figure 3). Between 1988 and 2019, the five largest exporters of foreign crude oil into Canada were the United States ($85.9 billion), followed by Norway ($78.7 billion), the United Kingdom ($62.5 billion), Algeria ($58.8 billion), and Saudi Arabia ($42.9 billion).
Source: Derived from Statistics Canada, Canadian International Merchandise Trade Database.
Canada’s historic oil suppliers: The United Kingdom, Norway, and Nigeria
- The United Kingdom was once a consistent source of foreign crude oil for Canada, reaching an annual value of $5.2 billion in 2008 before falling off in the current decade as its oil production has declined;
- Norway was also once a significant source of foreign crude oil for Canada, reaching over $5.6 billion in 2008, until falling off with the Great Recession of 2009 and the crude oil price decline that started in 2014;
- Nigeria has been another major source of foreign crude oil for Canada, peaking at $2.4 billion in 2011, but it has fallen off to just $273 million in 2019;
- Venezuela was a source of foreign crude oil for Canada between 2000 and 2007, but its share fell to near zero beginning in 2008;
- Algeria emerged as a large source of foreign crude oil for Canada between 1999 and 2014, peaking at nearly $7.7 billion in 2007, before falling to zero in 2015; and
- Other nations such as Azerbaijan, Angola and Kazakhstan have also been sources of crude oil for Canada, primarily in the period between 2008 and 2014.
Since 2004, Saudi Arabia has emerged as a growing source of foreign crude oil imports into Canada. The United States also increased its share as a significant source of foreign crude oil after 2007 when its shale oil production began to soar.
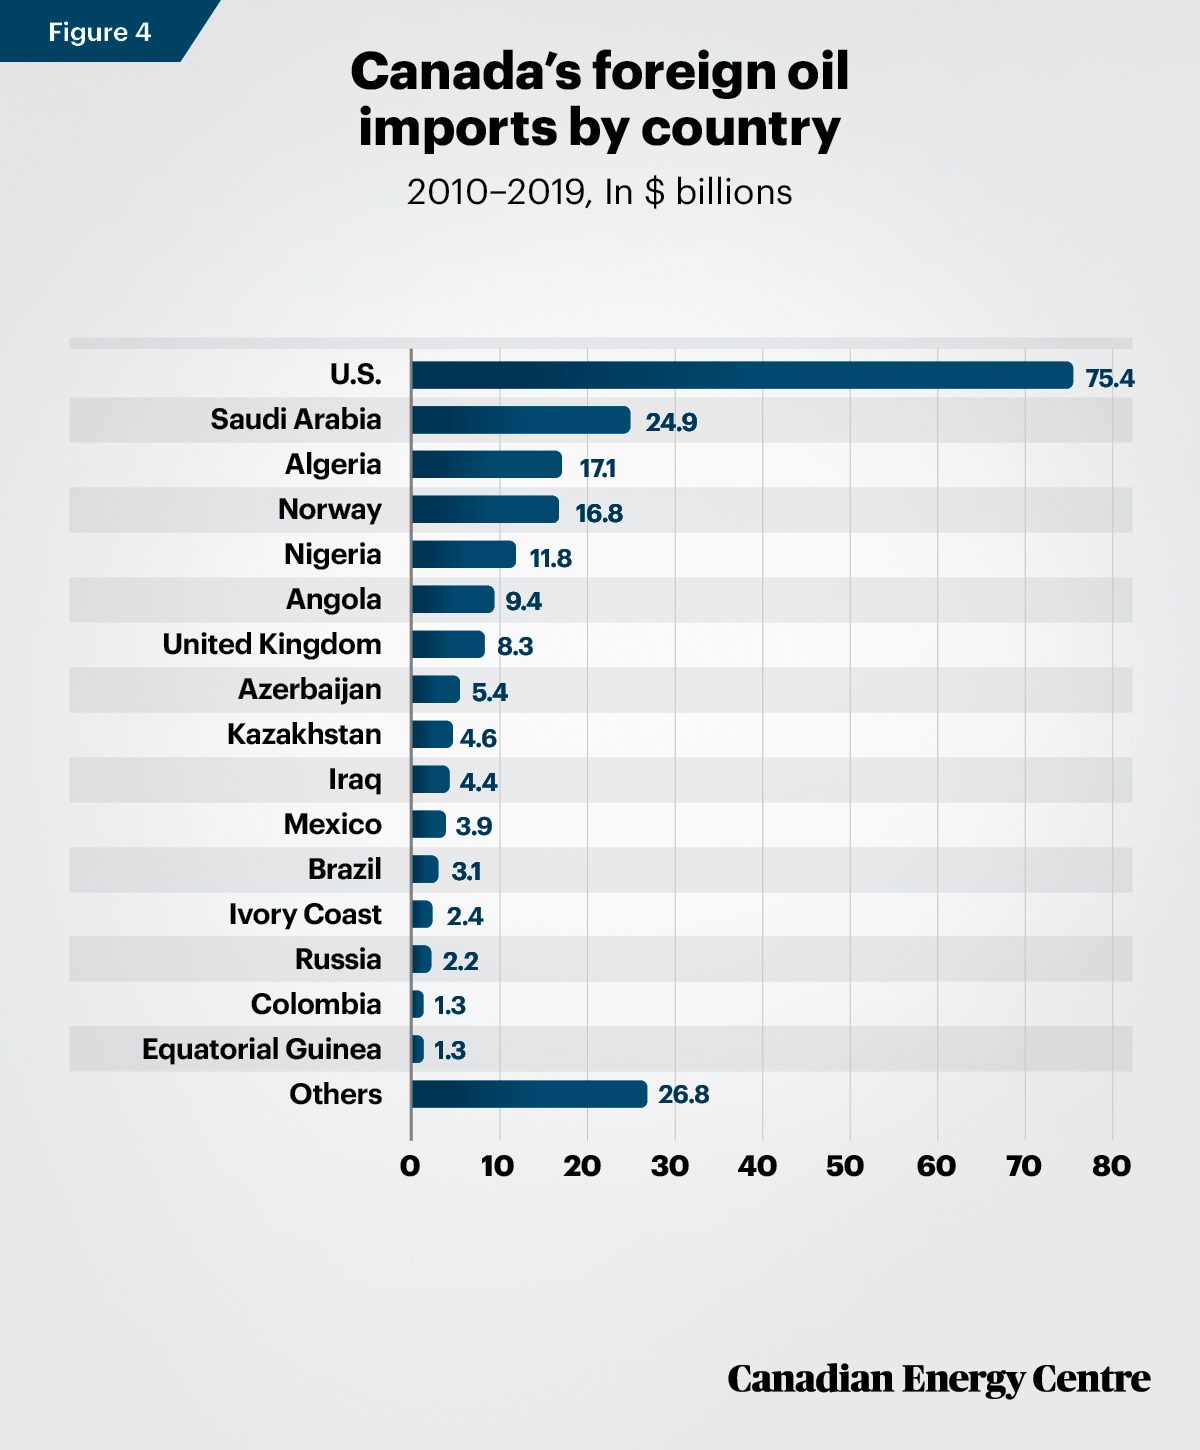
2010 to 2019: A greater reliance on the United States and Saudi Arabia
Canada’s mix of foreign crude oil imports has become lessdiverse over time, particularly in the last decade. Between and 2019, Canada’s total oil imports were worth $219.6 billion. U.S. oil imports represented $75.4 billion, followed by imports from Saudi Arabia at $24.9 billion, or over $100 billion in foreign oil imports into Canada from those two countries alone (see Figure 4).
Source: Derived from Statistics Canada, Canadian International Merchandise Trade Database.
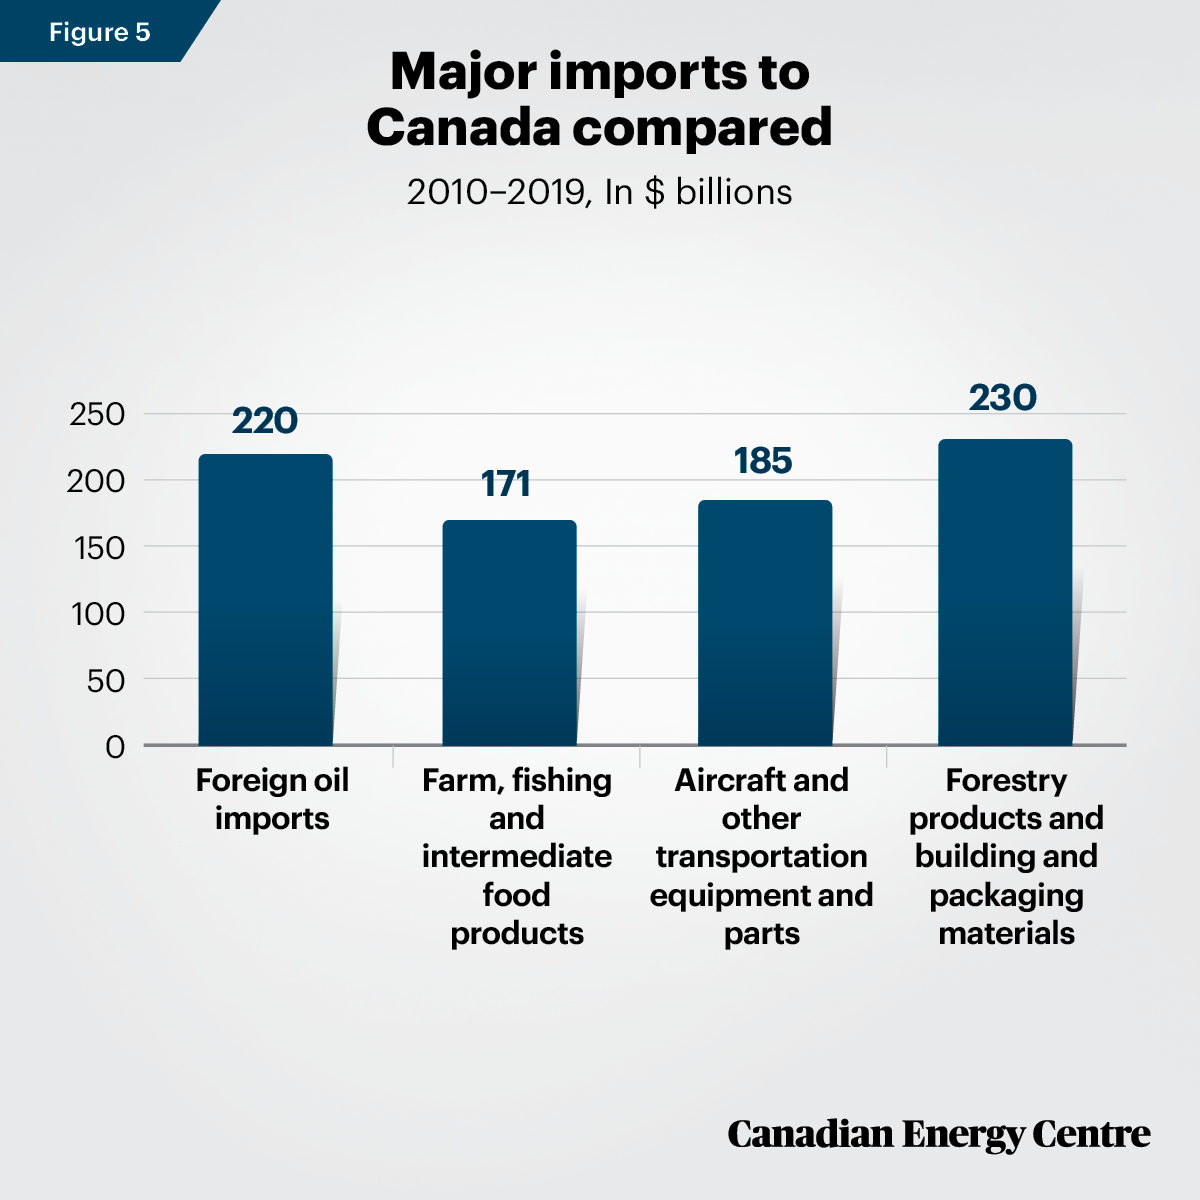
Foreign crude oil imports compared with imports from other key sectors, 2010 to 2019
Nearly $220 billion was spent by Canada on foreign crude oil imports between 2010 and 2019 (see Figure 5). This is:
- Higher than the almost $171 billion spent by Canada on farm, fishing and intermediate food products imports;
- Higher than the nearly $185 billion spent by Canada on aircraft and other transportation equipment and parts imports; and
- Just below the $230 billion spent by Canada on forestry products and building and packaging materials imports.
Source: Derived from Statistics Canada, Canadian International Merchandise Trade Database.
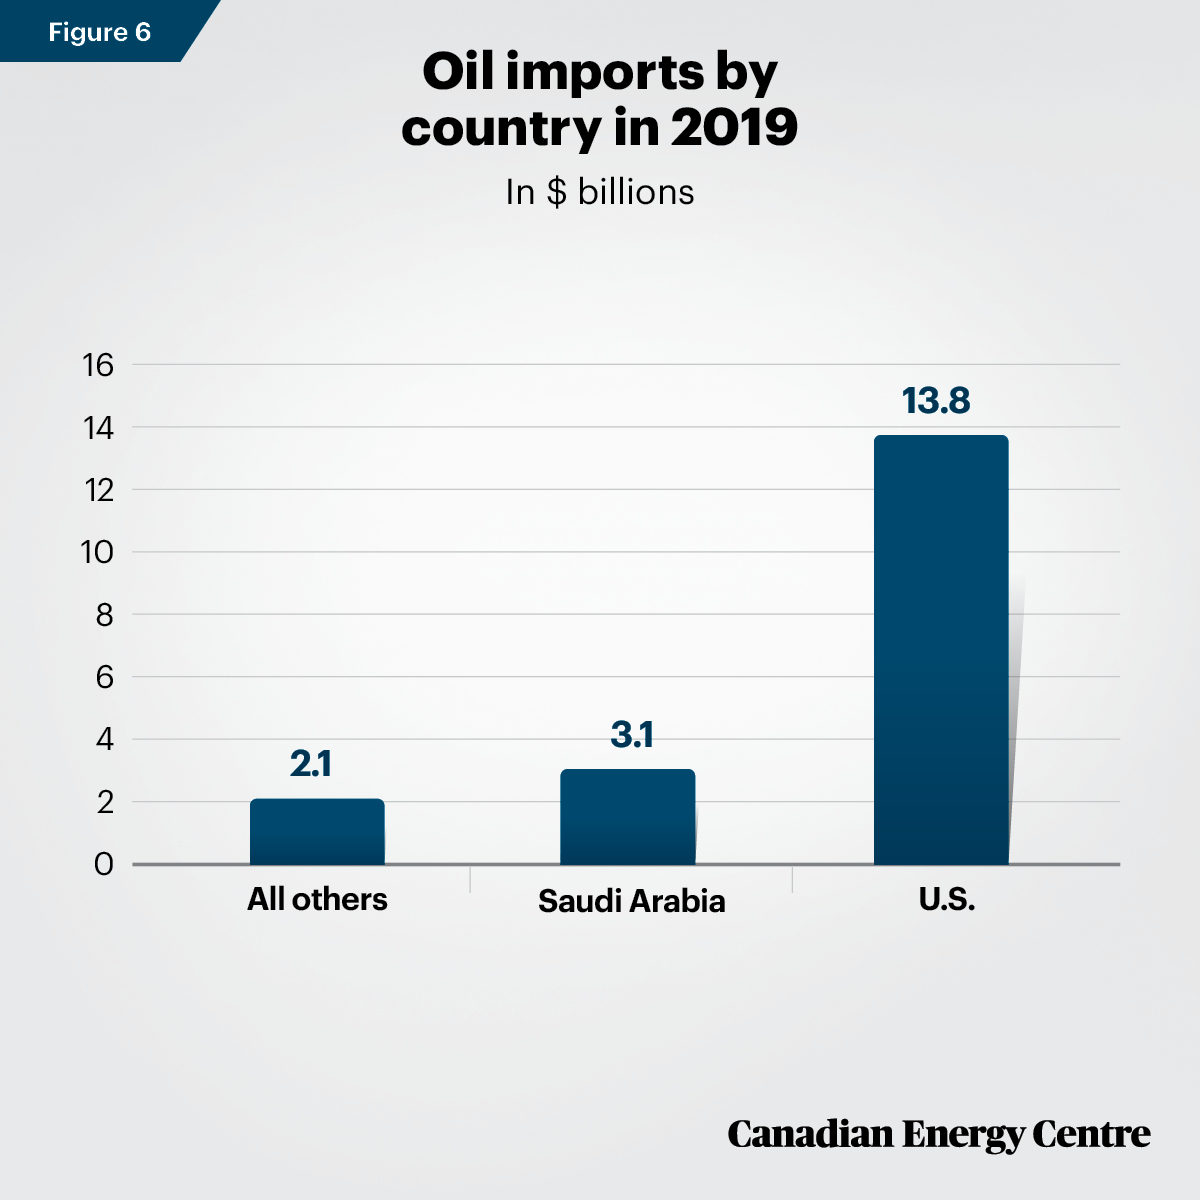
A 2019 snapshot: 89 per cent of all oil imports from U.S. and Saudi Arabia
In 2019, the U.S. was Canada’s largest source of foreign crude oil at $13.8 billion, followed by Saudi Arabia at nearly $3.1 billion (see Figure 6). Together, these two countries accounted for about 89 per cent of all oil imports to Canada, or $16.9 billion of the $19 billion total in 2019. Other countries followed far behind, such as Russia ($555 million), Norway ($314 million), the United Kingdom ($295 million), Nigeria ($273 million), and Azerbaijan ($272 million).
Source: Derived from Statistics Canada, Canadian International Merchandise Trade Database.
The takeaway
Foreign crude oil imports into Canada have been on the rise over the past two decades and the value remains high ($19 billion in 2019) despite the crude oil price decline beginning in 2014.
While Canada is among the world leaders in both crude oil reserves and crude oil production, $477 billion has been spent between 1988 and 2019 to bring in foreign crude oil from such countries as Saudi Arabia, Russia, Azerbaijan, Nigeria, Algeria, Angola, Venezuela, and Kazakhstan, along with United Kingdom, Norway and, more recently, the United States.
Quebec has been the largest importer of foreign oil (47 per cent of the Canadian total), at $225 billion between 1988 and 2019.
The value of foreign oil imports per household, using 2016 census data, was $1,021 per household (nationally, including Quebec) and specific to Quebec was $1,576 per household annually.
Notes
This CEC Fact Sheet was compiled by Lennie Kaplan and Mark Milke at the Canadian Energy Centre (www.canadianenergycentre.ca) and Germain Belzile. The authors and the Canadian Energy Centre would like to thank and acknowledge the assistance of Philip Cross in reviewing the data and research for this Fact Sheet. Image credits: Aerial view of tank ship by Morten Falch Sortland from Getty Images.
Sources (Links live as of August 21, 2020)
Statistics Canada (undated). Canadian International Merchandise Trade Database. <https://bit.ly/37XDr7y>; Statistics Canada (undated). Table 12-10-0133-01 Canadian international merchandise trade by province and country, and by product sections, customs-based, annual <https://bit.ly/3g12J8g>. Statistics Canada (2017). Families, Households and Marital Status Highlight Tables. 2016 Census <https://bit.ly/2YppR9B>; U.S. Energy Information Administration (2020). International, Petroleum and other liquids, <https://bit.ly/2QeWang>.
Creative Commons Copyright
Research and data from the Canadian Energy Centre (CEC) is available for public usage under creative commons copyright terms with attribution to the CEC. Attribution and specific restrictions on usage including non-commercial use only and no changes to material should follow guidelines enunciated by Creative Commons here: Attribution-NonCommercial-NoDerivs CC BY-NC-ND.