To sign up to receive the latest Canadian Energy Centre research to your inbox email: [email protected]
Download the PDF here
Download the charts here
Overview
This Fact Sheet analyzes the upstream oil and gas industry record on flaring and venting of gases in Canada relative to other countries. Flaring and venting, while technical in nature, is relevant because both are a source of greenhouse gas emissions (GHGs). For example, in 2021, 143,504 million m3 of flared gases were emitted worldwide, or 382.6 million tonnes of CO2 emissions. Canada is a major producer of oil and natural gas with the third-largest proven reserves of crude oil, the 17th largest reserves of natural gas, and is the fourth-largest producer of both commodities (Natural Resources Canada, Undated), and so contributes to flaring and venting.
Background
Flaring and venting are two ways in which an oil or natural gas producer can dispose of waste gases. Venting is the intentional controlled release of un-combusted gases directly to the atmosphere, and flaring is a disposal by combustion of natural gas or gas derived from petroleum.¹ As Matthew R. Johnson and Adam R. Coderre noted in their 2012 paper on the subject, flaring in the petroleum industry generally falls within three broad categories:
- Emergency flaring (large, unplanned, and very shortduration releases, typically at larger downstream facilities or off-shore platforms);
- Process flaring (intermittent large or small releases that may last for a few hours or a few days, as occurs in the upstream industry during well-test flaring to assess the size of a reservoir or at a downstream plant during a planned process blowdown); and
- Production flaring (which may occur continuously for years as the resource is being produced).
To track GHGs from flaring and venting, Environment Canada (2016) defines such emissions as:
- Fugitive emissions: Releases from venting, flaring, or leakage of gases from fossil fuel production and processing; iron and steel coke oven batteries; CO2 capture, transport, injection, and storage infrastructure.
- Flaring emissions: Controlled releases of gases from industrial activities from the combustion of a gas or liquid stream produced at a facility, the purpose of which is not to produce useful heat or work. This includes releases from waste petroleum incineration, hazardous emission prevention systems (in pilot or active mode), well testing, natural gas gathering systems, natural gas processing plant operations, crude oil production, pipeline operations, petroleum refining, chemical fertilizer production, and steel production.
- Venting emissions: Controlled releases of a process or waste gas, including releases of CO2 associated with carbon capture, transport, injection, and storage; from hydrogen production associated with fossil fuel production and processing; of casing gas; of gases associated with a liquid or a solution gas; of treater, stabilizer or dehydrator off-gas; of blanket gases; from pneumatic devices that use natural gas as a driver; from compressor start-ups, pipelines, and other blowdowns; and from metering and regulation station control loops.
1. Many provinces regulate flaring and venting including Alberta (Directive 060) British Columbia (Flaring and Venting Reduction Guideline), and Saskatchewan (S-10 and S-20). Newfoundland & Labrador also has regulations that govern offshore flaring.
Flaring comparisons
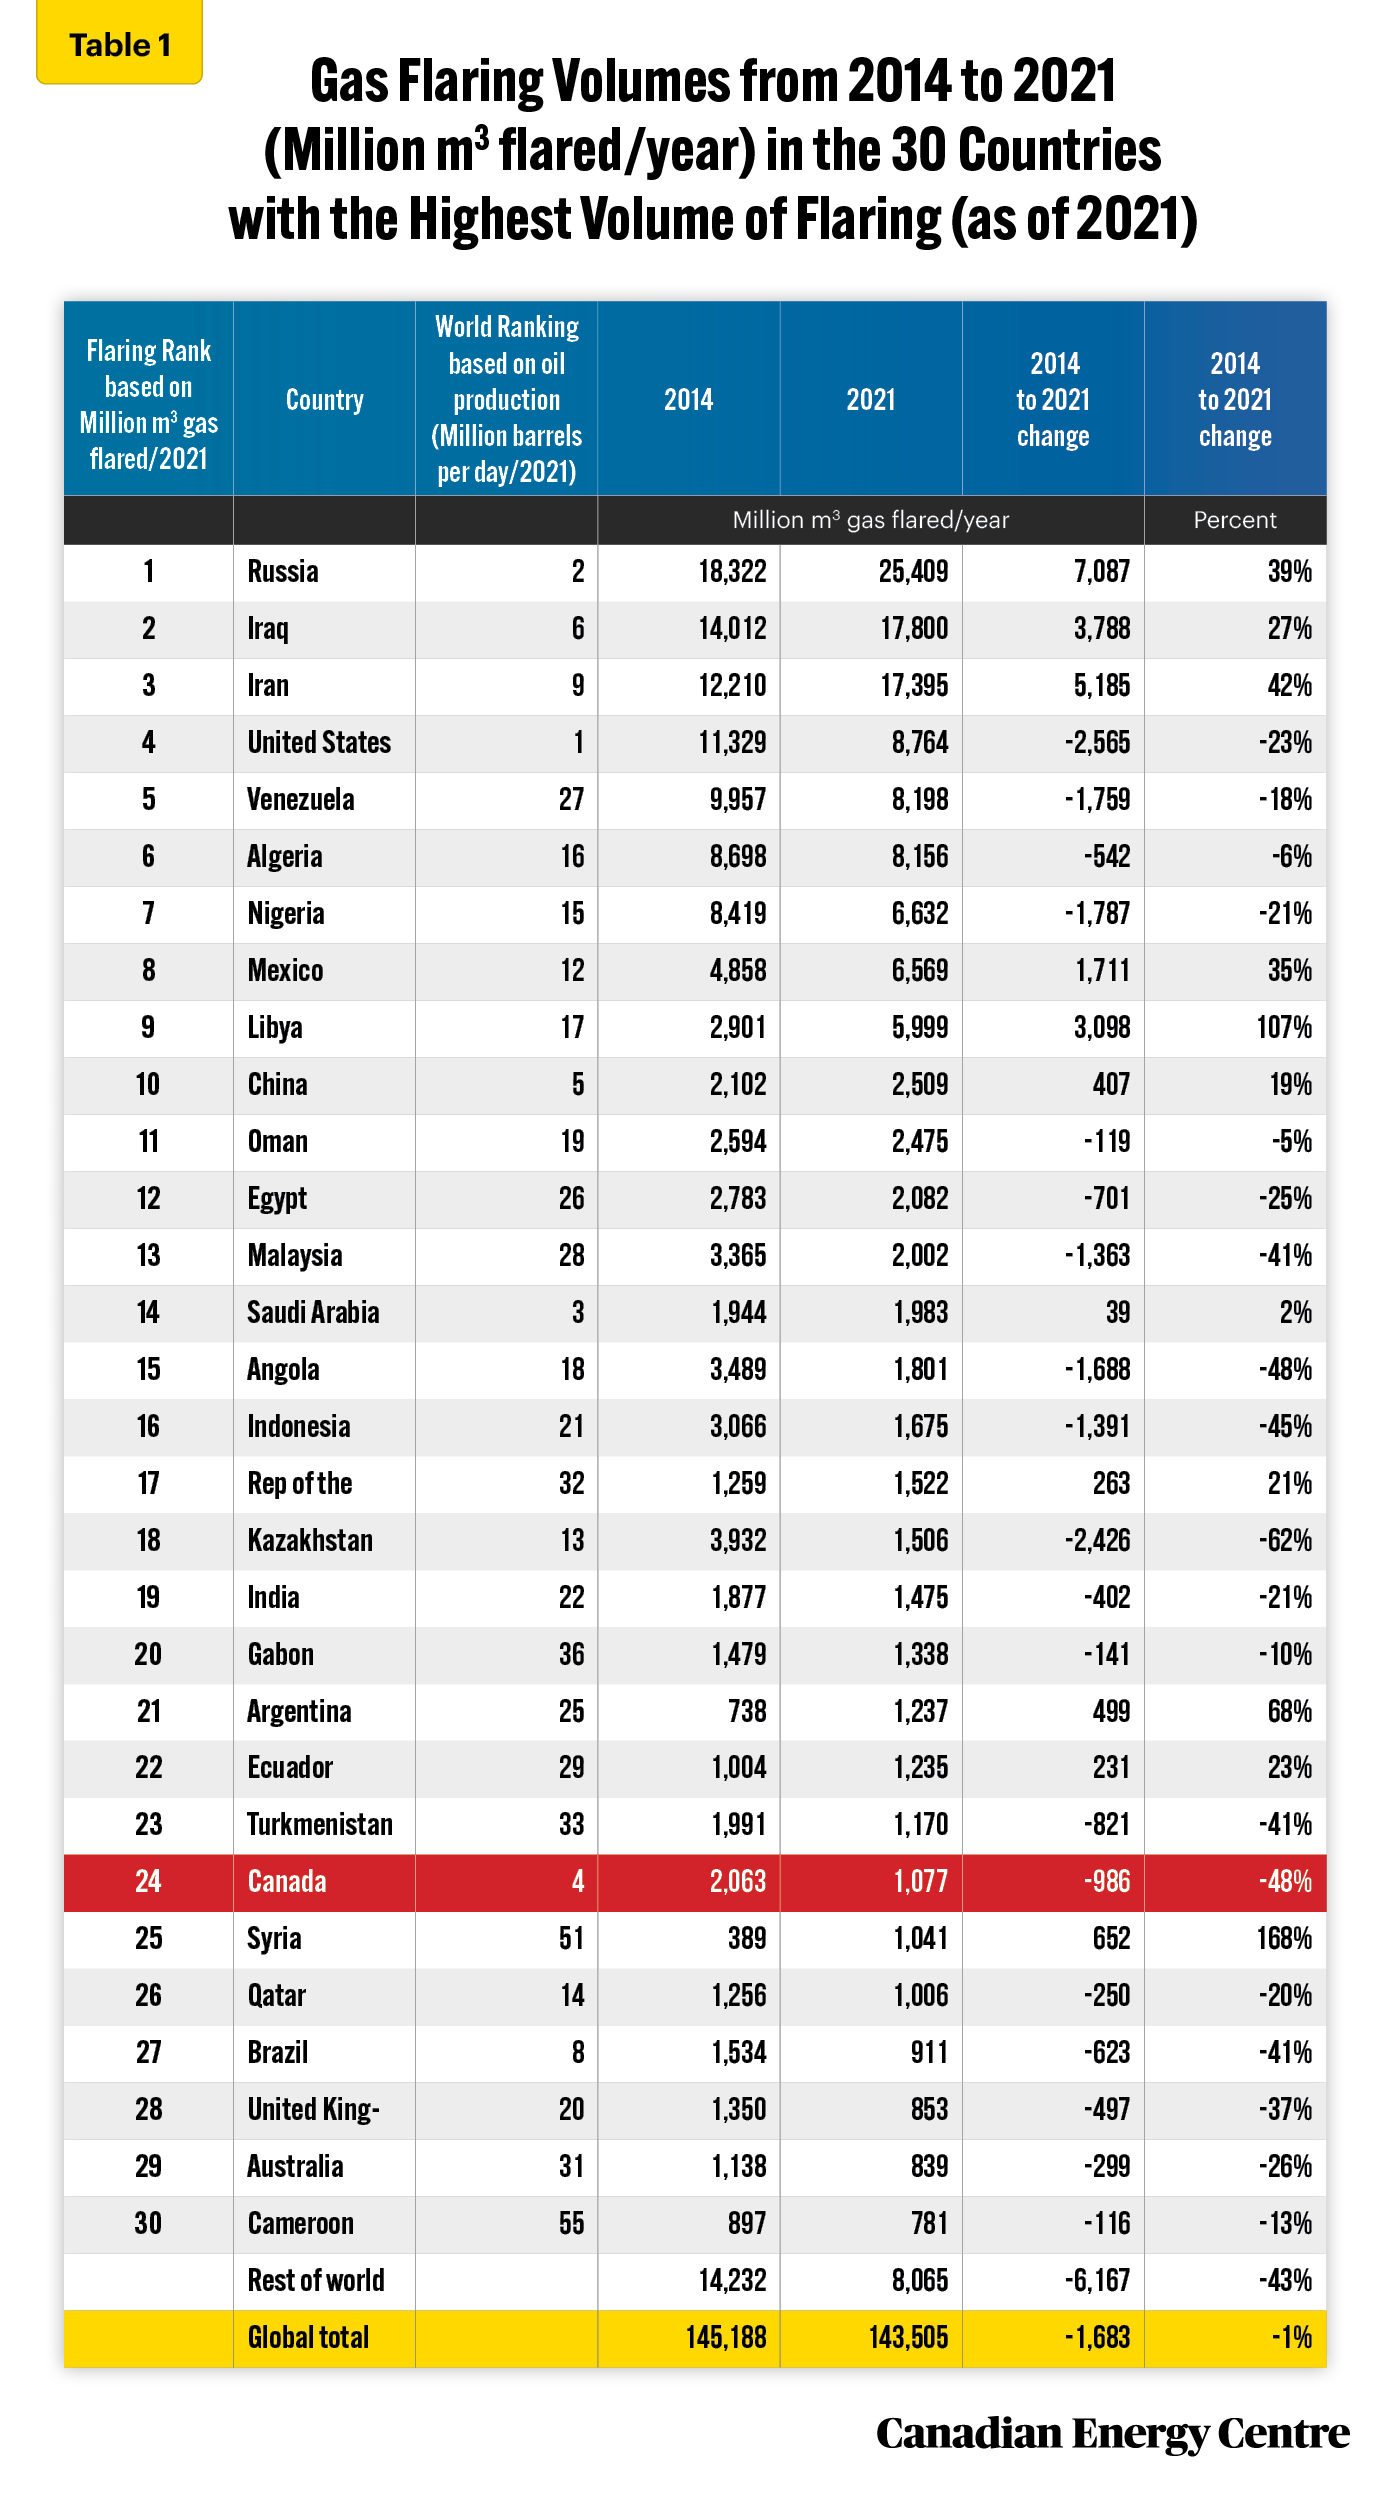
This Fact Sheet uses World Bank data to provide international comparisons of flaring only (given the limited international data on venting). It also draws on Enerdata data to compare flaring in major petroleum- and other liquid-producing countries. Table 1 shows gas flaring volumes in 2014 and 2021. In absolute terms, Russia recorded more flaring than any other country at 25,409 million m3 in 2021, 7,000 million m3, or 39 per cent higher, than in 2014. The four countries that were the top GHG emitters through flaring (Russia, Iraq, the U.S., and Iran) accounted for 48.3 per cent of global gas flaring in 2021.
At 1,077 million m3, Canada was the seventh lowest flarer in 2021 (in 24th spot out of top 30 countries). It recorded a decrease in flaring emissions of 986 million m3 from the 2014 level of 2,063 million m3, a 48 per cent drop. In 2021 Canada’s share of global gas flaring was just 0.8 per cent, despite it being the world’s fourth largest producer of oil and natural gas (see Table 1).
Source: World Bank (Undated) and Enerdata (2022).
More flaring worldwide in 2021 than in 2014
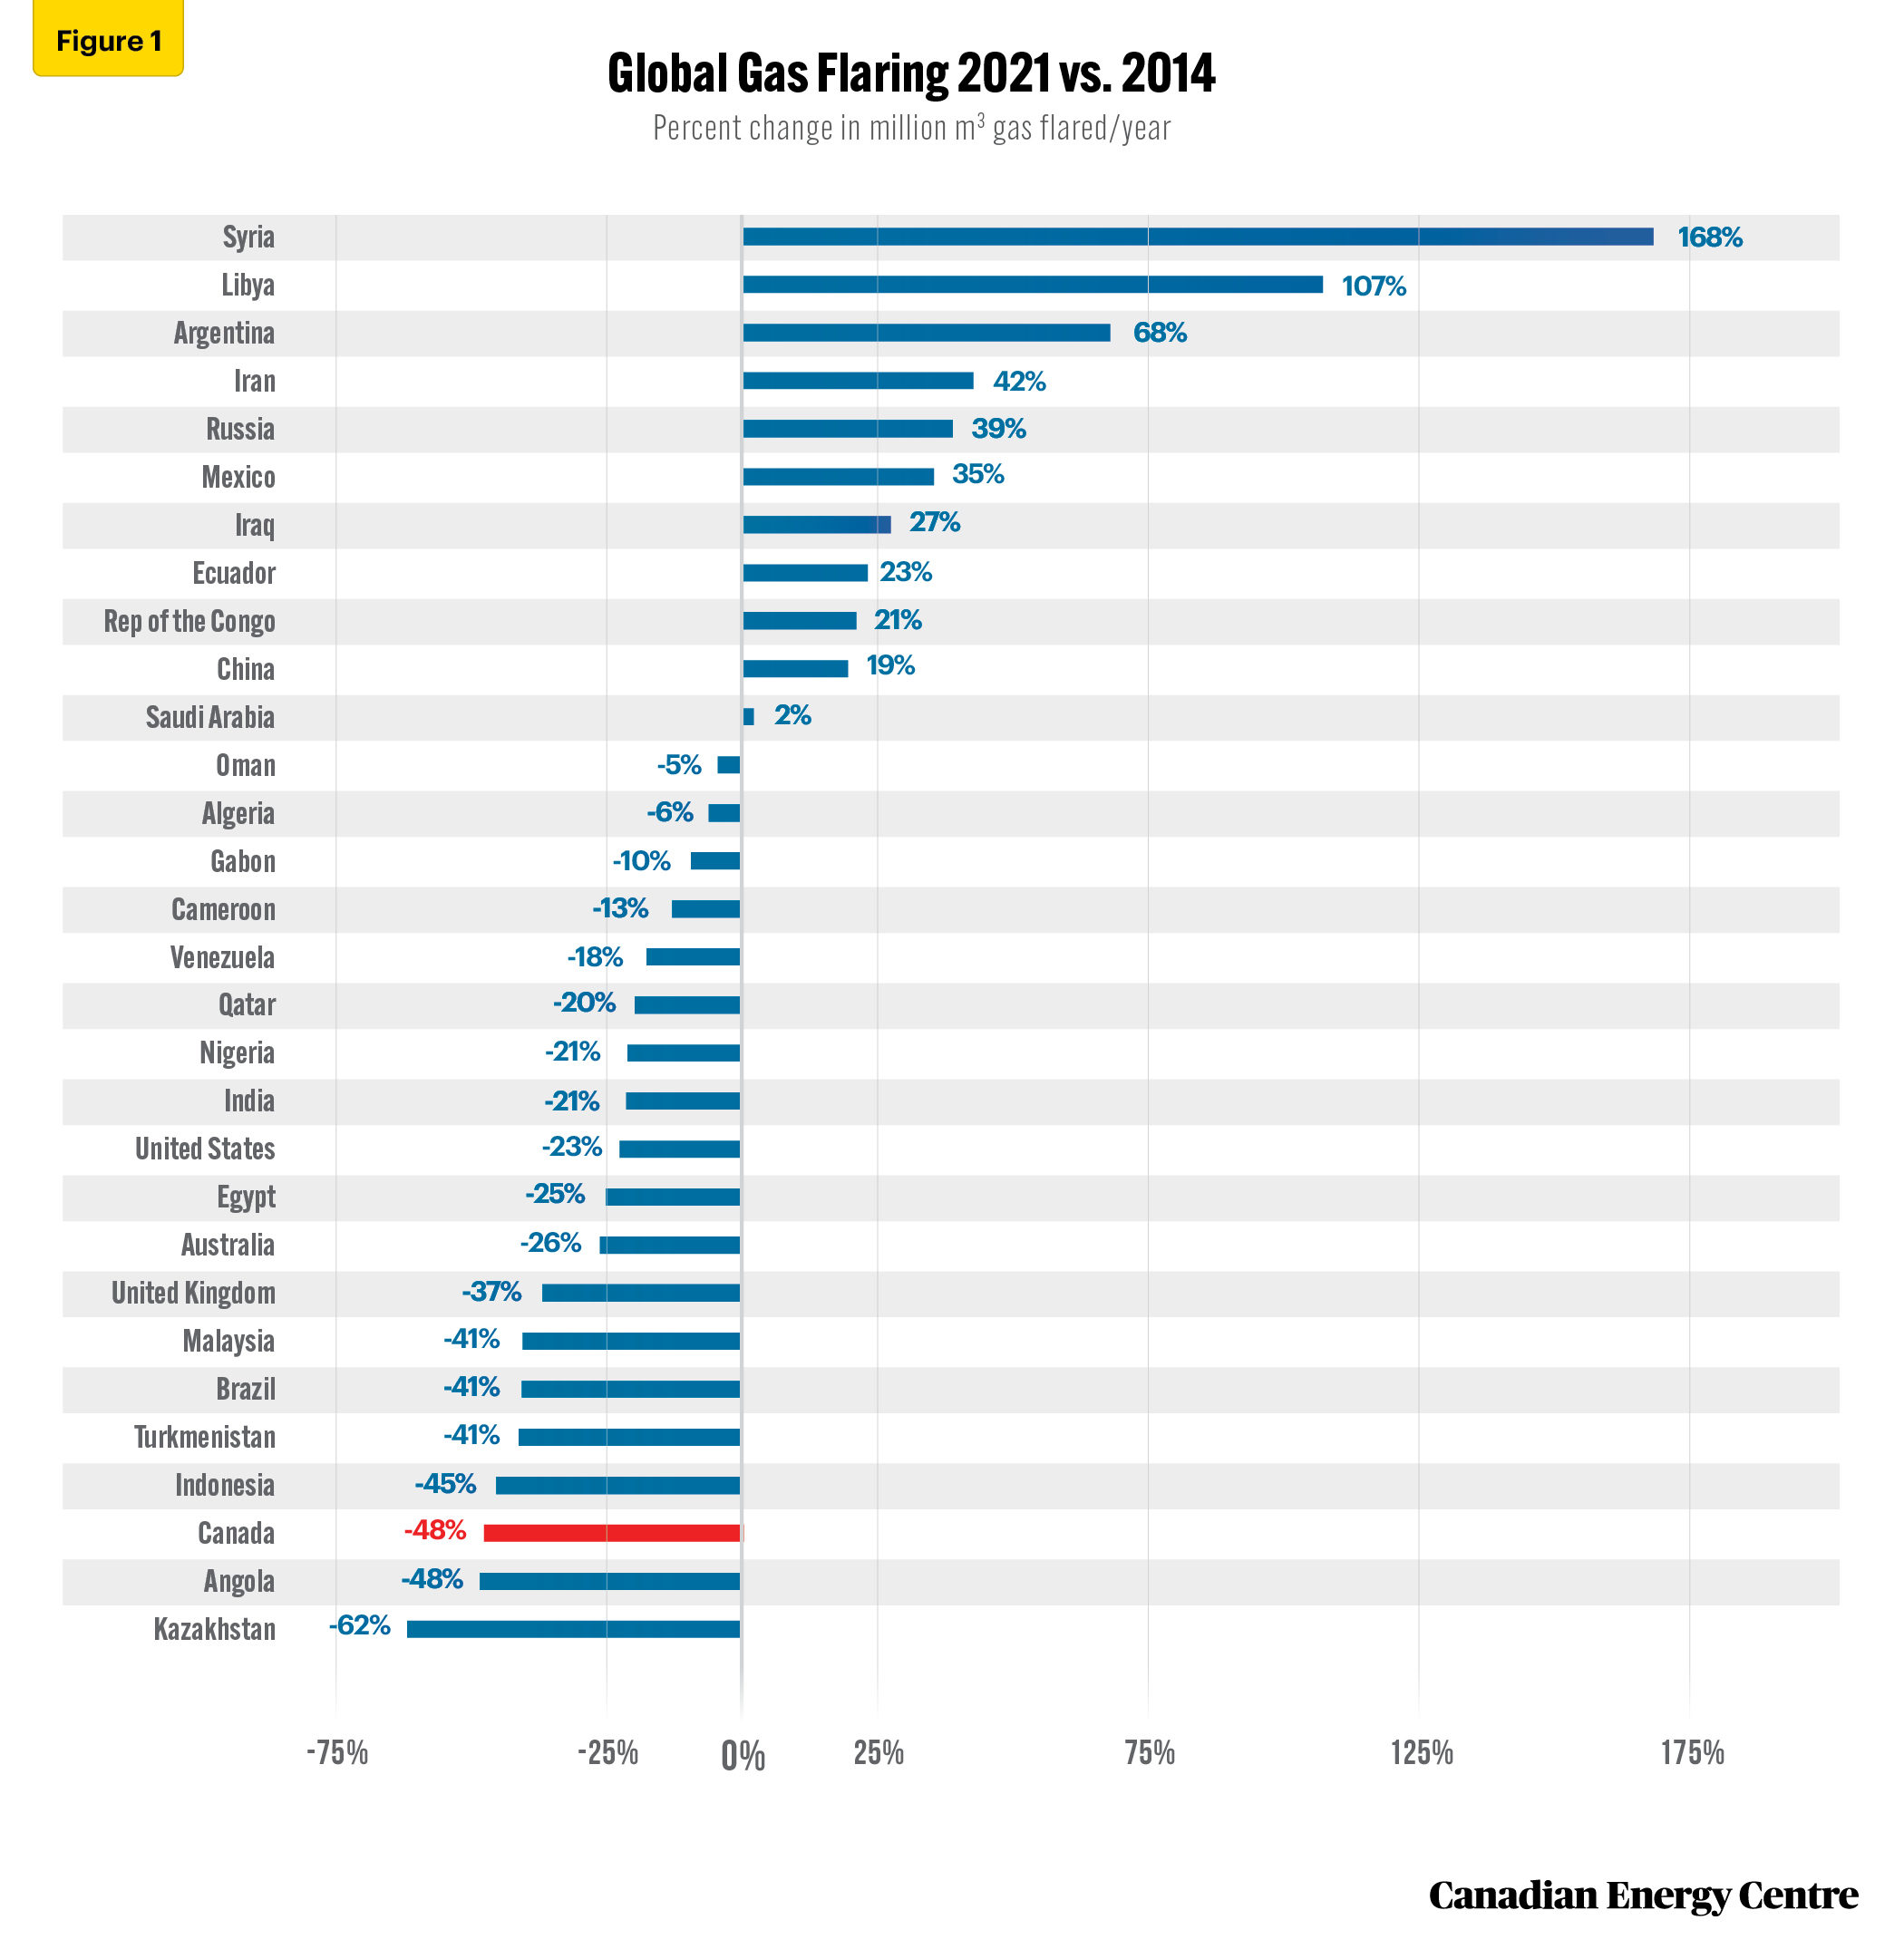
Figure 1 shows the change in flaring volumes between 2014 and 2021. In total, 19 countries flared more in 2021 than they did in 2014, while 11 countries flared less.
- The five countries that showed the greatest increase in flaring between 2014 and 2021 were Syria (168%) Libya (107%), Argentina (68%), Iran (42%), and Russia (39%).
- The five countries that showed the greatest decrease in flaring between 2014 and 2021 were Kazakhstan (-62%), Canada (-48%), Angola (-48%), Indonesia (-45%), and Turkmenistan, Brazil, and Malaysia (each -41%).
Source: World Bank (Undated).
Comparing flaring to increased production
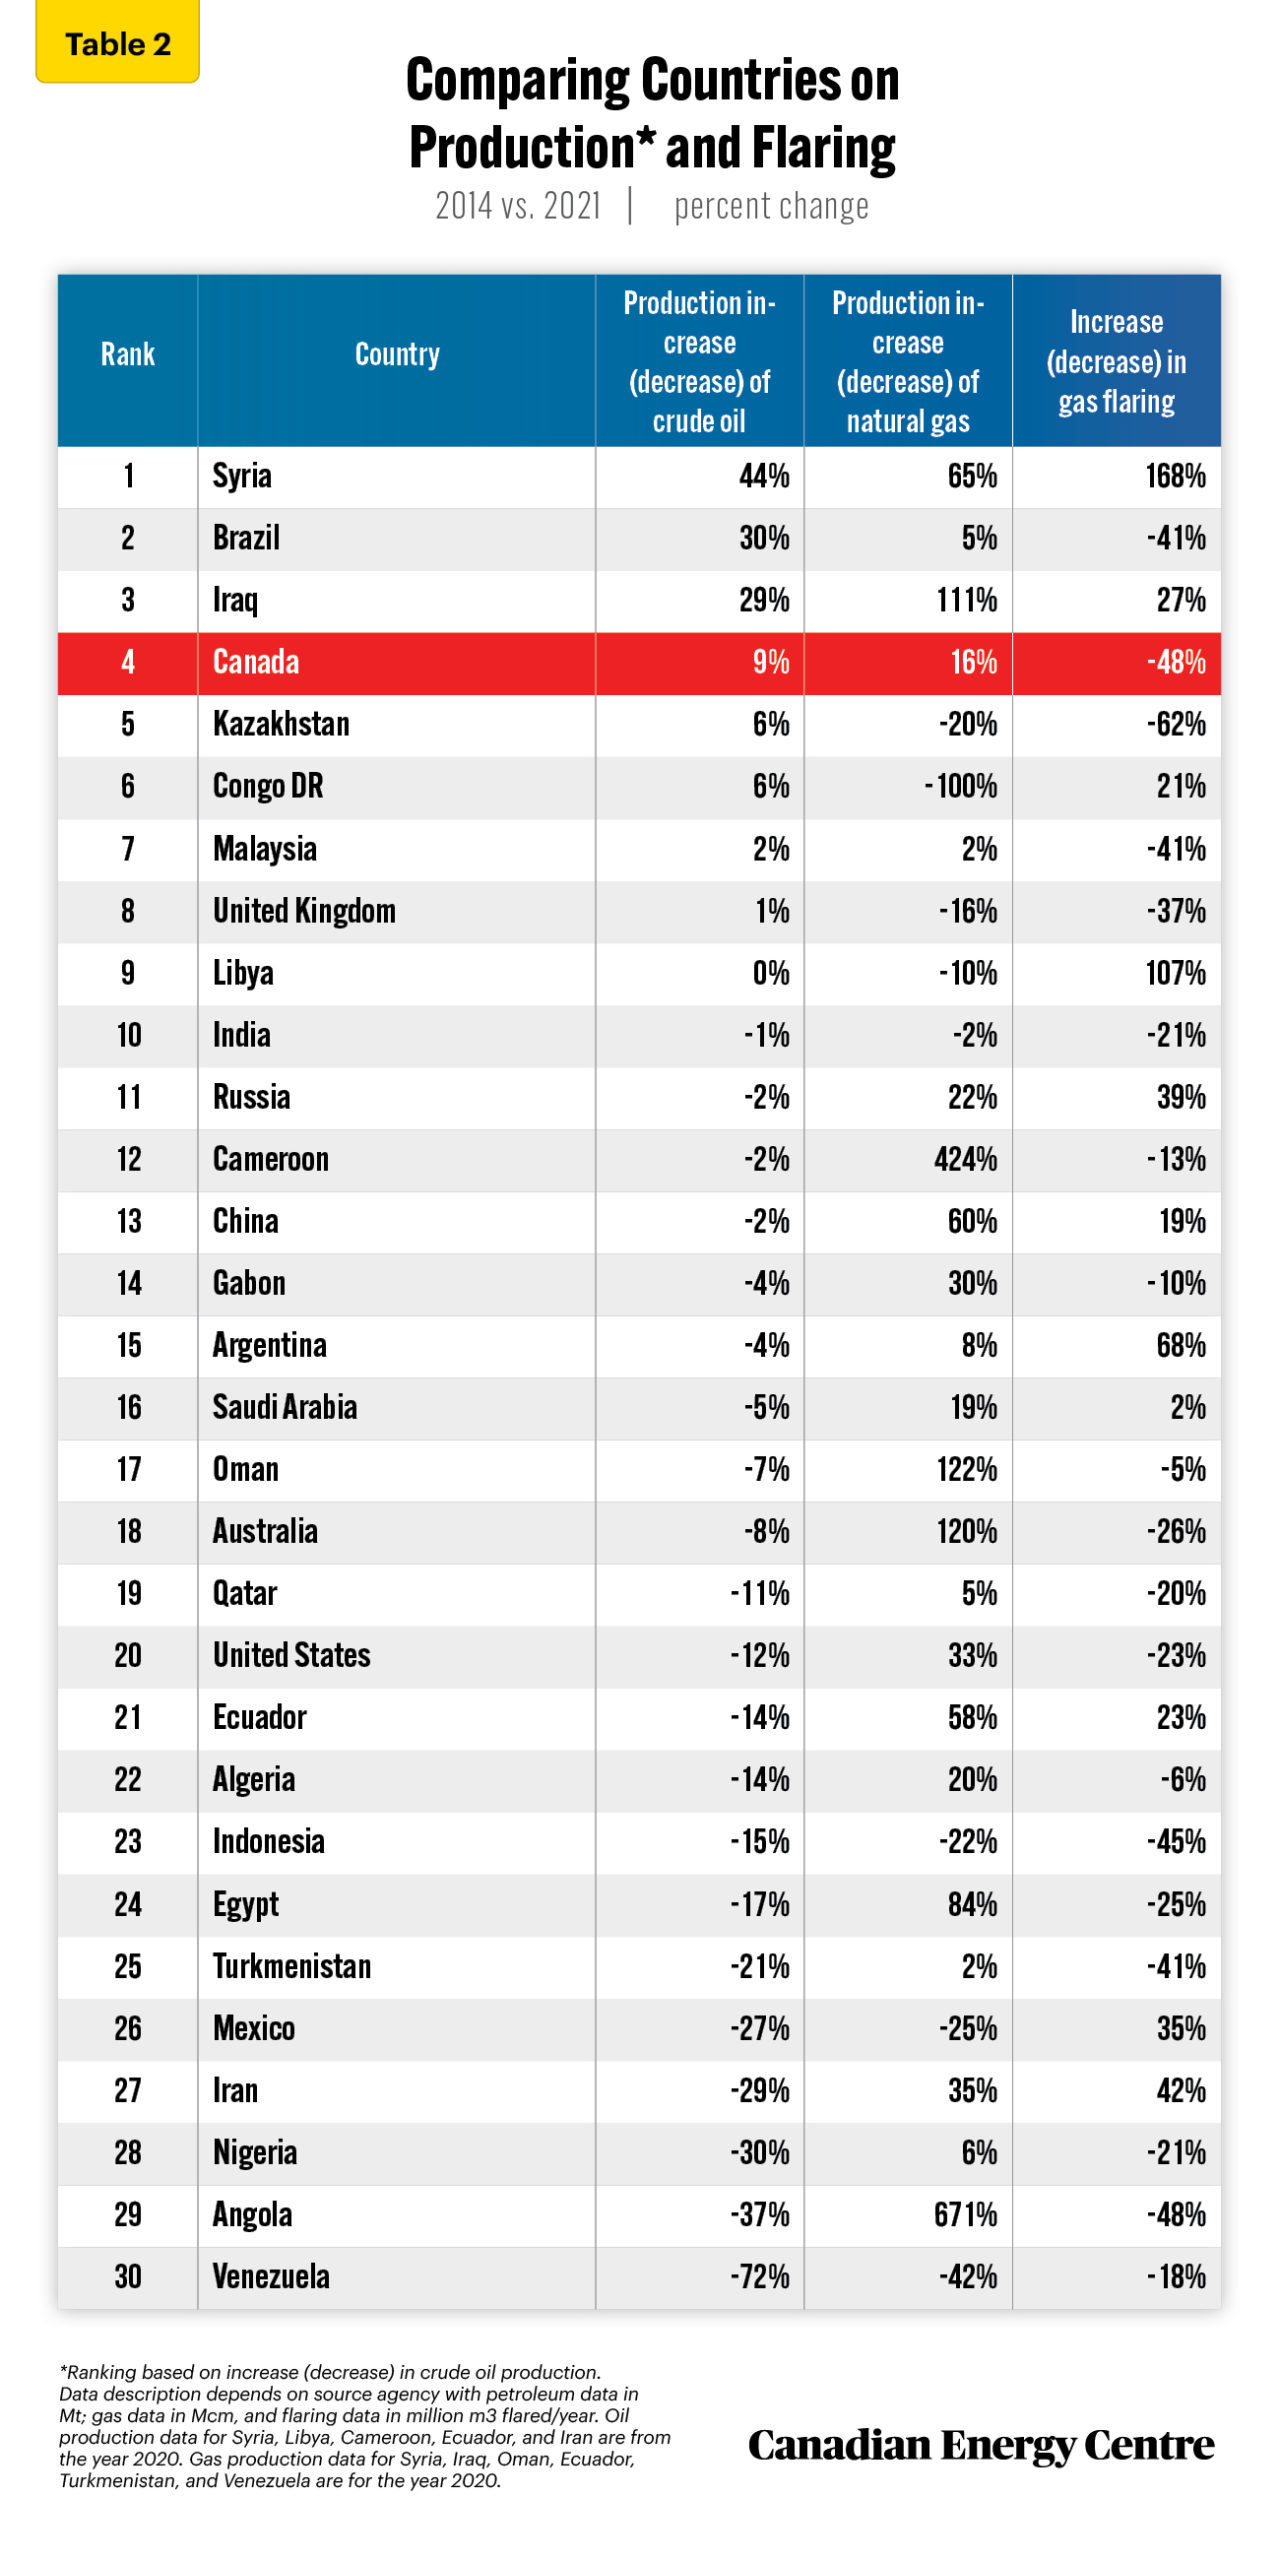
The decreases in flaring for Canada shown in Table 1 and Figure 1 understate the magnitude of the decline in flaring in the country between 2014 and 2021. That is because Canada’s production of crude oil increased by 9 per cent and natural gas production rose by 16 per cent in that period, all the while decreasing flaring by 48 per cent (see Table 2).
Canada compares very favourably with the United States, which, over the same period, decreased crude oil production by 12 per cent, increased gas production by 33 per cent, and decreased flaring by 23 per cent.
Source: World Bank (Undated) and Enerdata (2022).
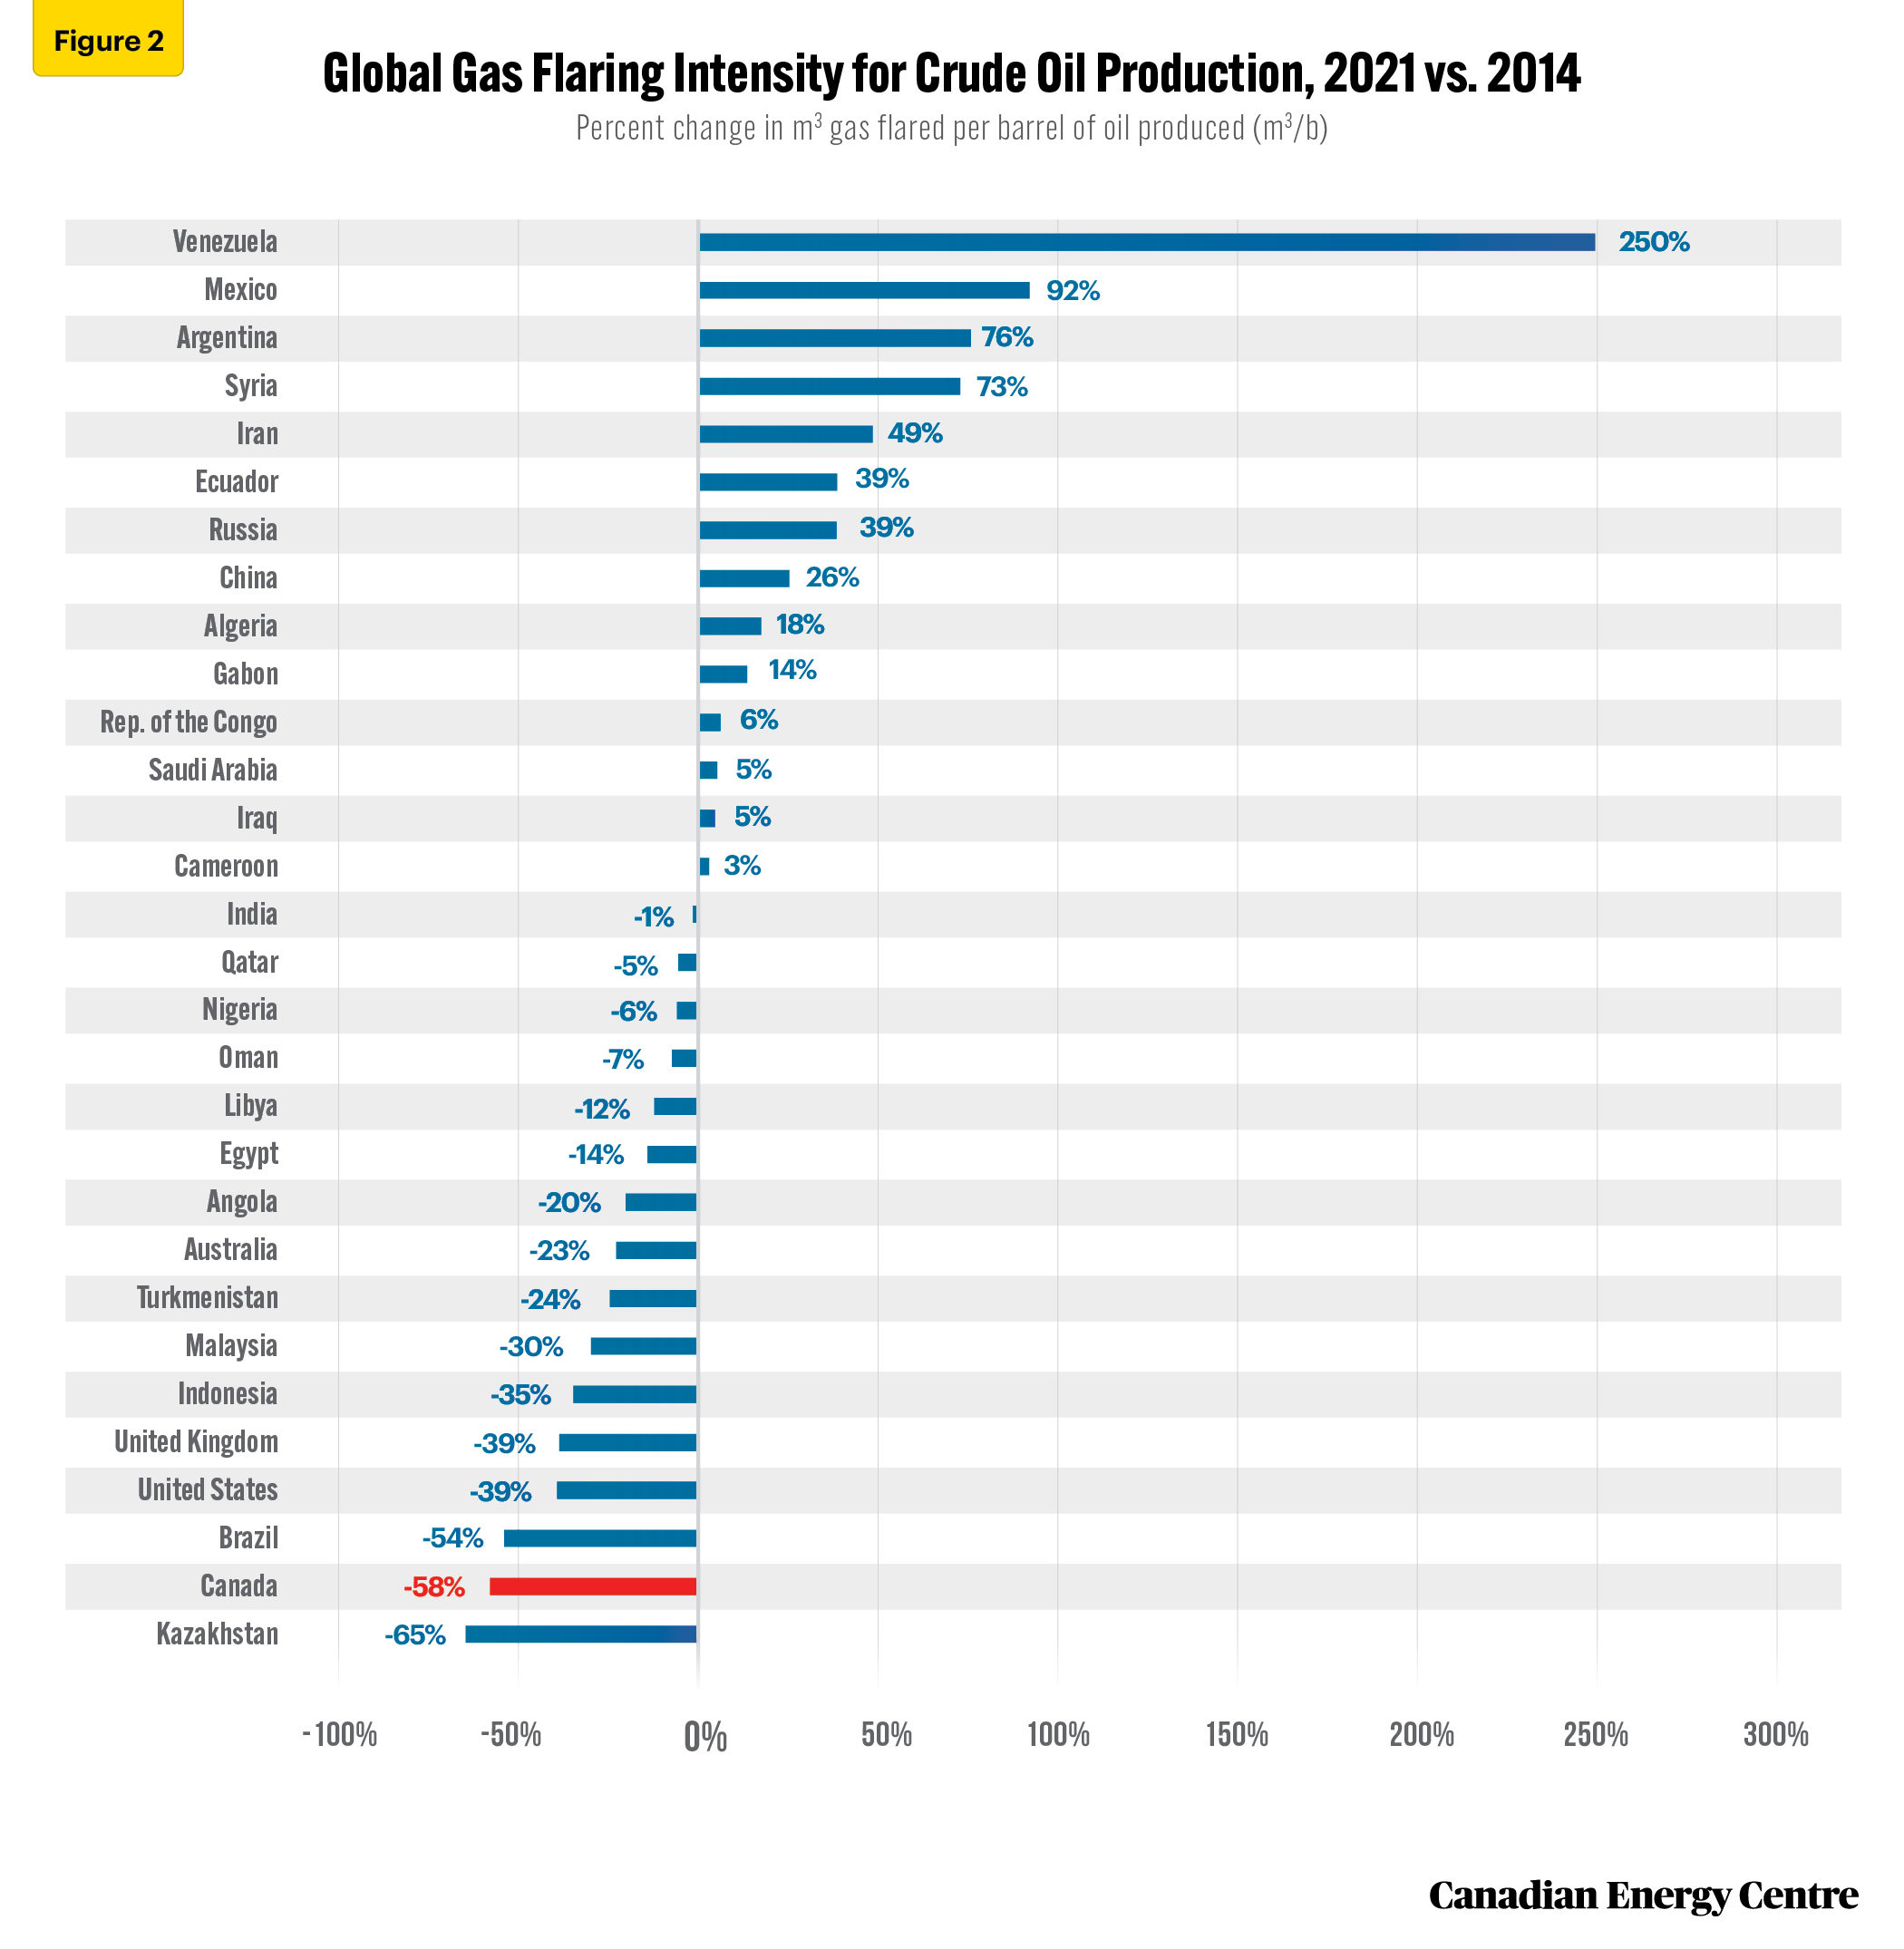
To fully grasp how much more efficient Canada has been in reducing flaring, Figure 2 compares both flaring and production for crude oil only. In Canada, gas flaring intensity (gas flared per barrel of oil produced) declined by 58 per cent between 2014 and 2021. Venezuela, which produces heavy crude oil similar to Canada’s, saw flaring increase by 250 per cent (see Figure 2). Only Kazakhstan, which recorded a per-barrel reduction in flaring of 65 per cent between 2014 and 2021, showed a decline steeper than Canada’s 58 per cent reduction.
Source: World Bank (Undated)
Conclusion
Global gas flaring and venting contribute to greenhouse gas emissions. But it is possible for countries to both increase their oil and gas production and still reduce flaring and venting. Canada is one noteworthy example of a country that has significantly reduced flaring not only compared to its increased production volumes of petroleum and other liquids, but also in absolute terms.
Notes
This CEC Fact Sheet was compiled by Ven Venkatachalam and Lennie Kaplan at the Canadian Energy Centre: www.canadianenergycentre.ca. All percentages in this report are calculated from the original data, which can run to multiple decimal points. They are not calculated using the rounded figures that may appear in charts and in the text, which are more reader friendly. Thus, calculations made from the rounded figures (and not the more precise source data) will differ from the more statistically precise percentages we arrive at using source data. The authors and the Canadian Energy Centre would like to thank and acknowledge the assistance of two anonymous reviewers in reviewing the data and research for this Fact Sheet.
References (all links live as of Sept 5, 2022)
Alberta Energy Regulator (2022), Directive 060: Upstream Petroleum Industry Faring, Incinerating, and Venting <https://bit.ly/3AMYett>; BC Oil and Gas Commission (2021), Flaring and Venting Reduction Guideline, version 5.2 <https://bit.ly/3CWRa0i>; Canada-Newfoundland and Labrador Offshore Petroleum Board (2007), Offshore Newfoundland and Labrador Gas Flaring Reduction <https://bit.ly/3RhKpKu>; D&I Services (2010), Saskatchewan Energy and Resources: S-10 and S-20 <https://bit.ly/3TBrVGJ>; Enerdata (2022), Global Energy and CO2 database <https://bit.ly/2QDPgJT>; Johnson, Matthew R., and Adam R. Coderre (2012), Compositions and Greenhouse Gas Emission Factors of Flared and Vented Gas in the Western Canadian Sedimentary Basin, Journal of the Air & Waste Management Association 62, 9: 992-1002 <https://bit.ly/3cJRqPd>; Environment Canada (2016), Technical Guidance on Reporting Greenhouse Gas Emissions/ Facility Greenhouse Gas Emissions Reporting Program <https://bit.ly/3CVQR5C>; Natural Resources Canada (Undated), Oil Resources <https://bit.ly/3oWWhW0>; World Bank (Undated), Global Gas Flaring Data <https://bit.ly/3zXuxGX>.
Creative Commons Copyright
Research and data from the Canadian Energy Centre (CEC) is available for public usage under creative commons copyright terms with attribution to the CEC. Attribution and specific restrictions on usage including non-commercial use only and no changes to material should follow guidelines enunciated by Creative Commons here: Attribution-NonCommercial-NoDerivs CC BY-NC-ND.