Overview
In this CEC Research Brief (which can be downloaded here as a pdf), we examine reserves or remaining marketable natural gas resources,¹ marketable production, and revenue trends in natural gas markets in Ontario, Quebec, Nova Scotia, New Brunswick, and Newfoundland & Labrador and compare them to key northern US states (Pennsylvania, Ohio, North Dakota, and West Virginia). The latter have all experienced significant increases in production over the past decade.
- West Virginia’s marketed natural gas production reached nearly 2.2 trillion cubic feet in 2019, a seven-fold increase over 2010.
- North Dakota’s marketed natural gas production was 0.85 trillion cubic feet in 2019, a nine-fold increase over 2010;
- Pennsylvania’s marketed natural gas production was about 6.9 trillion cubic feet in 2019, a 12-fold increase over 2010;
- Ohio’s marketed natural gas production was 2.7 trillion cubic feet in 2019, a 34-fold increase over 2010.
- In 2018/19, alone, those four U.S. states brought in nearly U.S. $1.8 billion (Canadian $2.3 billion) in oil and natural gas revenues.
This Research Brief examines the potential for Ontario, Quebec, Nova Scotia, New Brunswick, and Newfoundland & Labrador² to replicate the experience in key northeastern US states and expand their natural gas production. In short, can those provinces do so, and produce at home natural gas or import it from neighbouring provinces, rather than importing natural gas from the United States?
The history of US natural gas exports to Canada
Despite Canada’s position as a major producer of natural gas, there has been a rise in imports of natural gas delivered by pipelines from the United States to Ontario, Quebec, Nova Scotia, and New Brunswick over the past two decades (see Figure 1).
The Canada Energy Regulator has chronicled how natural gas imports from the U.S. into eastern Canada have been increasing as a result of the development of shale gas resources in the Marcellus and Utica basins in the U.S. Northeast (Canada Energy Regulator, 2018). In fact, by 2012, according to the U.S. Energy Information Administration (EIA), Canada was importing over 0.97 trillion cubic feet (tcf) of natural gas by pipeline from the United States, an increase of 1,233 per cent since 2000 (U.S. EIA, 2020). Imports then declined for four years until resuming an upward trajectory and reaching 0.97 tcf again in 2019.
1. According to Natural Resources Canada, “Canadian marketable natural gas resources refer to natural gas that is in a marketable condition, after the removal of impurities and after accounting for any volumes used to fuel surface facilities. Marketable resources are recoverable using existing technologies, based on geological information, but much of the drilling necessary to produce the natural gas has not yet been performed” (Natural Resources Canada, undated a).
2. As we will describe in more detail, Newfoundland & Labrador’s natural gas reserves are largely offshore, associated with oil production, and do not have pipeline access to any markets. Despite that, there is potential for markets for Newfoundland & Labrador’s natural gas.
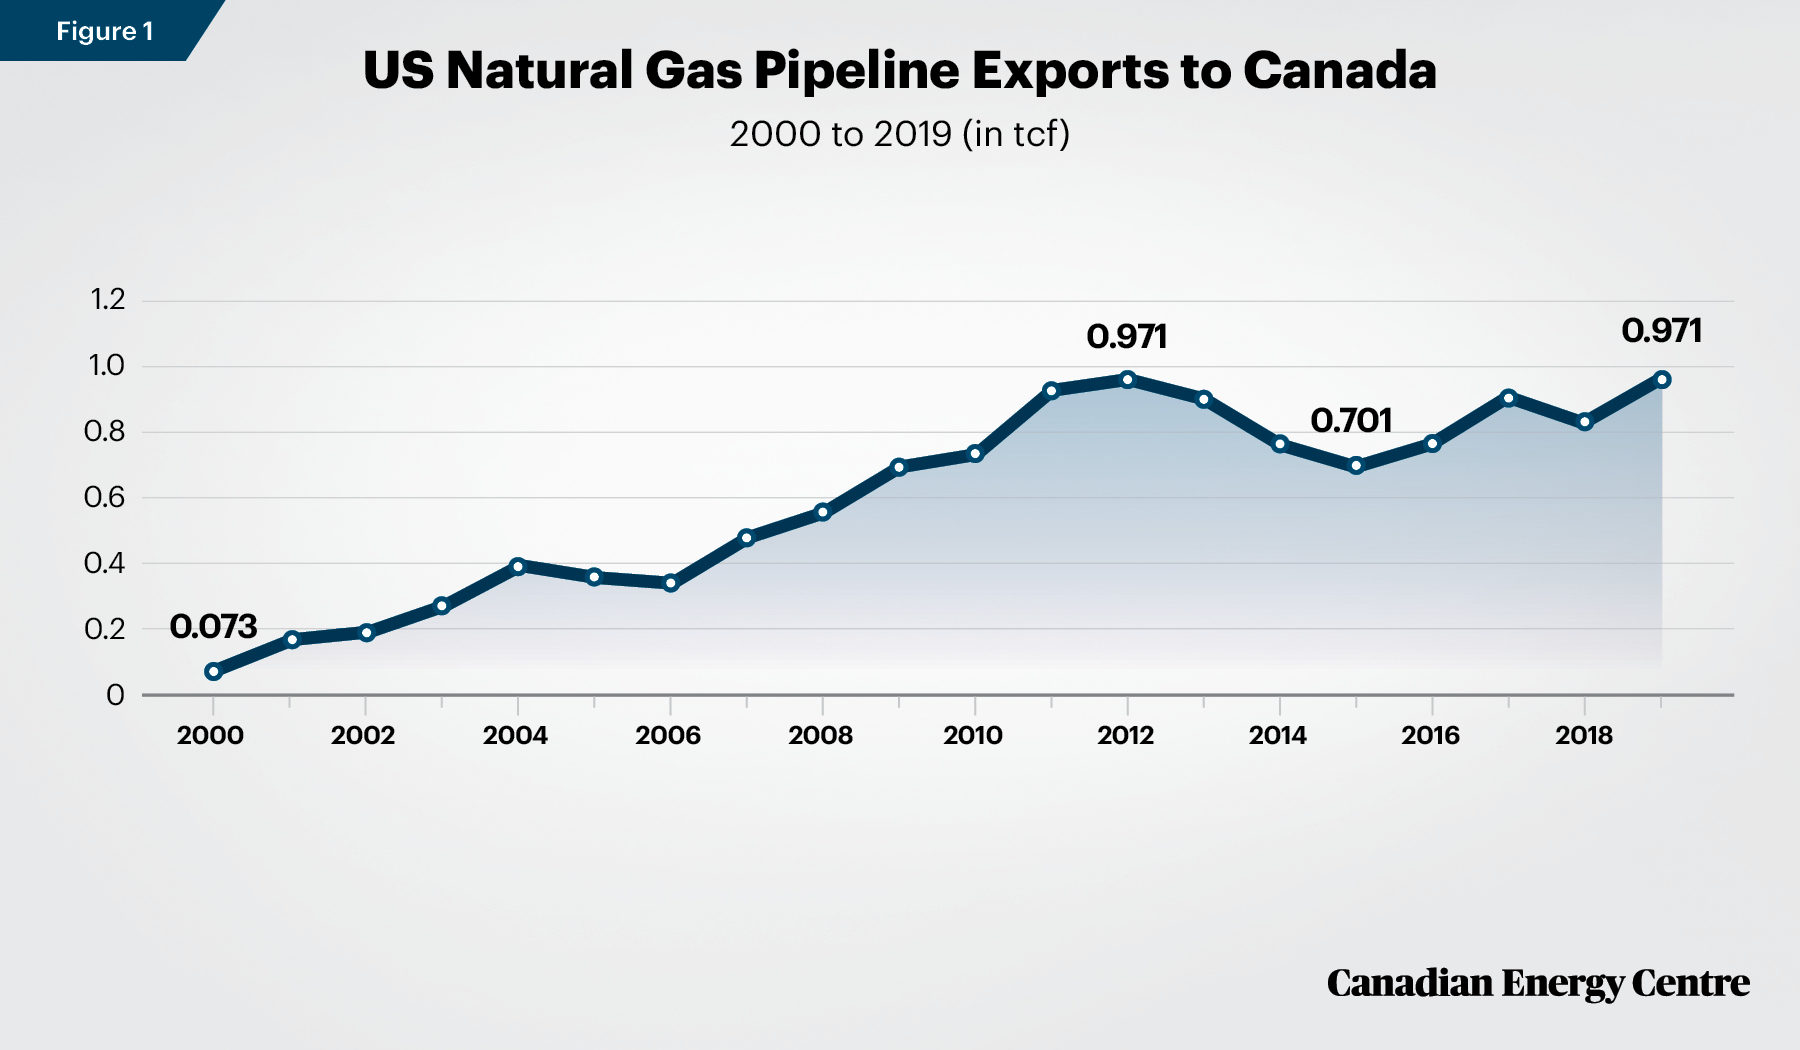
Source: U.S. Energy Information Administration, 2020
An overview of the natural gas industry in the central and eastern Canadian provinces
Central and eastern Canada, which includes Ontario, Quebec,and the Atlantic Provinces, does have some presence in the Canadian natural gas industry. According to the Canada Energy Regulator, there are 108 tcf of remaining marketable natural gas resources located in central and eastern Canada as of 2019 (Canada Energy Regulator, 2019a).
However, marketed natural gas production in the region was just over 0.2 tcf in 2019, with most of the production occurring offshore in Newfoundland & Labrador. Offshore oil facilities use the power from the natural gas produced in Newfoundland & Labrador; it is not transported to other markets (Canada Energy Regulator, 2020). In 2018, $781 million in oil and gas royalties were collected in central and eastern Canada, with virtually all of that ($779 million) being oil and gas royalties collected in Newfoundland & Labrador (Statistics Canada, undated).
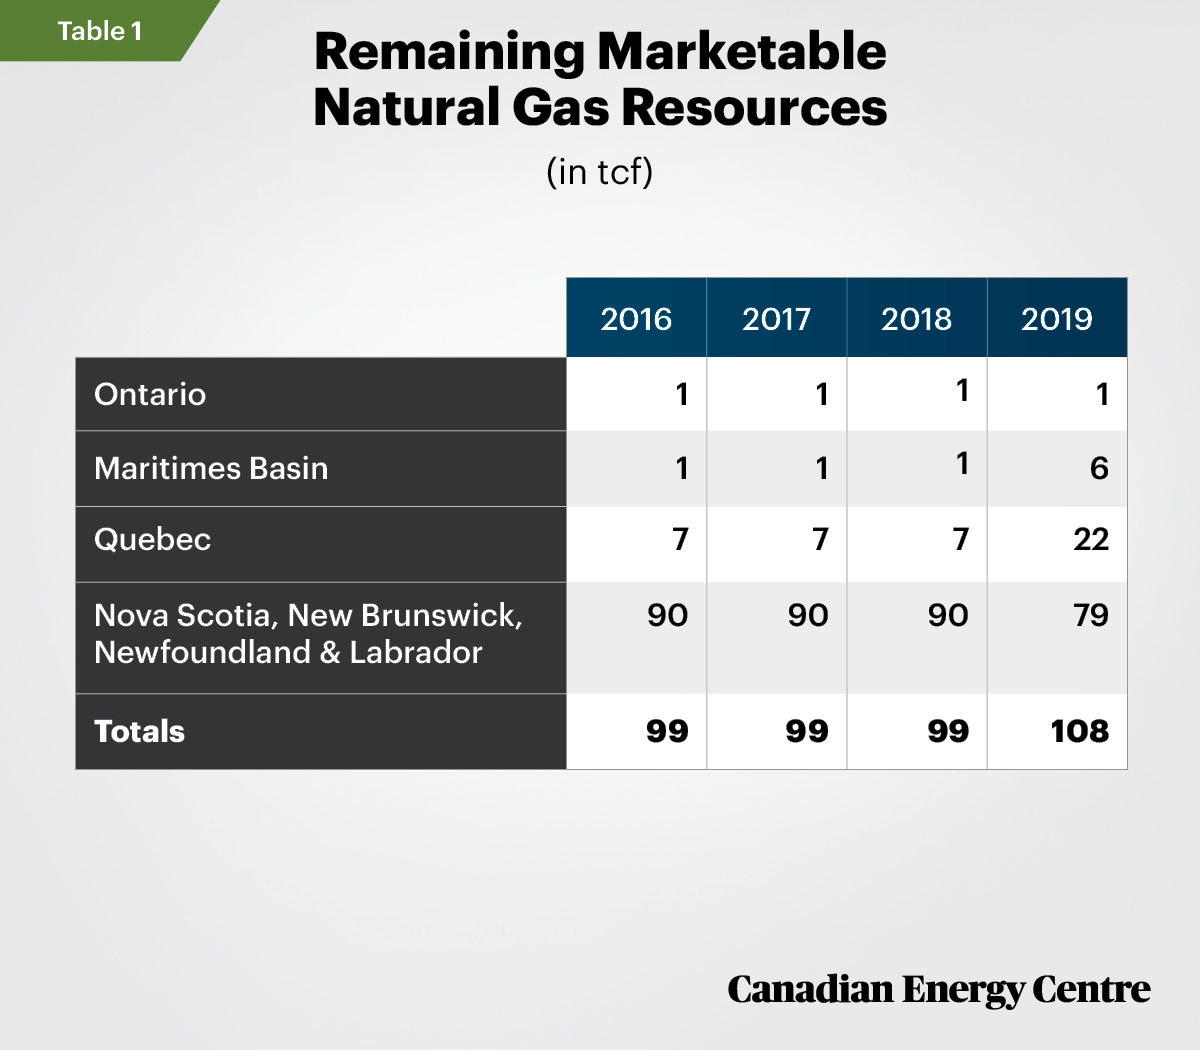
Source: Canada Energy Regulator, 2019a
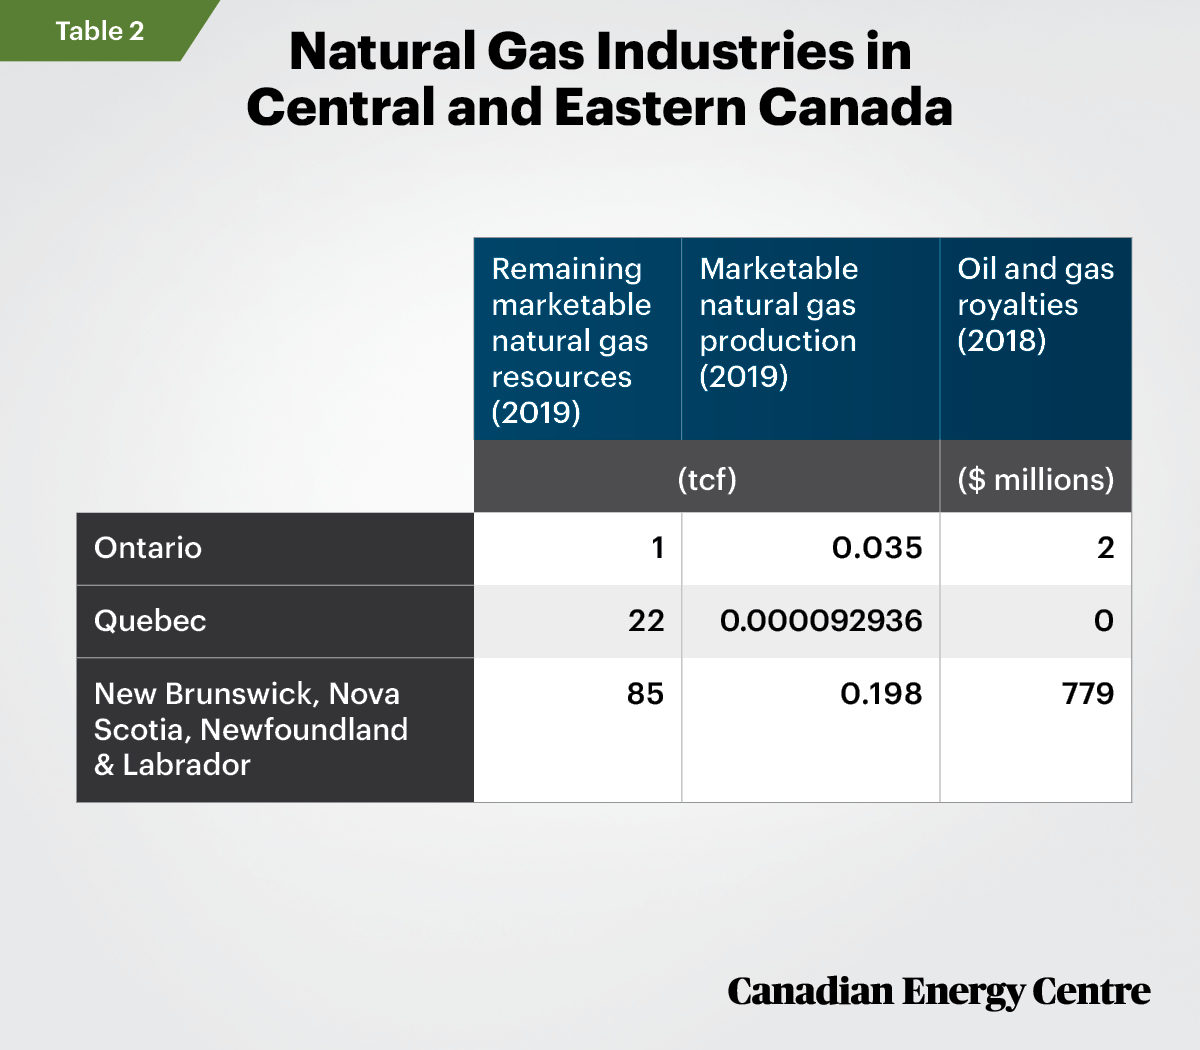
Sources: Canada Energy Regulator, 2019a; Canada Energy Regulator, 2020; and Statistics Canada, undated.
Synopsis of the Ontario natural gas market
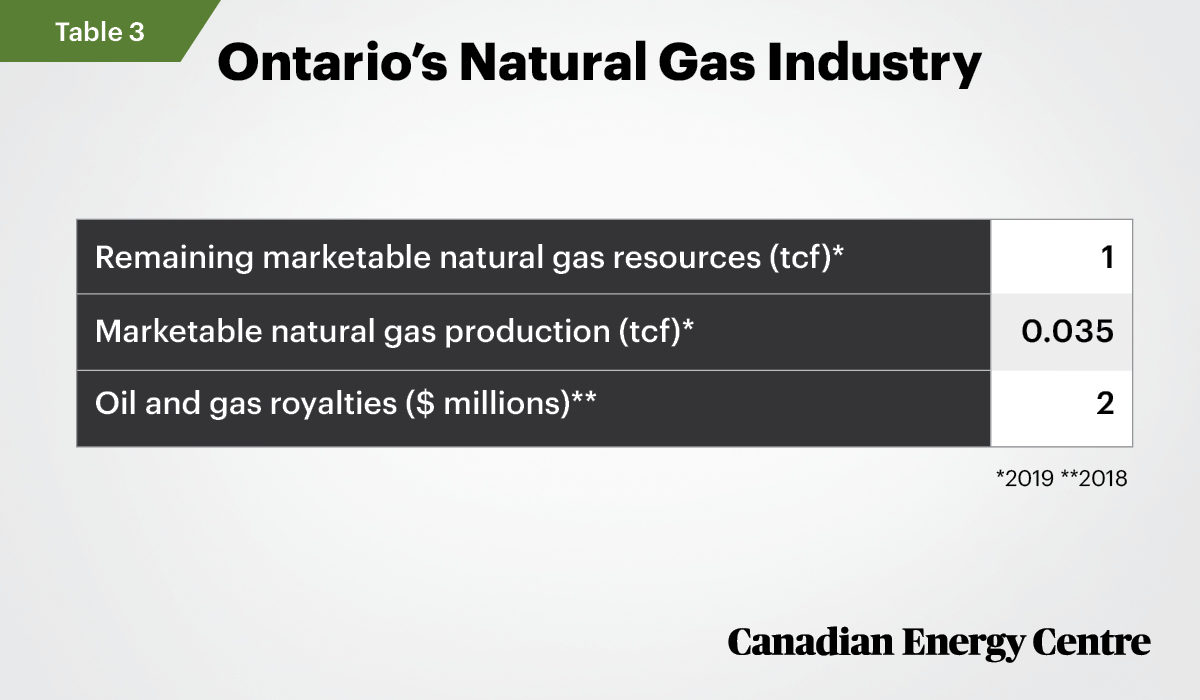
Ontario’s remaining marketable natural gas resources have been assessed at about 1 tcf as of 2019 by the Canada Energy Regulator (see Table 3). This represents little change from 2016 (Canada Energy Regulator, 2019e).
In 2019, marketable natural gas production in Ontario was just 0.035 tcf, representing less than 0.1 per cent of total Canadian natural gas production. Natural gas is produced in southwestern Ontario near Sarnia (Canada Energy Regulator, 2019e).
According to the Canada Energy Regulator, “Historically, Ontario was a consumer of western Canadian natural gas; more natural gas was exported to the U.S. than imported. In recent years, Ontario has become a net importer and has increased gas imports from the U.S. Northeast and Midcontinent” (Canada Energy Regulator, 2019e).
Between 2007 and 2018, Ontario collected just $38 million in oil and gas royalties (Statistics Canada, undated).
Possible development
Despite the lack of natural gas production in the province, there are some shale gas resources in Ontario. The three major shale gas accumulations in Ontario are the Kettle Point Formation, the Collingwood/Blue Mountain Formations, and the northernmost limit of the Marcellus Shale that extends from Pennsylvania and New York.
Ontario also has strategic importance in North American natural gas markets due to the presence of the Dawn Hub in the southwest of the province, one of North America’s major natural gas trading hubs. As the Canada Energy Regulator notes,
With a capacity of about 274 bcf, Dawn is home to more than 30 underground storage pools accounting for approximately 30% of Canada’s underground natural gas storage capacity (Canada Energy Regulator, 2019e).
And as Union Gas notes,
With multiple supply routes from western Canada, midcontinent, the Rockies, and the Gulf of Mexico, as well as the ability to serve markets in the mid-west, eastern Canada and the U.S. Northeast, the Dawn Hub is a reliable, secure, and liquid natural gas trading hub (Union Gas, undated).
Sources: Canada Energy Regulator, 2019a and 2020; Statistics Canada, 2020; Statistics Canada, undated.
Synopsis of the Quebec natural gas industry
Quebec’s remaining marketable natural gas resources have been assessed by the Canada Energy Regulator at 22 tcf as of 2019 (Canada Energy Regulator, 2019f).
Quebec does not produce much natural gas at present. In 2019, marketable natural gas production in Quebec was just 0.000093 tcf (Statistics Canada, 2020). As the Canada Energy Regulator notes, “Historically, Quebec was a consumer of western Canadian natural gas. More recently, growing gas production in the U.S., reversal of export points in Ontario, and additional interconnects between Ontario and Quebec, have enabled higher deliveries of U.S. gas into Quebec” (Canada Energy Regulator, 2019f).
Between 2007 and 2018, Quebec did not collect any oil and gas royalties (see Table 4) (Statistics Canada, undated).
Possible development
Shale gas potential exists in Quebec. However, provincial policies currently prohibit the hydraulic fracturing that is required for shale gas development. According to the Quebec Energy Association,
The province could replace all of its natural gas imports by producing its own local gas, located in the St. Lawrence Lowlands area and other parts of the province. Thus, instead of $2 billion leaving the province each year, the funds would largely stay in Quebec and help create jobs for Quebecers. The companies and workers involved in natural gas development would also pay taxes to the government – money that could be used to pay for schools, hospitals, fixing roads, debt repayment, tax relief and more. (Energy Now, 2020)
Petrel Robertson Consulting, a global consulting firm with expertise in oil and gas development, assessed the reduction in carbon dioxide emissions if Quebec used local natural gas rather than imports:
Quebec consumes large quantities of natural gas – 216 billion cubic feet (bcf) (6.12 billion m3) in 2019. Considerable energy is expended in transporting gas from producing areas in western Canada and the U.S. to Quebec. CO2 emissions associated with transportation energy depend on many variables and assumptions. Choosing reasonable assumptions, we calculate that producing Quebec’s gas supply in the province instead of importing it from western Canada or the United States could save up to almost 170,000 tonnes of CO2-equivalent emissions per year, which is comparable to removing about 35,000 cars from the road each year (Petrel Robertson, 2020).

Sources: Canada Energy Regulator, 2019a and 2020; Statistics Canada, 2020; Statistics Canada, undated.
Synopsis of the New Brunswick, Nova Scotia, and Newfoundland & Labrador natural gas industries
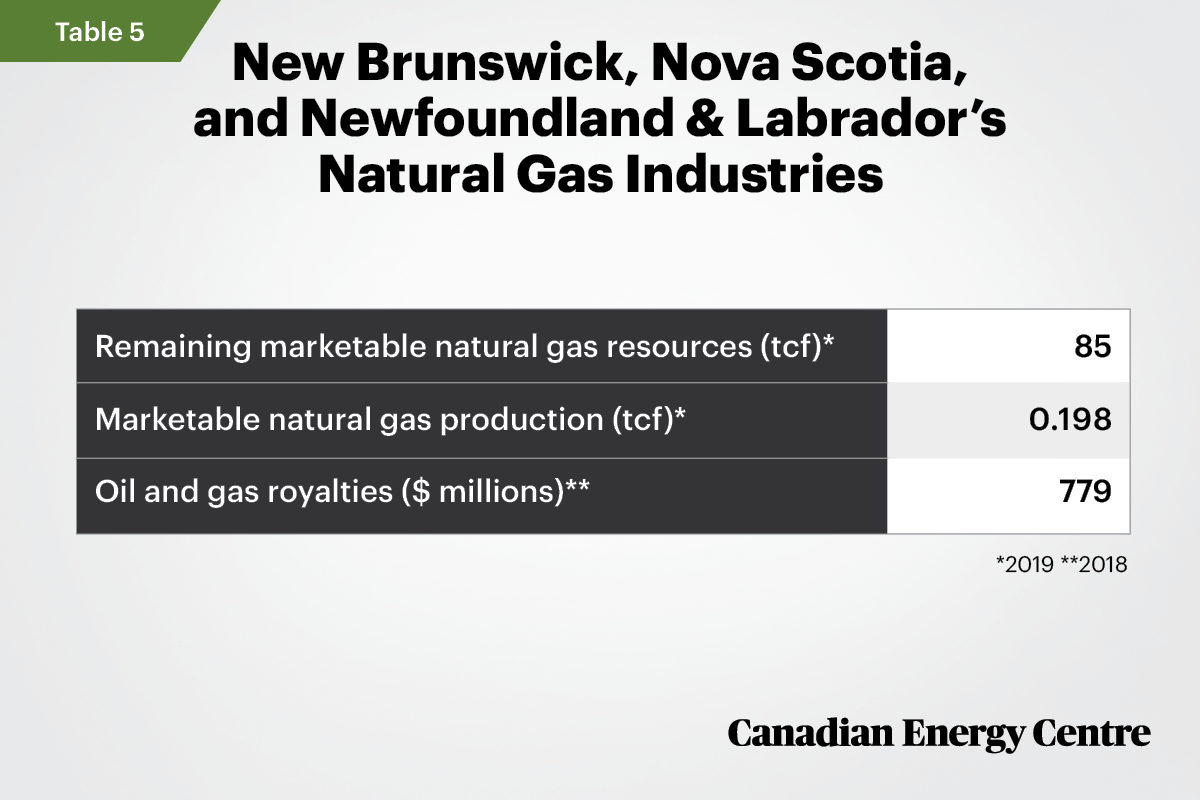
In 2019, remaining marketable natural gas resources were estimated to be 6 tcf in the Maritimes Basin (one of the sedimentary basins that underlies parts of Atlantic Canada and the US) and 79 tcf in Nova Scotia, New Brunswick, and Newfoundland & Labrador (Canada Energy Regulator, 2019c). Most of the 79 tcf in remaining marketable natural gas resources in Atlantic Canada is in Newfoundland & Labrador, offshore, and associated with the offshore oil plays. These natural gas resources could conceivably be used to support future offshore plays, such as the West White Rose and Equinor’s Bay du Nord deep-water oil plays.
New Brunswick
According to the Canada Energy Regulator, marketable natural gas production in New Brunswick was 0.017 tcf in 2019 (Canada Energy Regulator, 2020). Natural gas is produced at the McCully Field, near Sussex, New Brunswick. Since 2014, a moratorium on hydraulic fracturing has been in place in New Brunswick (Canada Energy Regulator, 2019c).
As the Canadian Energy regulator notes,
Natural gas is transported to/from New Brunswick via the Maritimes & Northeast Pipeline (M&NP), which extends from Goldboro, Nova Scotia to an import/export point on the border with Maine near St. Stephen, New Brunswick. In recent years, M&NP has been importing more gas than it exports (80 MMcf/d and 0.8 MMcf/d in 2018, respectively). (Canada Energy Regulator, 2019c)
Between 2007 and 2018, New Brunswick collected just $28 million in oil and gas royalties (Statistics Canada, undated).
Nova Scotia
There was very little natural gas production in Nova Scotia during 2019 (Canada Energy Regulator, 2019d).
Historically, natural gas in Nova Scotia was produced offshore at the Sable Offshore Energy Project and the Ovintiv Deep Panuke Project. However, Sable Island ceased production on December 31, 2018. As the Canada Energy Regulator notes,
During production years, Nova Scotia’s offshore natural gas production was transported on the Maritimes & Northeast Pipeline (M&NP), which extends through Nova Scotia to the border near St. Stephen, New Brunswick where gas was exported to serve the Northeast U.S. market. M&NP also imports gas from the U.S. Northeast during times of peak demand. Although historically exports have exceeded imports, this changed in recent years because of declining Nova Scotia offshore production. In 2018 M&NP imported 80 MMcf/d, while only exporting 0.8 MMcf/d (Canada Energy Regulator, 2019d).
Between 2007 and 2018, Nova Scotia did not collect any oil and gas royalties (Statistics Canada, undated).
Newfoundland & Labrador
Newfoundland & Labrador’s natural gas is currently all produced offshore. In 2019, about 0.181 tcf of natural gas was produced at Newfoundland’s offshore crude oil facilities. The offshore facilities use the natural gas for power; it is reinjected into the ground to maintain reservoir pressure, or flared (Canada Energy Regulator, 2019b).
Between 2007 and 2018, Newfoundland & Labrador collected $10.5 billion in offshore oil and gas royalties, including $779 million in oil and gas royalties in 2018 (Statistics Canada, undated).
Possible development in all three provinces
A 2018 analysis from Nova Scotia’s Department of Energy and Mines found the onshore natural gas resources in Nova Scotia could be worth between $20 billion and $60 billion. Much of the province’s onshore hydrocarbon resources are in shale formations that can be recovered using the process of hydraulic fracturing, a heavily regulated process that has been used safely in Western Canada for more than 60 years. The estimates of gas in-place at the Horton Bluff in Nova Scotia range from 17 tcf to 69 tcf. Nova Scotia is in a prime position to develop its own stable, domestic supply of natural gas – meeting its own demands rather than relying on imports from other jurisdictions (Barnes, 2018).
According to the Canadian Energy Research Institute (CERI):
The (Nova Scotia and New Brunswick) region has significant onshore oil and gas potential, largely stemming from unconventional resources, including shale gas. The Frederick Brook Shale in New Brunswick and the Horton Bluff Shale in Nova Scotia, however, certainly have potential, both benefitting from advances in horizontal drilling, 3-D seismic technology and fracking. These developments in technology are opening up new resources, previously determined as non-productive or not feasible to produce, particularly in the ability to economically recover natural gas and oil from shale rock (Canadian Energy Research Institute, 2017).
The Frederick Brook Shale in New Brunswick is estimated to contain 67.3 tcf of in-place shale gas. The estimates of the Horton Bluff Shale (HBS) in Nova Scotia range from 17 tcf to 69 tcf of in-place gas. CERI assumes the Horton Bluff contains 35 tcf of in-place gas, a value that lies between the two wideranging estimates (Canadian Energy Research Institute, 2017).
Sources: Canada Energy Regulator, 2019a and 2020; Statistics Canada, 2020; Statistics Canada, undated.
In Newfoundland & Labrador, shale and tight resources are concentrated onshore along the west coast of Newfoundland (Natural Resources Canada, undated b). Though several companies hold exploration permits and leases, there is no commercial natural gas production onshore in the province (Alberta, undated).
In 2018, the government of Newfoundland and Labrador’s blueprint for future oil and natural gas development, Advance 2030 – A Plan for Growth in the Newfoundland and Labrador Oil and Gas Industry, outlined plans for commercial natural gas production by 2030 (Newfoundland and Labrador, 2018).
According to Oil and Gas Magazine, the potential for offshore natural gas is significant:
There are an estimated 200 trillion cubic feet of gas potential offshore Newfoundland (in the West Orphan and Flemish Pass regions), and it’s the provincial plan to have natural gas plays moving by 2030. According to the Newfoundland & Labrador Minister of Natural Resources, the resource potential in our offshore is incredible … we have a combined resource potential of 199.6 tcf gas. Offshore Newfoundland currently has four world-class (oil) producing fields and two more about to come on stream. West White Rose and Equinor’s Bay du Nord deepwater oil plays are forecasted to be producing wells within the next five years.
With the discovery of additional resources, market opportunities, and anticipated natural gas, the future looks bright. The provincial commitment is to advance initiatives to ensure industry readiness for gas commercialization, including regulation, development models, local supply opportunities, and labour requirements. As well, the focus of attracting global investment for commercial gas production is a priority.
Offshore Newfoundland, most of the gas can be conveniently found in less than 200 metres of water. The resource base can support a world-scale project, and theoretically, gas projects could yield 2 million tonnes per year. This offshore gas opportunity could quite easily come together if industry players collaborate, share information, and infrastructure to develop it (Olivero, 2020).
Individual state natural gas industries
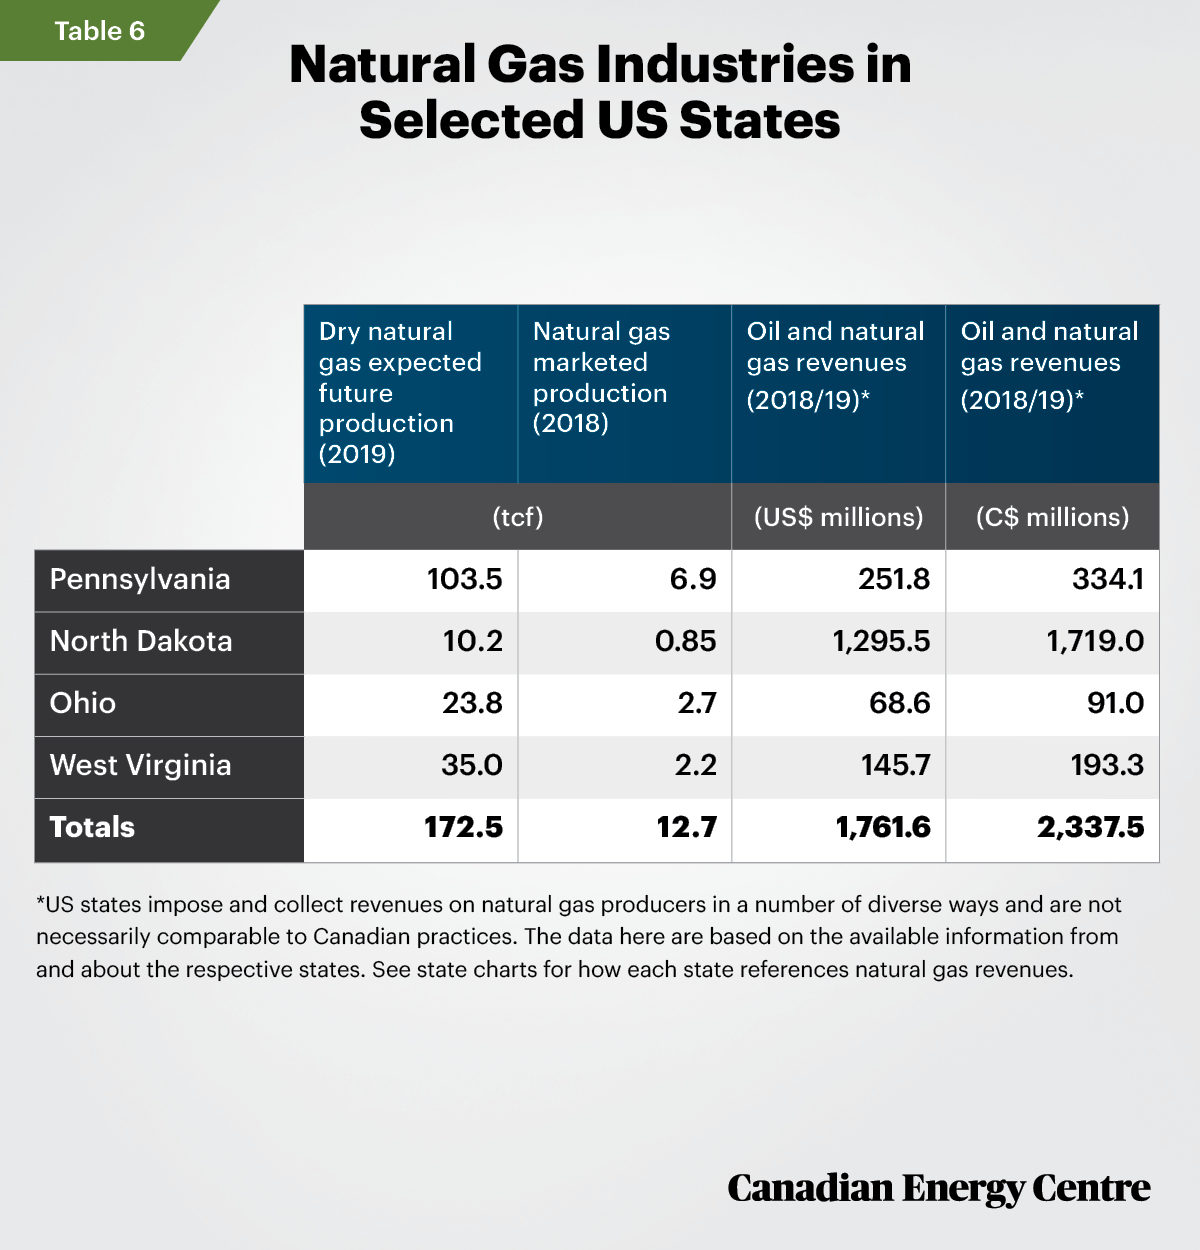
A number of northeastern US states, notably Pennsylvania, North Dakota, Ohio, and West Virginia, have become significant players in North American natural gas markets over the past decade. In 2019, expected future production of dry natural gas in these four states was estimated at over 172 tcf. Natural gas marketed production reached 12.7 tcf in 2018 in these four states, with over C$2.3 billion (US$1.76 billion) in revenues collected from oil and natural gas activities during FY 2018/19.
Synopsis of the Pennsylvania natural gas industry: Production up 12-fold since 2009
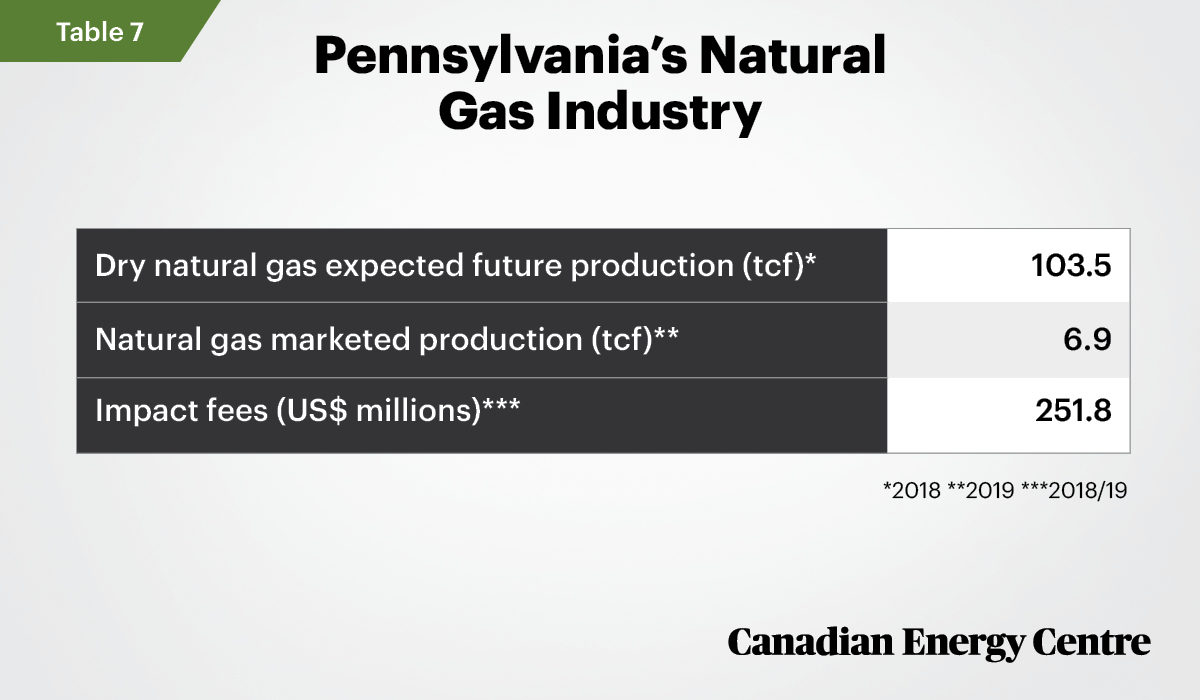
At 103.5 tcf, Pennsylvania is second only to Texas in expected future production of dry natural gas as of 2018 (see Table 7). (Expected future production of dry natural gas in Texas amounted to 126.1 tcf in 2018.) In Pennsylvania, expected future production of dry natural gas increased by nearly 15 times between 2009 to 2018 due to development in the Marcellus Shale. Marcellus extends under three-fifths of Pennsylvania as well as parts of West Virginia, New York, Ohio, and Maryland. The Marcellus Shale has the largest estimated proved reserves of any US natural gas field (U.S. Energy Information Administration, 2020l).
Sources: Bank of Canada (undated); U.S. Energy Information Administration (2020a); U.S. Energy Information Administration (2020c); Ohio Department of Taxation (undated); North Dakota (2018); Pennsylvania Public Utilities Commission (undated); West Virginia State Tax Department (undated).
Pennsylvania’s marketed natural gas production was about 6.9 tcf in 2019, more than 12 times larger than in 2010, and equal to about 20 per cent of total US gas production, making Pennsylvania the second-largest natural gas producer in the nation after Texas, which produced 9.3 tcf in 2019 (U.S. Energy Information Administration, 2020l).
Pennsylvania is the only major gas-producing state in the US that does not have a severance tax, i.e., taxes and fees on the extraction, production, and sale of natural gas and oil. Instead, Pennsylvania levies an “impact fee.” Natural gas companies pay the fee for each well they drill. In the first year of a well’s life, the fee can range from about $40,000 to $60,000, depending on the price of gas. Since 2012, natural gas impact fees have raised nearly US$1.7 billion dollars, including $251.8 million in 2018/19 (Pennsylvania Public Utilities Commission, undated).
Sources: Pennsylvania Public Utilities Commission (undated); U.S. Energy Information Administration (2020j); U.S. Energy Information Administration (2020k).
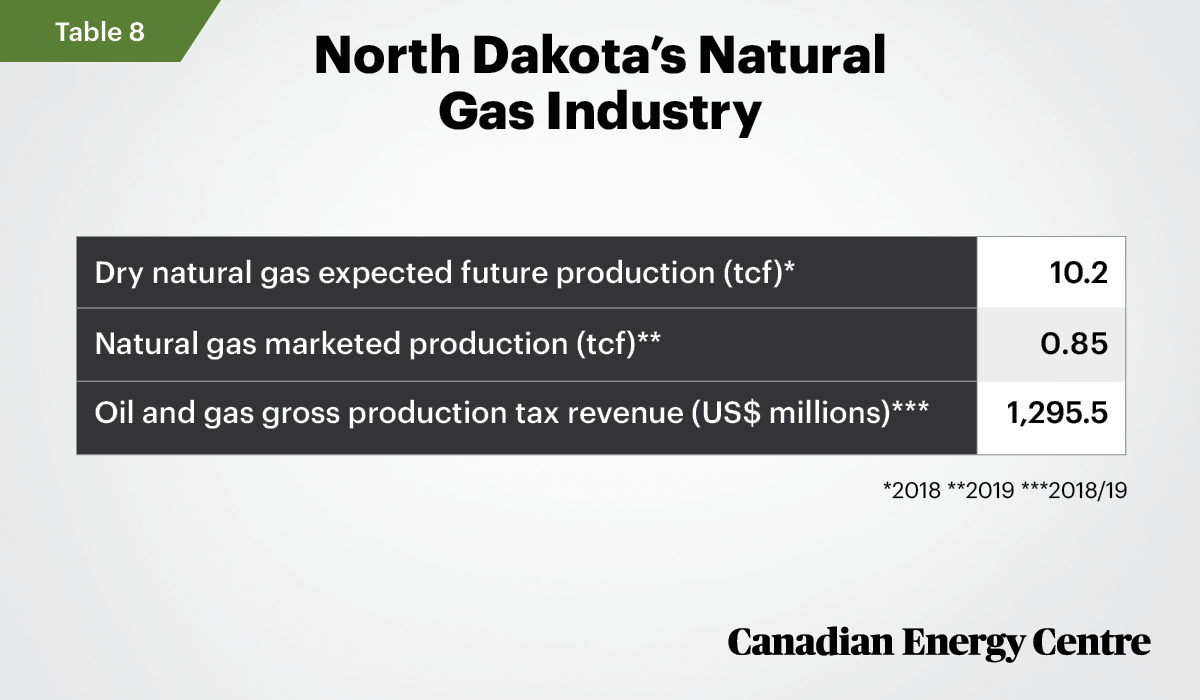
Synopsis of the North Dakota natural gas market: Up nine-fold since 2010
North Dakota has about 10.2 tcf or two per cent of the nation’s expected future production of dry natural gas in 2018 (see Table 8) (U.S. Energy Information Administration, 2020d).
Natural gas marketed production remained below 0.1 tcf per year until 2011, when output began to increase rapidly from the associated gas produced with the development of the state’s shale oil resources in the Bakken formation. Natural gas marketed production in North Dakota was 0.85 trillion cubic feet in 2019, an increase of over nine-fold since 2010 (U.S. Energy Information Administration, 2020d).
North Dakota levies a severance tax on the extraction, production, and sale of natural gas and oil. The oil and gas gross production tax is imposed on oil and gas properties rather than a property tax. The gross production tax on gas is an annually adjusted flat rate per thousand cubic feet (mcf). The current rate is $.0712 per mcf (U.S. Energy Information Administration, 2020d). In 2018/19, North Dakota raised nearly US$1.3 billion from the gross production tax on oil and gas (North Dakota, 2018).
Sources: North Dakota, (2018); U.S. Energy Information Administration (2020e); U.S. Energy Information Administration (2020f).
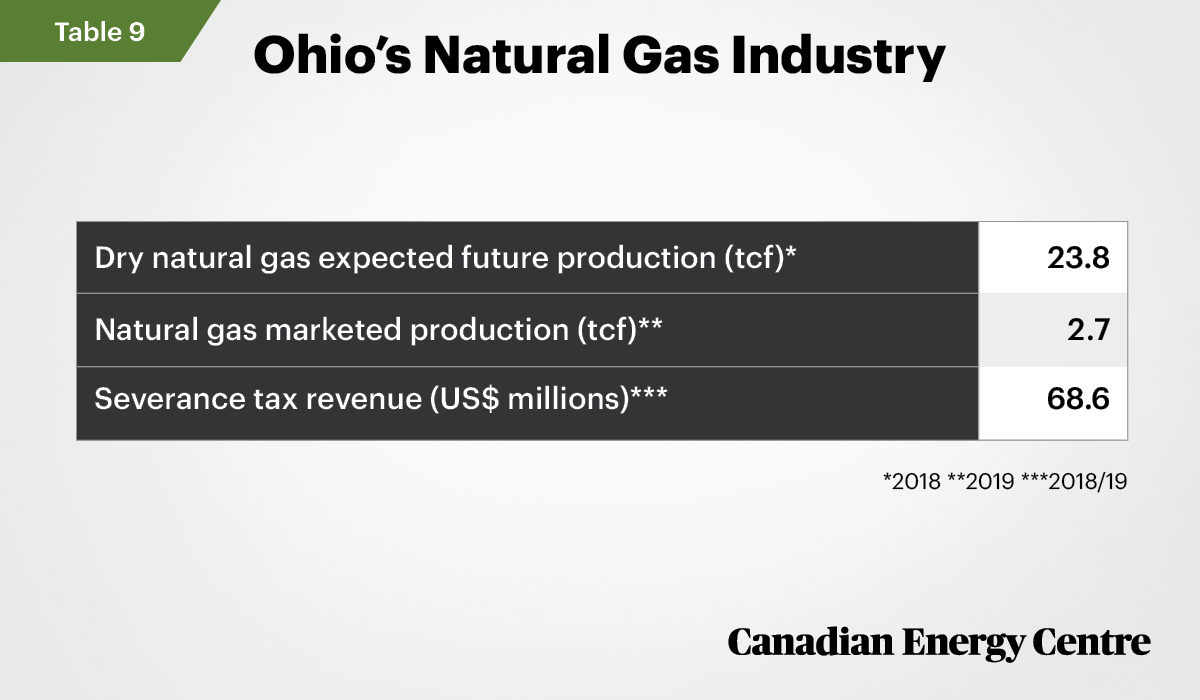
Synopsis of the Ohio natural gas industry: Up 34-fold since 2010
In 2018, Ohio had 23.8 tcf or about 4.6 per cent of the nation’s expected future production of dry natural gas (see Table 9) (U.S. Energy Information Administration, 2020i).
In 2019, natural gas marketed production in Ohio was 2.7 tcf, a 34-fold increase from 2010. Natural gas marketed production in Ohio is now about 6.4 per cent of national production (U.S. Energy Information Administration, 2020i).
Almost all of the state’s marketed natural gas production comes from Utica Shale wells, where horizontal drilling and hydraulic fracturing break open rock to release trapped natural gas. Ohio’s marketed natural gas production surpassed state demand for the first time in 2015 (U.S. Energy Information Administration, 2020i).
Ohio receives natural gas deliveries from other states, mostly West Virginia and Pennsylvania, but, because of Ohio’s increased marketed natural gas production, much more natural gas leaves the state than enters it (U.S. Energy Information Administration, 2020i).
In 2019, Ohio’s severance tax on clay, sandstone, shale, conglomerate, gypsum and Quartzite, Dolomite, gravel, sand and limestone, natural gas (2.5 cents per mcf), oil, and salt yielded $68.6 million for Ohio (Ohio Department of Taxation, undated).
Sources: Ohio Department of Taxation (undated); U.S. Energy Information Administration (2020g); U.S. Energy Information Administration (2020h).
Synopsis of the West Virginia natural gas industry: Production up seven-fold since 2010
In 2018, West Virginia had 35 tcf or about 5 per cent of the nation’s expected future production of dry natural gas, making its production of this gas the fourth largest of any state (see Table 10). Between 2009 and 2018, expected future production of dry natural gas in West Virginia increased 40-fold. In fact, the state’s expected future production of shale natural gas exceeds 34 tcf (U.S. Energy Information Administration, 2020o).
In 2019, West Virginia’s natural gas marketed production reached nearly 2.2 tcf, a seven-fold increase over 2010. As the U.S. Energy Information Administration has noted, West Virginia overlies part of the nation’s largest natural gas-producing area where production from the Marcellus and Utica-Point Pleasant shale formations has contributed to the state becoming the seventh-largest producer of marketed natural gas in the country (U.S. Energy Information Administration, 2020). According to the U.S. EIA, new pipeline access has helped make West Virginia a much more significant “player” in US natural gas production:
Natural gas moves into West Virginia from surrounding states, primarily from Pennsylvania, and exits to Ohio, Virginia, Pennsylvania, and Kentucky. On balance, much more natural gas leaves the state than enters because the amount of natural gas produced in West Virginia is much greater than the amount used in the state. New pipeline projects are planned or have come online in recent years to expedite the development and transportation of natural gas from the Marcellus and Utica Shale producing areas of West Virginia to markets across the eastern United States and Canada (U.S. Energy Information Administration, 2020o).
West Virginia’s oil and gas severance tax is levied at 5.0 per cent at the well-head on gross receipts attributable to the production of oil and natural gas (West Virginia State Tax Department (undated). The West Virginia oil and natural gas industry paid $184.5 million in severance taxes in fiscal year 2018/19, including $145.7 million in severance taxes on natural gas (West Virginia State Tax Department, undated).

Sources: U.S. Energy Information Administration (2020m); U.S. Energy Information Administration (2020n); and U.S. Energy Information Administration (2020o); West Virginia State Tax Department (undated).
Conclusion: Canada’s natural gas production relatively stagnant, while higher volumes of natural gas imported from the northeast US
Despite the recent worldwide economic slowdown as a result of COVID-19, natural gas demand is expected to rebound and grow over the next five years.
According to the International Energy Agency, between 2019 and 2025, natural gas demand is expected to grow by over 350 billion cubic metres (about 12.4 tcf), or an average of 1.5 per cent per year. Most of the gas demand lost in 2020 is expected to be recovered in 2021, supplemented by growth between 2021 and 2025 from the Asia-Pacific region as China and Asian emerging markets recover economically and benefit from attractive gas prices (International Energy Agency, 2020).
Natural gas production is a major strategic advantage for North America, and a number of northeastern US states have taken advantage of emerging opportunities by capturing increased market share.
Over the past decade, states such as Pennsylvania, North Dakota, West Virginia, and Ohio have all significantly ramped up the production of natural gas reserves allowing those states to export into other US and Eastern Canadian markets through a network of pipelines. Those increased exports have enabled these states to collect significantly greater revenues from impact fees and severance taxes to help fund priority programs in health, education, and infrastructure.
Despite natural gas reserves that range from modest to significant, Ontario, Quebec, New Brunswick, and Nova Scotia have chosen not to develop their reserves. They have instead chosen to import increasing volumes of northeastern US shale gas, displacing some Western Canada Sedimentary Basin (WCSB) interprovincial natural gas (Canadian Association of Petroleum Producers, undated).
The experience of Pennsylvania, North Dakota, Ohio, and West Virginia suggests that if Ontario, Quebec, Nova Scotia, and New Brunswick were more aggressive in choosing to develop their on-shore natural gas reserves they could create new revenues sources while expanding export trade to the US through new and existing pipeline infrastructure.
Canada has the potential to become a significant natural gas exporter and expand its global reach in serving emerging markets in the Asia-Pacific, as well as helping to reduce global greenhouse gas emissions. Ontario, Quebec, Nova Scotia, and New Brunswick could responsibly develop natural gas resources and join Alberta, British Columbia, Saskatchewan, and Newfoundland & Labrador in creating a more robust natural gas production hub in Canada.
References
(as of October 19, 2020)
Alberta (undated). Let’s Talk about Newfoundland & Labrador. <https://bit.ly/30LvWOY>.
Bank of Canada (undated). Annual exchange rates. <https://bit.ly/2GLWkB2>.
Barnes, Paul (2018). “NatGas could contribute more to Nova Scotia’s economy.” The Chronicle Herald. <https://bit.ly/34pgTeN>.
Canadian Association of Petroleum Producers (undated). Markets. <https://bit.ly/36LC7pS>.
Canada Energy Regulator (2018). Market Snapshot: Why Does Canada Import Natural Gas, While Being a Major Exporter? Location, Location, Location! <https://bit.ly/3lgovXG>.
Canada Energy Regulator (2020). Marketable Natural Gas Production in Canada. <https://bit.ly/34q0iHM>.
Canada Energy Regulator (2019a). Canada’s Energy Future, 2019. <https://bit.ly/3ixnF7o>.
Canadian Energy Regulator (2019b). Provincial and Territorial Energy Profiles – Newfoundland & Labrador. <https://bit.ly/36IU34w>.
Canada Energy Regulator (2019c). Provincial and Territorial Energy Profiles – New Brunswick. <https://bit.ly/3iBrwjA>.
Canada Energy Regulator (2019d). Provincial and Territorial Energy Profiles – Nova Scotia. <https://bit.ly/3iv1w9z>.
Canada Energy Regulator (2019e). Provincial and Territorial Energy Profiles – Ontario. <https://bit.ly/2F8vsLe>.
Canada Energy Regulator (2019f). Provincial and Territorial Energy Profiles – Quebec. <https://bit.ly/2HYjFjE>.
Canadian Energy Research Institute (2017). Economic Potential of Onshore Oil and Gas in New Brunswick and Nova Scotia. <https://bit.ly/30AEbx2>.
Energy Now (2020). Quebec’s Green Opportunity – Why Does Quebec Spend Billions Each Year Importing Natural Gas? – SecondStreet.org. <https://bit.ly/2SuBEA4>.
Hamilton, Tyler (2010). Alberta Firm Eyes Ontario’s Untapped Shale Gas. Toronto Star. <https://bit.ly/2GMXNXM>.
International Energy Agency (2020). Gas 2020. <https://bit.ly/36CvJBg>.
Natural Resources Canada (undated a). Natural Gas Facts. <https://bit.ly/3jz7jMK>.
Natural Resources Canada (undated b). Newfoundland & Labrador ’s Shale and Tight Resources. <https://bit.ly/3iF7On9>.
Newfoundland (2018). Advance 2030: A Plan for Growth in the Newfoundland and Labrador Oil and Gas Industry. <https://bit.ly/3iXaFrD>.
North Dakota (2018). 2018 State and Local Taxes: A Comparative Guide. <https://bit.ly/3ivXVbl>.
Ohio Department of Taxation (undated). Annual Reports, FY 2004 to FY 2019. <https://bit.ly/3nkJ8UA>.
Olivero, Tina (2020). We Got Gas: Natural Gas. Oil and Gas Magazine. <https://bit.ly/2SDLIa8>.
Pennsylvania Public Utility Commission (undated). Act 13 Impact Fee. <https://bit.ly/33uznv3>.
Petrel Robertson (2020). Calculation of CO2 Emissions Created by Pipeline Transport of Natural Gas<https://bit.ly/3cXMdVS>.
Statistics Canada (undated). Table 10-10-0017-01: Canadian government finance statistics for the provincial and territorial governments (x1,000,000). <https://bit.ly/3lwJhCI>.
Statistics Canada (2020). Table 25-10-0055-01: Supply and disposition of natural gas, monthly (data in thousands) (x1,000). <https://bit.ly/3nee1dn>.
Union Gas (undated). About Dawn. <https://bit.ly/30ASTV4>.
U.S. Energy Information Administration (2020a). Dry Natural Gas Proved Reserves. <https://bit.ly/2SCoPnl>.
U.S. Energy Information Administration (2020b). Natural Gas. <https://bit.ly/2T7w5YD>.
U.S. Energy Information Administration (2020c). Natural Gas Gross Withdrawals and Production. <https://bit.ly/36JdqKT>.
U.S. Energy Information Administration (2020d). North Dakota State Energy Profile. <https://bit.ly/2GDQhhQ>.
U.S. Energy Information Administration (2020e). North Dakota Dry Natural Gas Expected Future Production. <https://bit.ly/30N0a46>.
U.S. Energy Information Administration (2020f). North Dakota Natural Gas Marketed Production. <https://bit.ly/36IUQlU>.
U.S. Energy Information Administration (2020g). Ohio Dry Natural Gas Expected Future Production. <https://bit.ly/3iOrvJu>.
U.S. Energy Information Administration (2020h). Ohio Natural Gas Marketed Production. <https://bit.ly/3iBUzne>.
U.S. Energy Information Administration (2020i). Ohio State Energy Profile. <https://bit.ly/3jzEuQ6>.
U.S. Energy Information Administration (2020j). Pennsylvania Dry Natural Gas Expected Future Production. <https://bit.ly/34zy4uh>.
U.S. Energy Information Administration (2020k). Pennsylvania Natural Gas Marketed Production. <https://bit.ly/34xsJDE>.
U.S. Energy Information Administration (2020l). Pennsylvania State Energy Profile. <https://www.eia.gov/state/print.php?sid=PA>.
U.S. Energy Information Administration (2020m). West Virginia Dry Natural Gas Expected Future Production. <https://bit.ly/3d8RGJo>.
U.S. Energy Information Administration (2020n). West Virginia Natural Gas Marketed Production. <https://bit.ly/2GO9xJL>.
U.S. Energy Information Administration (2020o). West Virginia State Energy Profile. <https://www.eia.gov/state/print.php?sid=WV>.
West Virginia State Tax Department (undated). Severance Tax History and Data. <https://bit.ly/33vv8zm>.
CEC Research Briefs
Canadian Energy Centre (CEC) Research Briefs are contextual explanations of data as they relate to Canadian energy. They are statistical analyses released periodically to provide context on energy issues for investors, policymakers and the public. The source of profiled data depends on the specific issue.
About the authors
This CEC Research Brief was compiled by Lennie Kaplan, Chief Research Analyst at the Canadian Energy Centre and Mark Milke, Executive Director of Research for the Canadian Energy Centre.
Acknowledgements
The authors and the Canadian Energy Centre would like to thank and acknowledge the assistance of Dennis Sundgaard for his review of this paper.
Creative Commons Copyright
Research and data from the Canadian Energy Centre (CEC) is available for public usage under creative commons copyright terms with attribution to the Canadian Energy Centre. Attribution and specific restrictions on usage including non-commercial use only and no changes to material should follow guidelines enunciated by Creative Commons here: Attribution-NonCommercial-NoDerivs CC BY-NC-ND.