To sign up to receive the latest Canadian Energy Centre research to your inbox email: [email protected]
Download the PDF here
Download the charts here
The global reach of immigration is apparent in all the world’s developed countries, including Canada. Canada has one of the world’s highest immigration rates, averaging about one per cent of its total population each year.
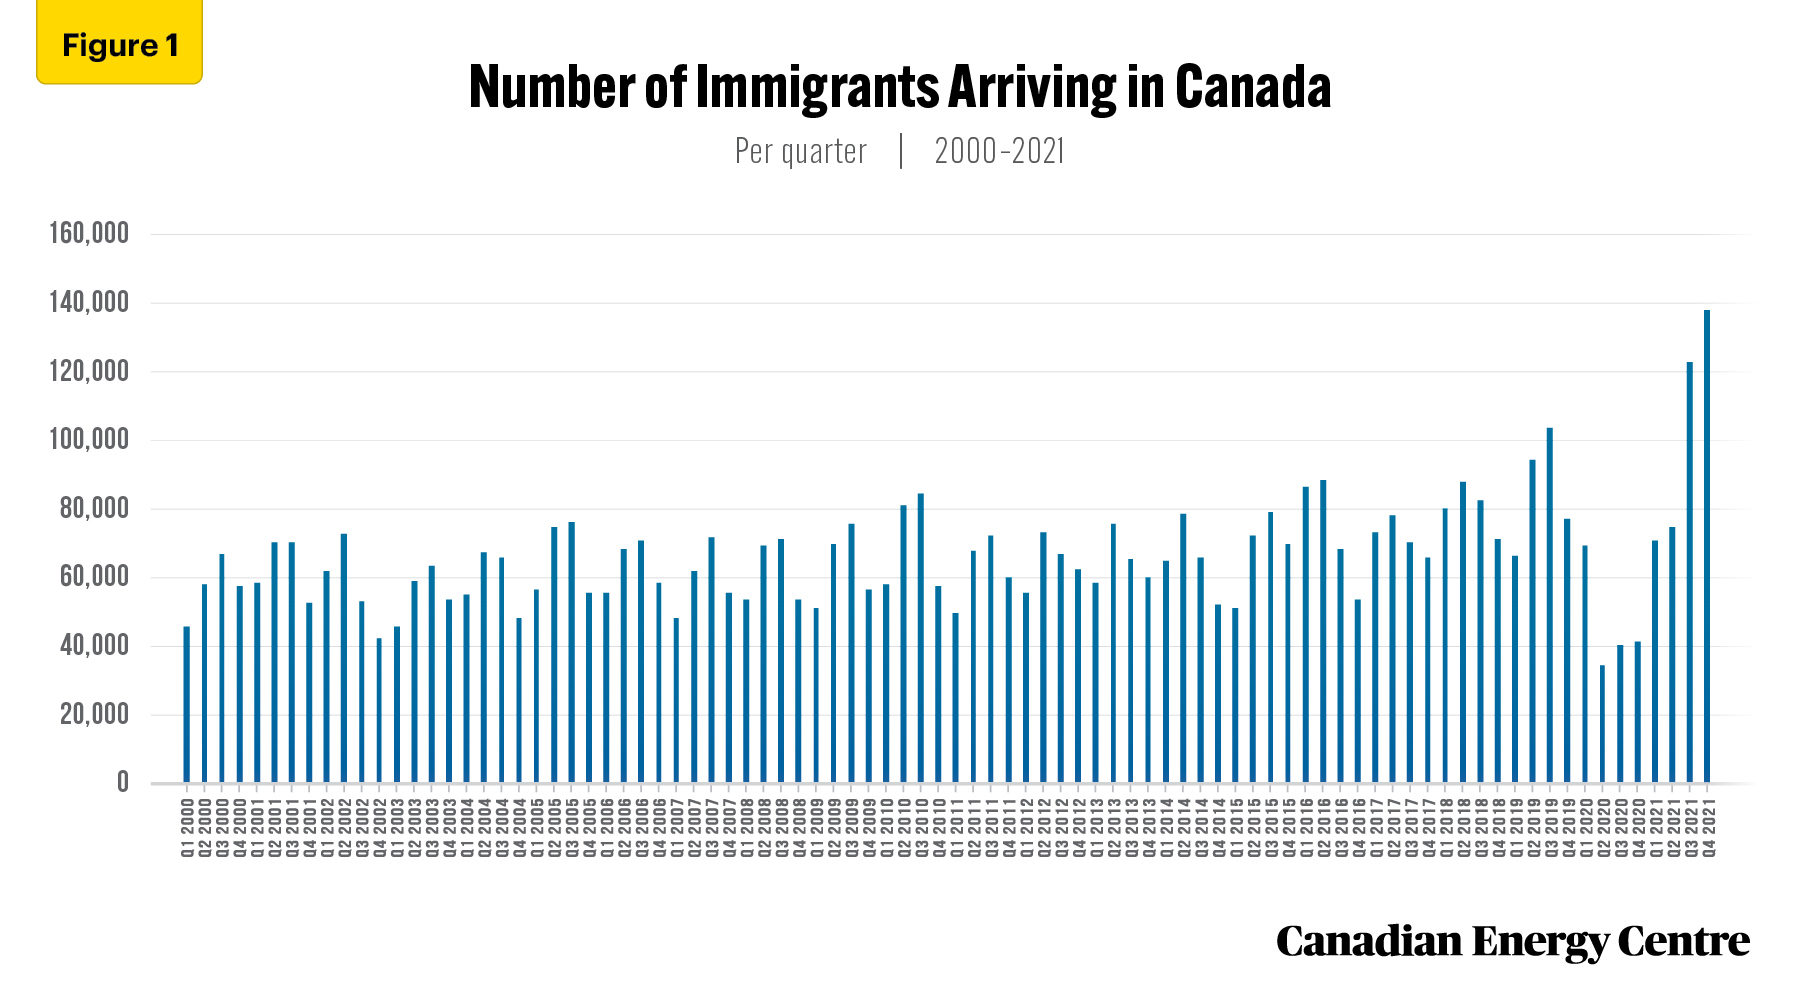
Figure 1: Immigrants arriving in Canada between 2000 and 2021
Between 2000 and 2021, 5.9 million people immigrated to Canada (see Figure 1). In 2021 alone, about 400,000 immigrants came to Canada.
In the past decade, the number and characteristics of people immigrating to Canada has changed significantly. Immigrants¹ to Canada are more numerous and more diverse than ever before. Immigrants have traditionally settled in urban centers, especially in large cities in Ontario and Quebec.
1. For the purposes of tracking economic progress, Statistics Canada defines a landed immigrant as someone to whom the immigration authorities have granted the right to live in Canada permanently. Canadian citizens by birth and non-permanent residents (people from another country who live in Canada and have a work or study permit or are claiming refugee status and family members living here with them) are not landed immigrants.
Source: Statistics Canada, Table 17-10-0040-01.
Alberta’s provincial economy and the Canadian national economy both benefit from oil and gas development, and immigrants employed in the sector have also benefitted. In this Fact Sheet, we examine employment trends and incomes for landed immigrants working in Canada’s oil and gas extraction sector between 2006, the earliest year of available comparable data, and 2021.² In summary:
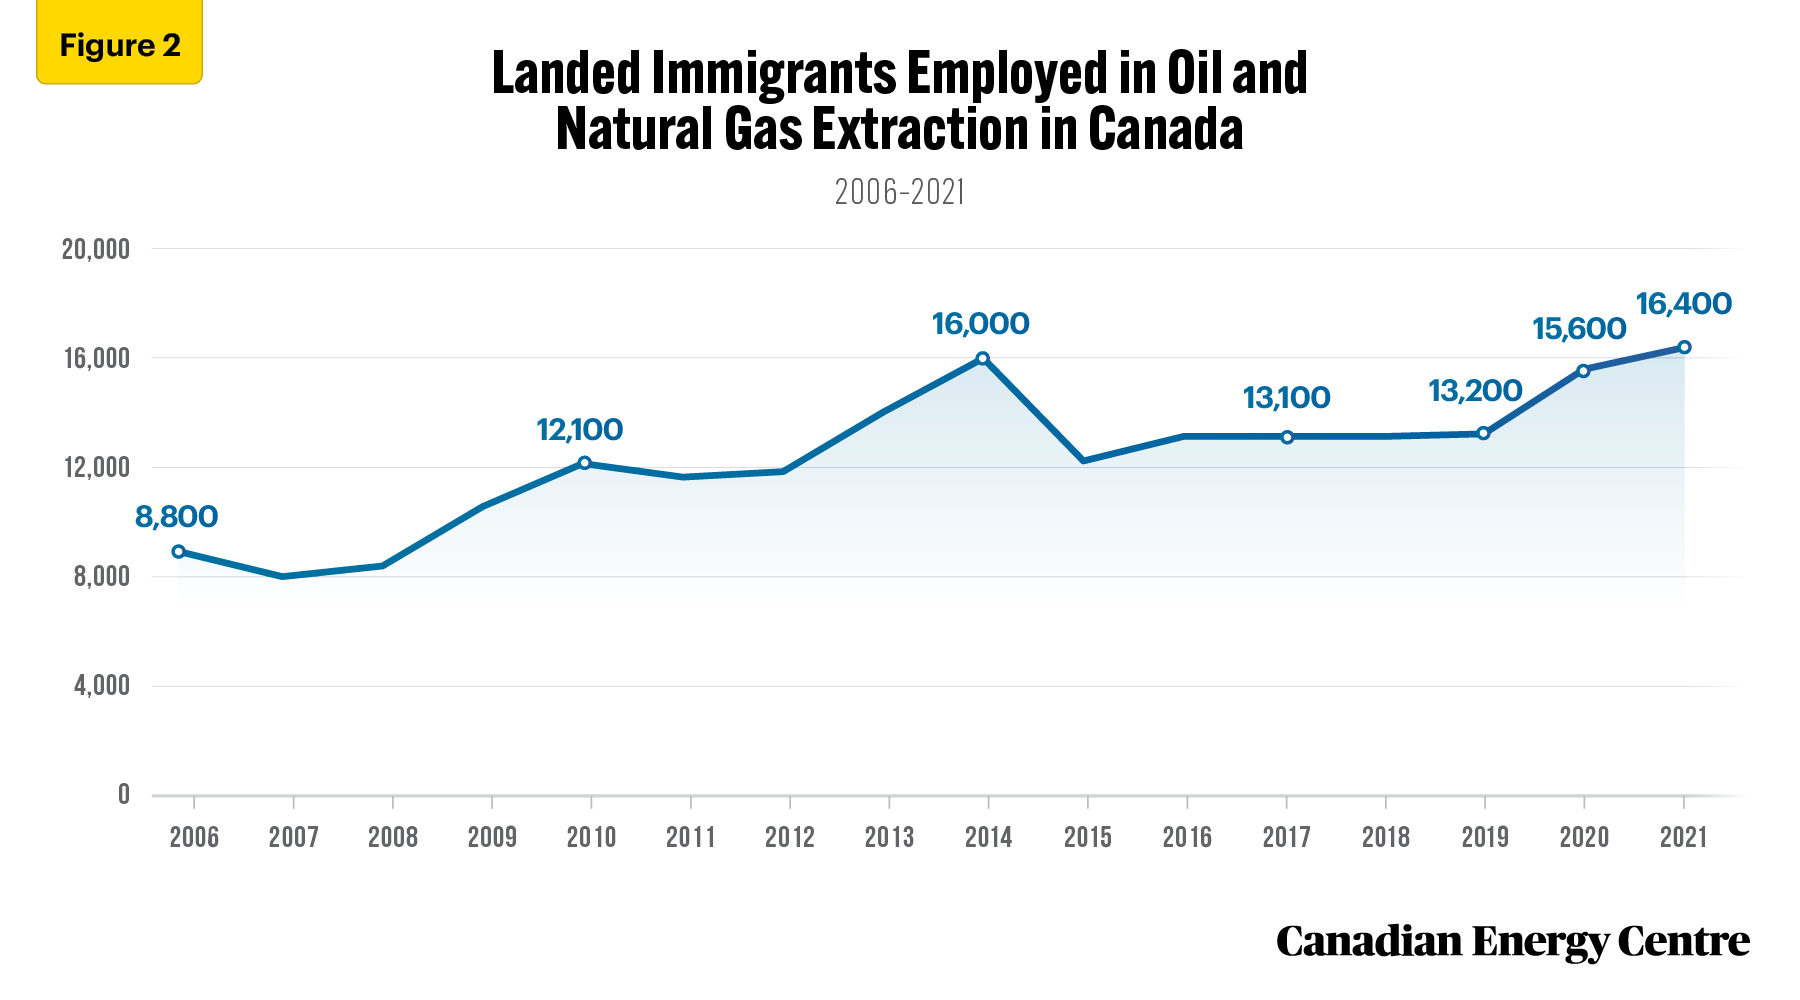
- The number of landed immigrants employed in Canada’s oil and gas sector increased by over 86 per cent between 2006 and 2021: from 8,800 to 16,400.
- Immigrants to Canada employed in the oil and gas sector earned:
◦ 22 per cent more than those in the utilities sector;
◦ 44 per cent more than those in construction;
◦ 47 per cent more than those in manufacturing; and
◦ 53 per cent more than those employed in agriculture.
Figure 2: Immigrant employment and income trends in the resource sector between 2006 and 2021
The data show that the participation of landed immigrants in Canada‘s oil and gas extraction sector has generally increased since 2006. In 2021, 16,400 landed immigrants were employed in the Canadian oil and natural gas extraction sector. Between 2019 and 2021, there was an increase of 3,200 landed immigrants employed in the sector. By 2021, 86 per cent more landed immigrants worked in the oil and gas sector than the 8,800 immigrants employed in the sector in 2006.
2. For the purposes of tracking economic progress, Statistics Canada defines a landed immigrant as someone to whom the immigration authorities have granted the right to live in Canada permanently. Canadian citizens by birth and non-permanent residents (people from another country who live in Canada and have a work or study permit or are claiming refugee status and family members living here with them) are not landed immigrants.
Source: Derived from Statistics Canada, Labour Force Survey, custom tabulation.
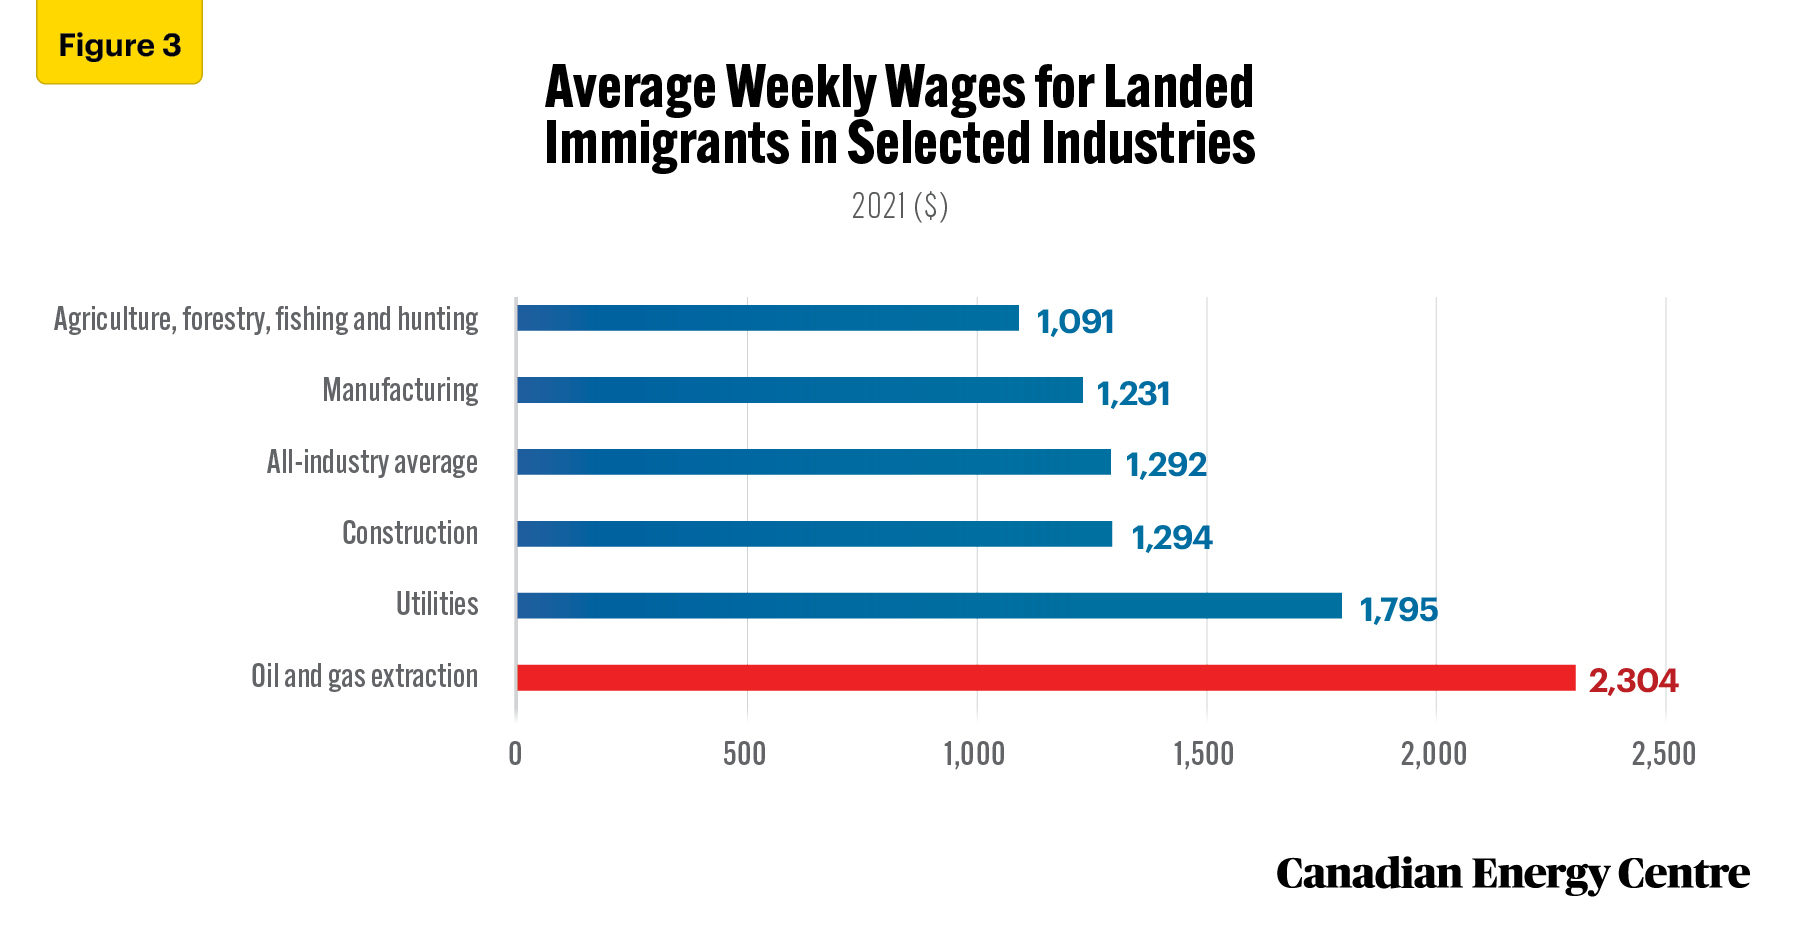
Figure 3: Average weekly wages for landed immigrants by industry
Landed immigrants employed in Canada’s oil and gas extraction sector are paid more than those working in other goods-producing industries—and more than the average for all industries for landed immigrants. In 2021, the average weekly wage for landed immigrants ranged from $1,091 for those employed in agriculture, forestry, fishing, and hunting to $2,304 for those in the oil and gas extraction sector. By comparison, the all-industry average weekly wage for landed immigrants was $1,292.
Source: Derived from Statistics Canada, Labour Force Survey, custom tabulation.
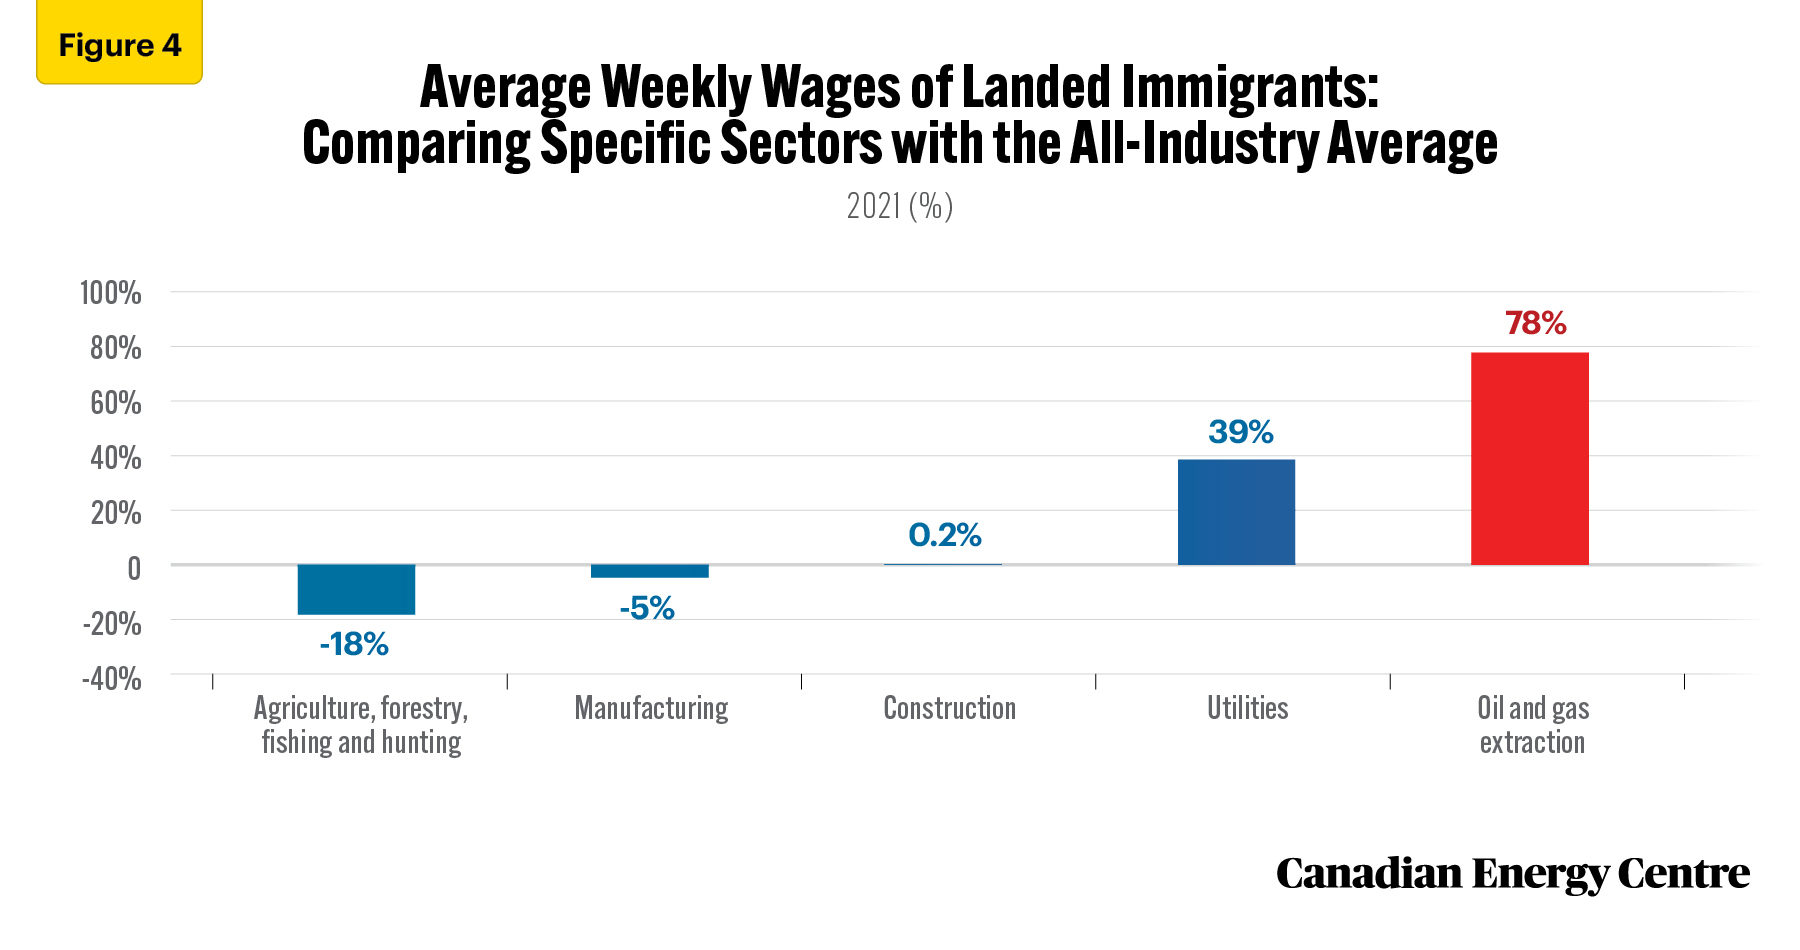
Figure 4: Wages for immigrants working in the broad oil and gas extraction sector are 78% higher than the all-industry average
Expressed as percentages, in 2021, the average weekly wage for landed immigrants in the oil and gas sector was higher than for those in selected other sectors and the all-industry average. Immigrants in agriculture, forestry, fishing, and hunting earned 18 per cent less than the all-industry average; those in manufacturing earned five per cent less than the all-industry average; those in construction earned virtually the same as that average; and immigrants in working in the utilities sector earned 39 per cent more. Meanwhile, those working in oil and gas earned 78 per cent more than the all-industry average.
Source: Derived from Statistics Canada, Labour Force Survey, custom tabulation
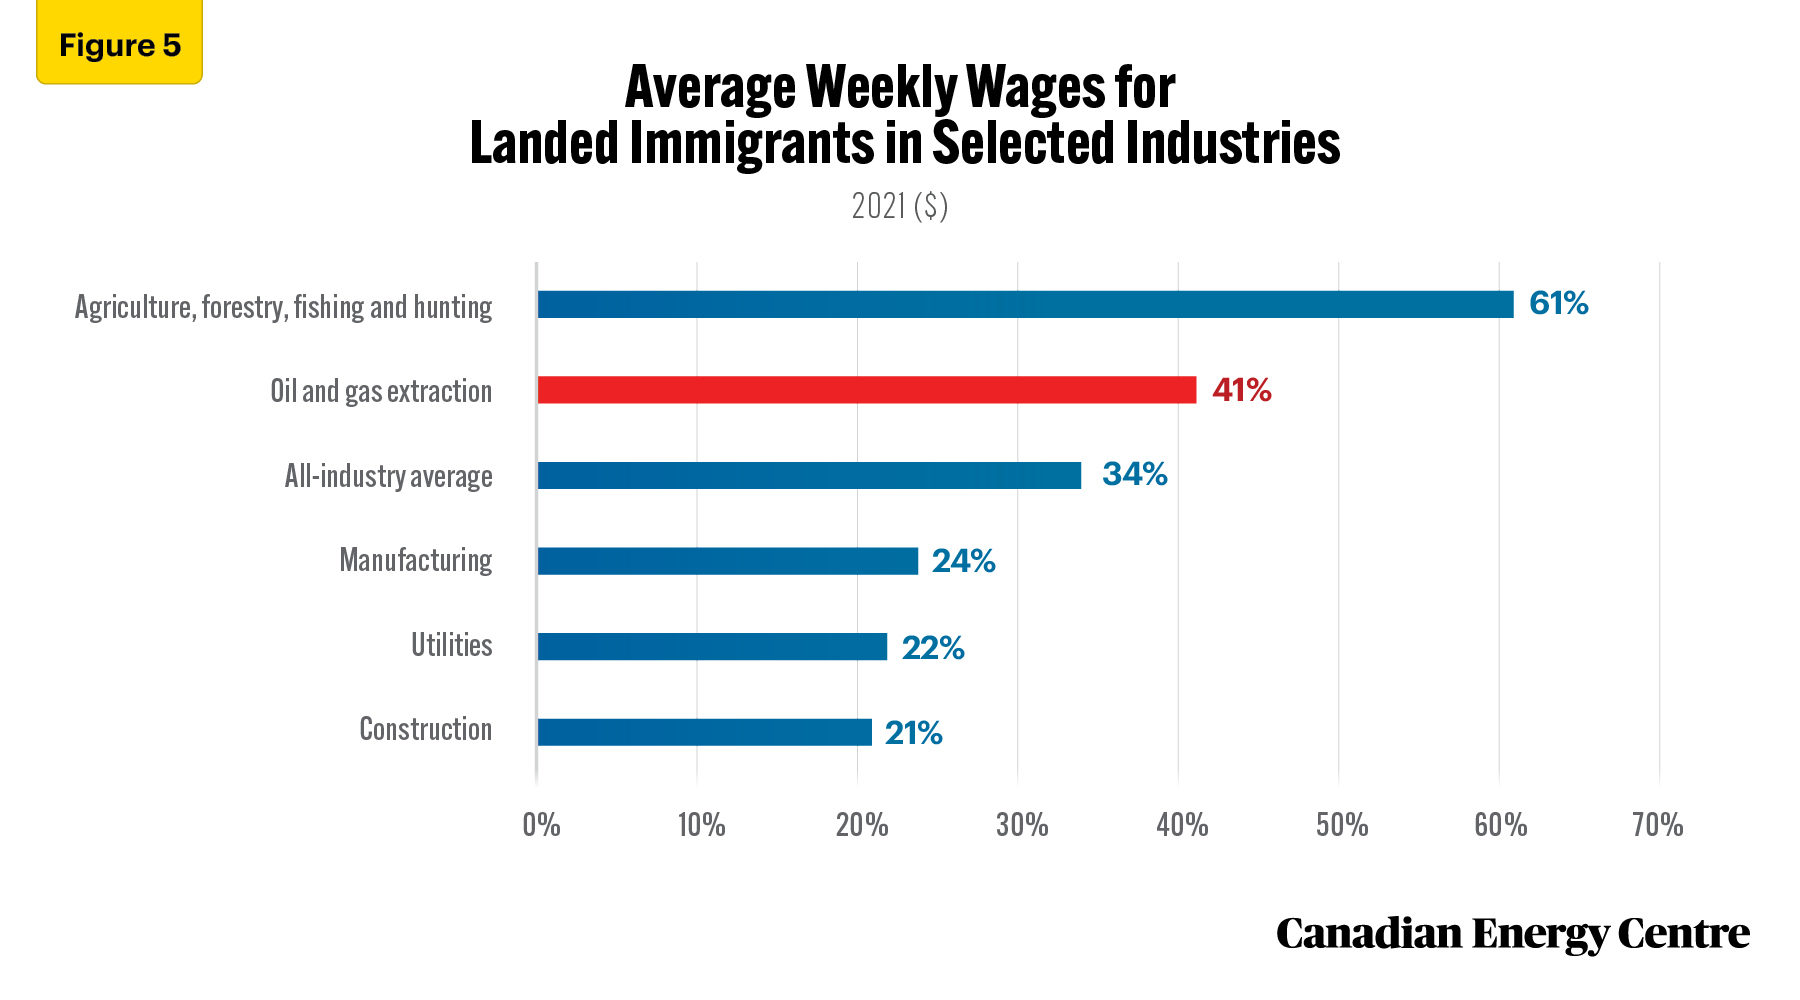
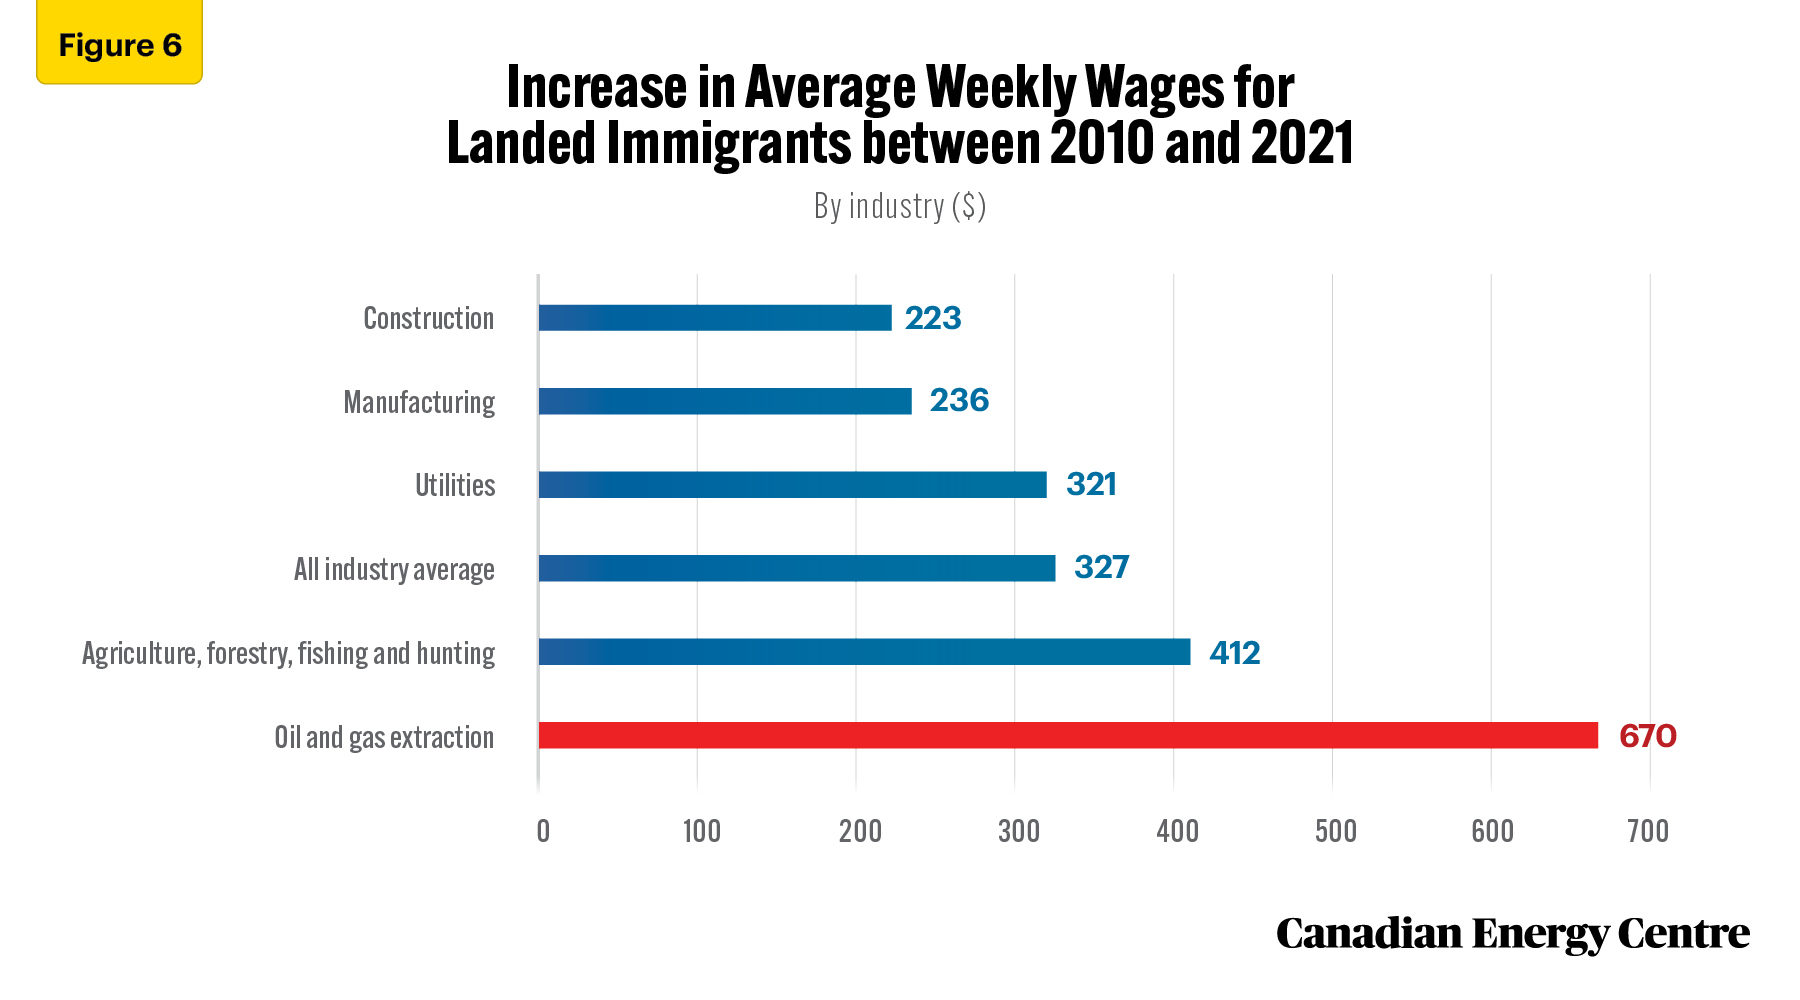
Figures 5 and 6: Highest wage increases for landed immigrants came in the oil and gas sector
Between 2010 and 2021, average weekly wages for landed immigrants employed in the oil and gas extraction sector grew from $1,634 to $2,304, an increase of nearly 41 per cent, or $670. This compares with a range of 21 per cent higher for those in the construction sector to 61 per cent more for those in agriculture, forestry, fishing, and hunting. The all-industry average growth in wages was 34 per cent higher between 2010 and 2021, or a rise of $327.
Source: Derived from Statistics Canada, Labour Force Survey, custom tabulation.
Source: Derived from Statistics Canada, Labour Force Survey, custom tabulation.
Key findings: Canada’s oil and gas sector provides resources and opportunities for landed immigrants
Statistics Canada Labour Force Survey data show that landed immigrants in Canada benefit from participation in the oil and gas extraction sector. The number of landed immigrants employed in the sector has generally grown over the past 15 years. Average weekly earnings for landed immigrants working in the sector are higher than for other goods-producing industries and the average of all other sectors.
Notes
This CEC Fact Sheet was compiled by Ven Venkatachalam and Lennie Kaplan at the Canadian Energy Centre (www.canadianenergycentre.ca). All percentages in this report are calculated from the original data, which can run to multiple decimal points. They are not calculated using the rounded figures that may appear in charts and in the text, which are more reader friendly. Thus, calculations made from the rounded figures (and not the more precise source data) will differ from the more statistically precise percentages we arrive at using source data. The authors and the Canadian Energy Centre would like to thank and acknowledge the assistance of two anonymous reviewers in reviewing the data and research for the initial edition of this Fact Sheet. Image credits: TC Energy
References (all links live as of July 6, 2022)
Government of Canada (2022), New immigration plan to fill labour market shortages and grow Canada’s economy <https://bit.ly/3OQdg7x>; Statistics Canada (2022a), Table 17-10-0040-01, Estimates of the components of international migration, quarterly <https://bit.ly/3nJAvEu>; Statistics Canada (2022b), Statistics Canada, Custom tabulation, Labour Force Survey, 0421_11 Table 1 <https://bit.ly/3c1sd8x>.
Creative Commons Copyright
Research and data from the Canadian Energy Centre (CEC) is available for public usage under creative commons copyright terms with attribution to the CEC. Attribution and specific restrictions on usage including non-commercial use only and no changes to material should follow guidelines enunciated by Creative Commons here: Attribution-NonCommercial-NoDerivs CC BY-NC-ND.