To sign up to receive the latest Canadian Energy Centre research to your inbox email: [email protected]
Download the PDF here
Download the charts here
Introduction
In recent years, all forms of energy have played some role in the global economy, and nuclear energy is no different. Nuclear energy is unique in that it plays an important role in some countries, while in other countries it is less prevalent. Nuclear energy is essential in such as areas as electricity generation, medicine, industry, space exploration, and national security.
Decisionmakers are debating the role of various forms of energy production, generation and use in the energy mix. In this CEC Fact Sheet, we look at the role of nuclear energy in countries where it is in use as a source of primary energy.
Nuclear energy in the global primary energy supply
As of 2021, there were 437 operational nuclear power reactors in 32 countries, with the United States (U.S.) leading the way with 93 reactors. In Europe, France leads with 56 nuclear reactors.
In the Asia Pacific region, China has 53 nuclear reactors, Japan has 33, and South Korea has 24.
Across the world, 56 new reactors are under construction in 19 countries, with China leading the way with 16 facilities being built.
Canada had 19 reactors in operation as of December 2021 (see Table 1).
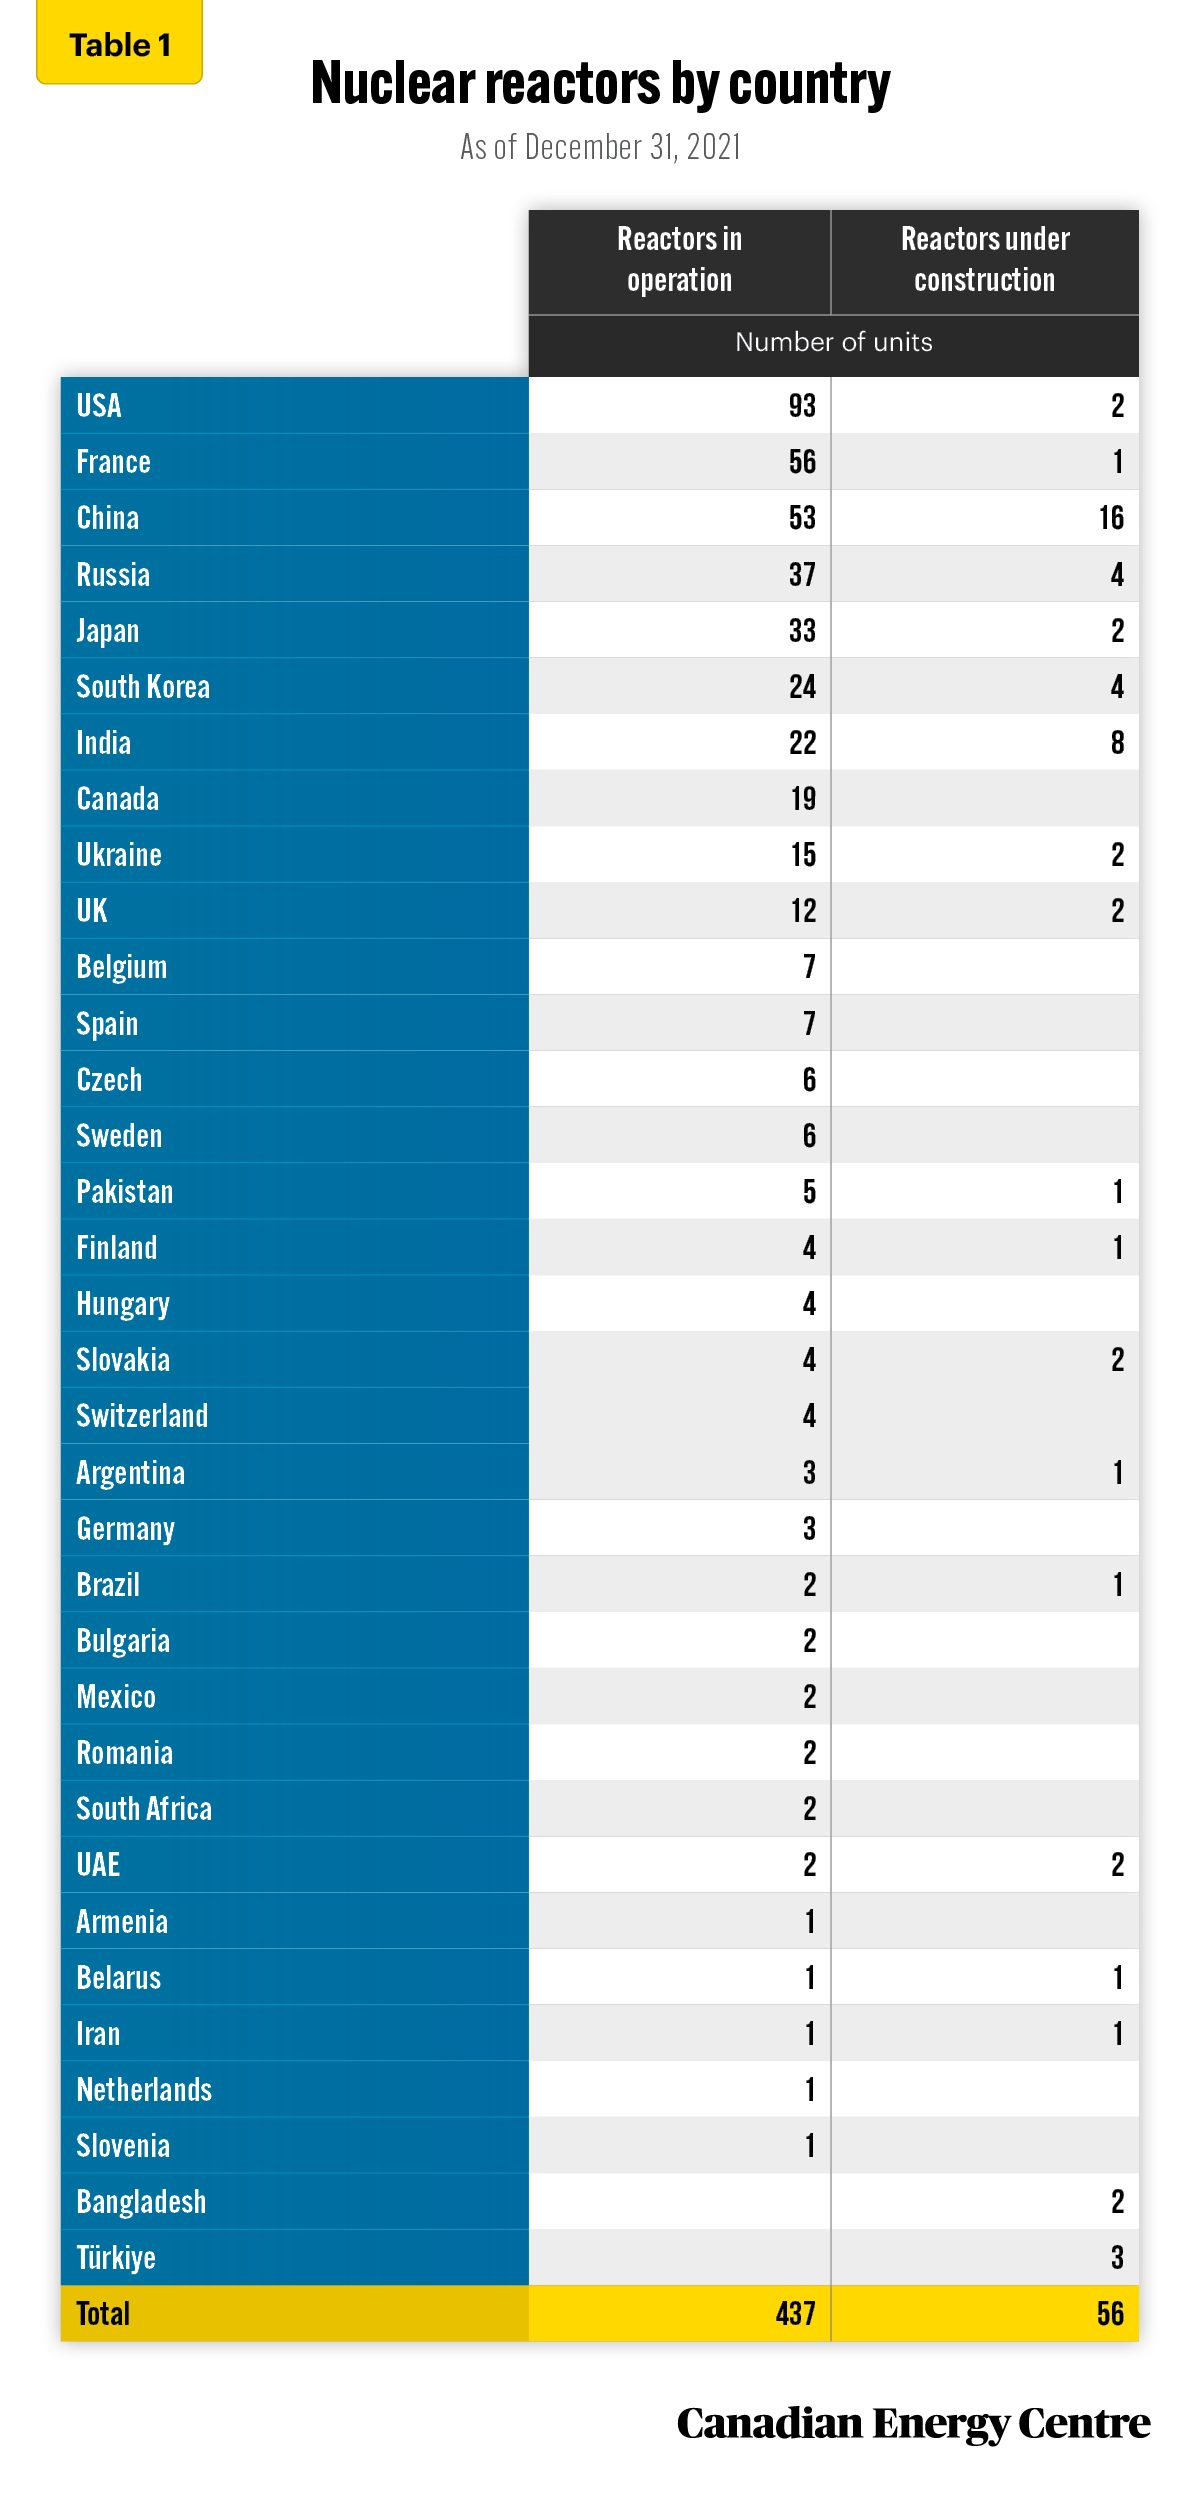
Source: IAEA, 2022
According to the International Energy Agency (IEA), nuclear energy accounted for around four per cent of the world’s primary energy¹ supply in 2021. However, the share of nuclear energy in primary energy varies widely by region.
In the 1990s, six per cent of the world’s primary energy came from nuclear energy. By 2021, just over four per cent of the world’s primary energy came from nuclear.
In Europe, the nuclear energy share was just over nine per cent in 2021. For North America, it was seven per cent. In Asia, the share has decreased from around four per cent in 1990 to around two per cent in 2021 (see Figure 1).
As noted above, the share of nuclear energy in primary energy varies widely by region due to factors such as energy policies, resource availability, and economic considerations. For example, some countries have abundant oil and gas reserves and may rely more heavily on these sources for their primary energy supply. In contrast, others may have more limited access to traditional energy sources and look to nuclear energy to diversify their energy mix
1. The source for primary energy takes many forms, including fossil fuels, renewables, and nuclear energy. Primary energy sources are converted to electricity, a secondary energy source.
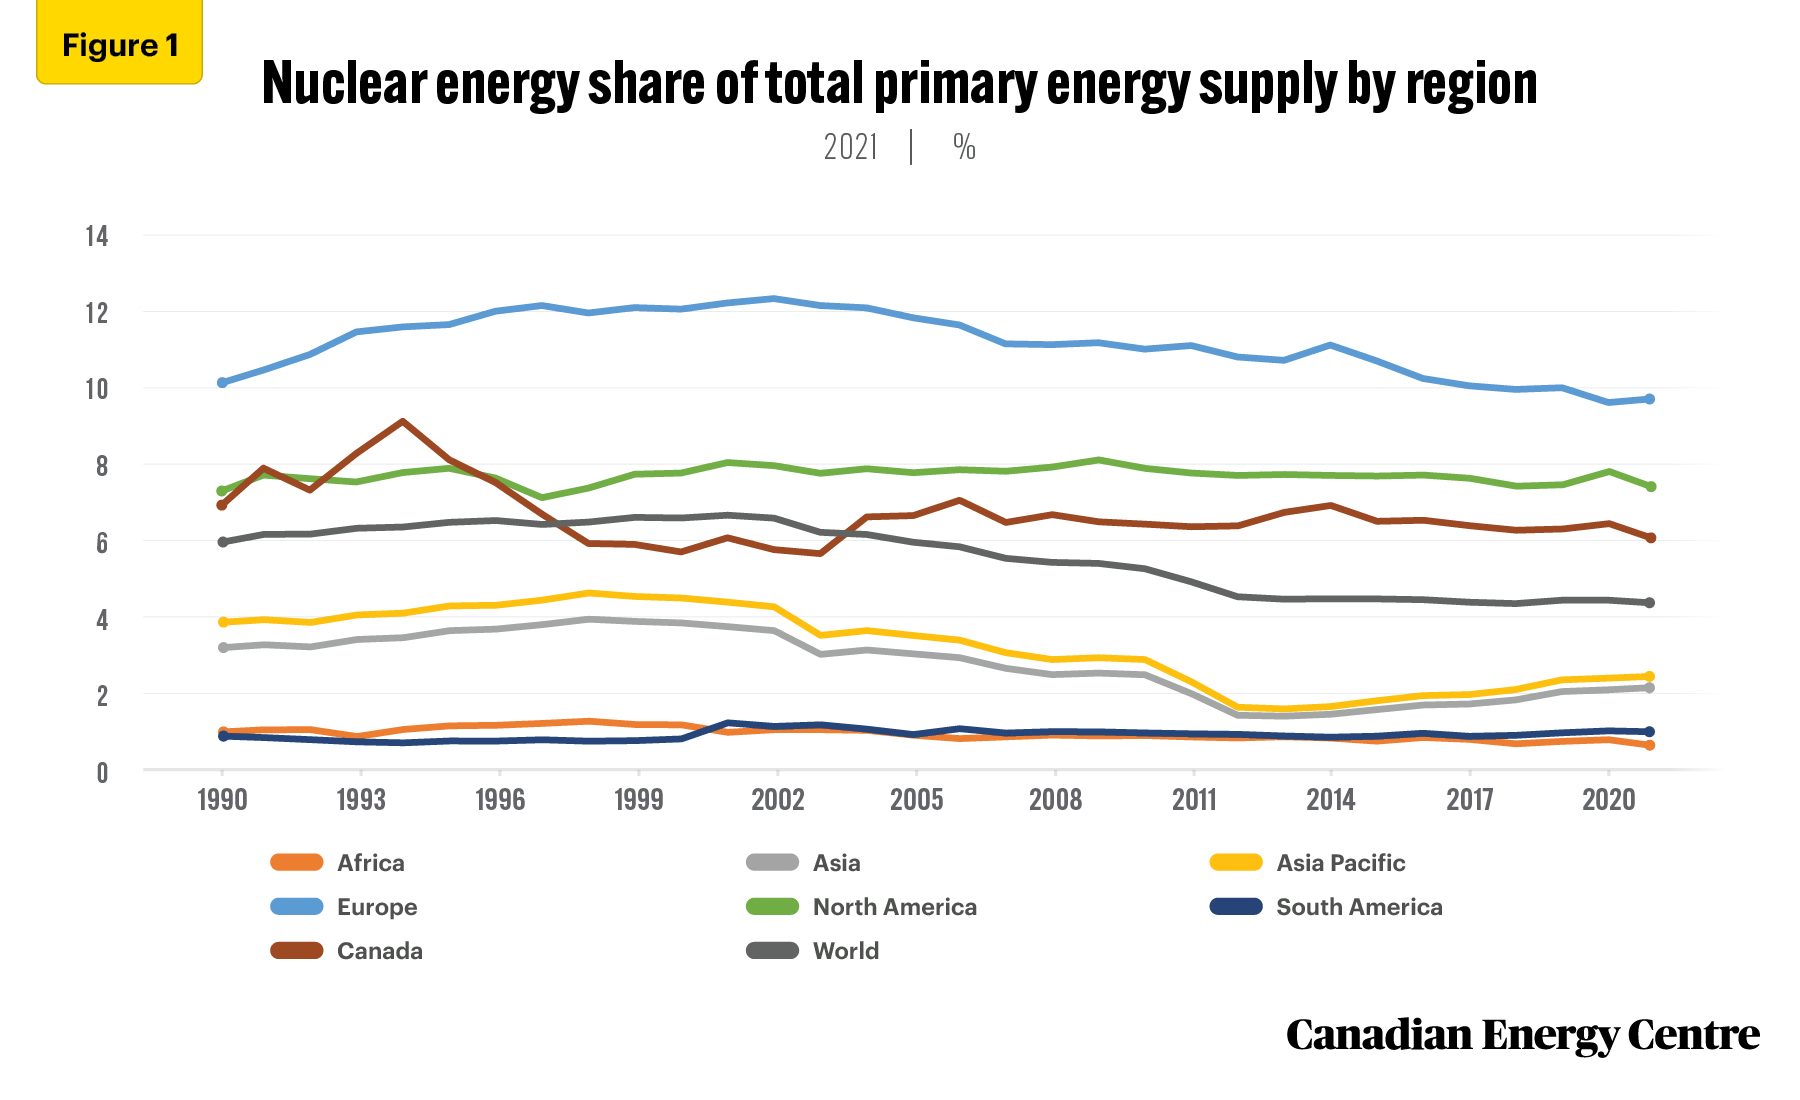
Source: IEA Database, 2023 and BP Database, 2022
Nuclear energy and electricity generation
Nuclear energy plays an essential role in electricity generation, providing about 10 per cent of global electricity generation. From the first civilian nuclear electricity generation facility back in 1954, nuclear energy has come a long way.
According to the International Atomic Energy Agency (IAEA), world nuclear electricity production increased steadily between 2000 and 2021. In 2000, global nuclear electricity production was 2,443 Terawatt hours (TWh); by 2021, it had increased to 2,653 TWh.
According to the IAEA, as of December 2021, the top five countries producing electricity from nuclear energy were the U.S. (772 TWh), China (383 TWh), France (363 TWh), Russia (208 TWh), and South Korea (150 TWh). Other countries that produce significant electricity from nuclear power include the Ukraine, Germany, Japan, and Spain. Canada produced 87 TWh in 2021 (see Figure 2).
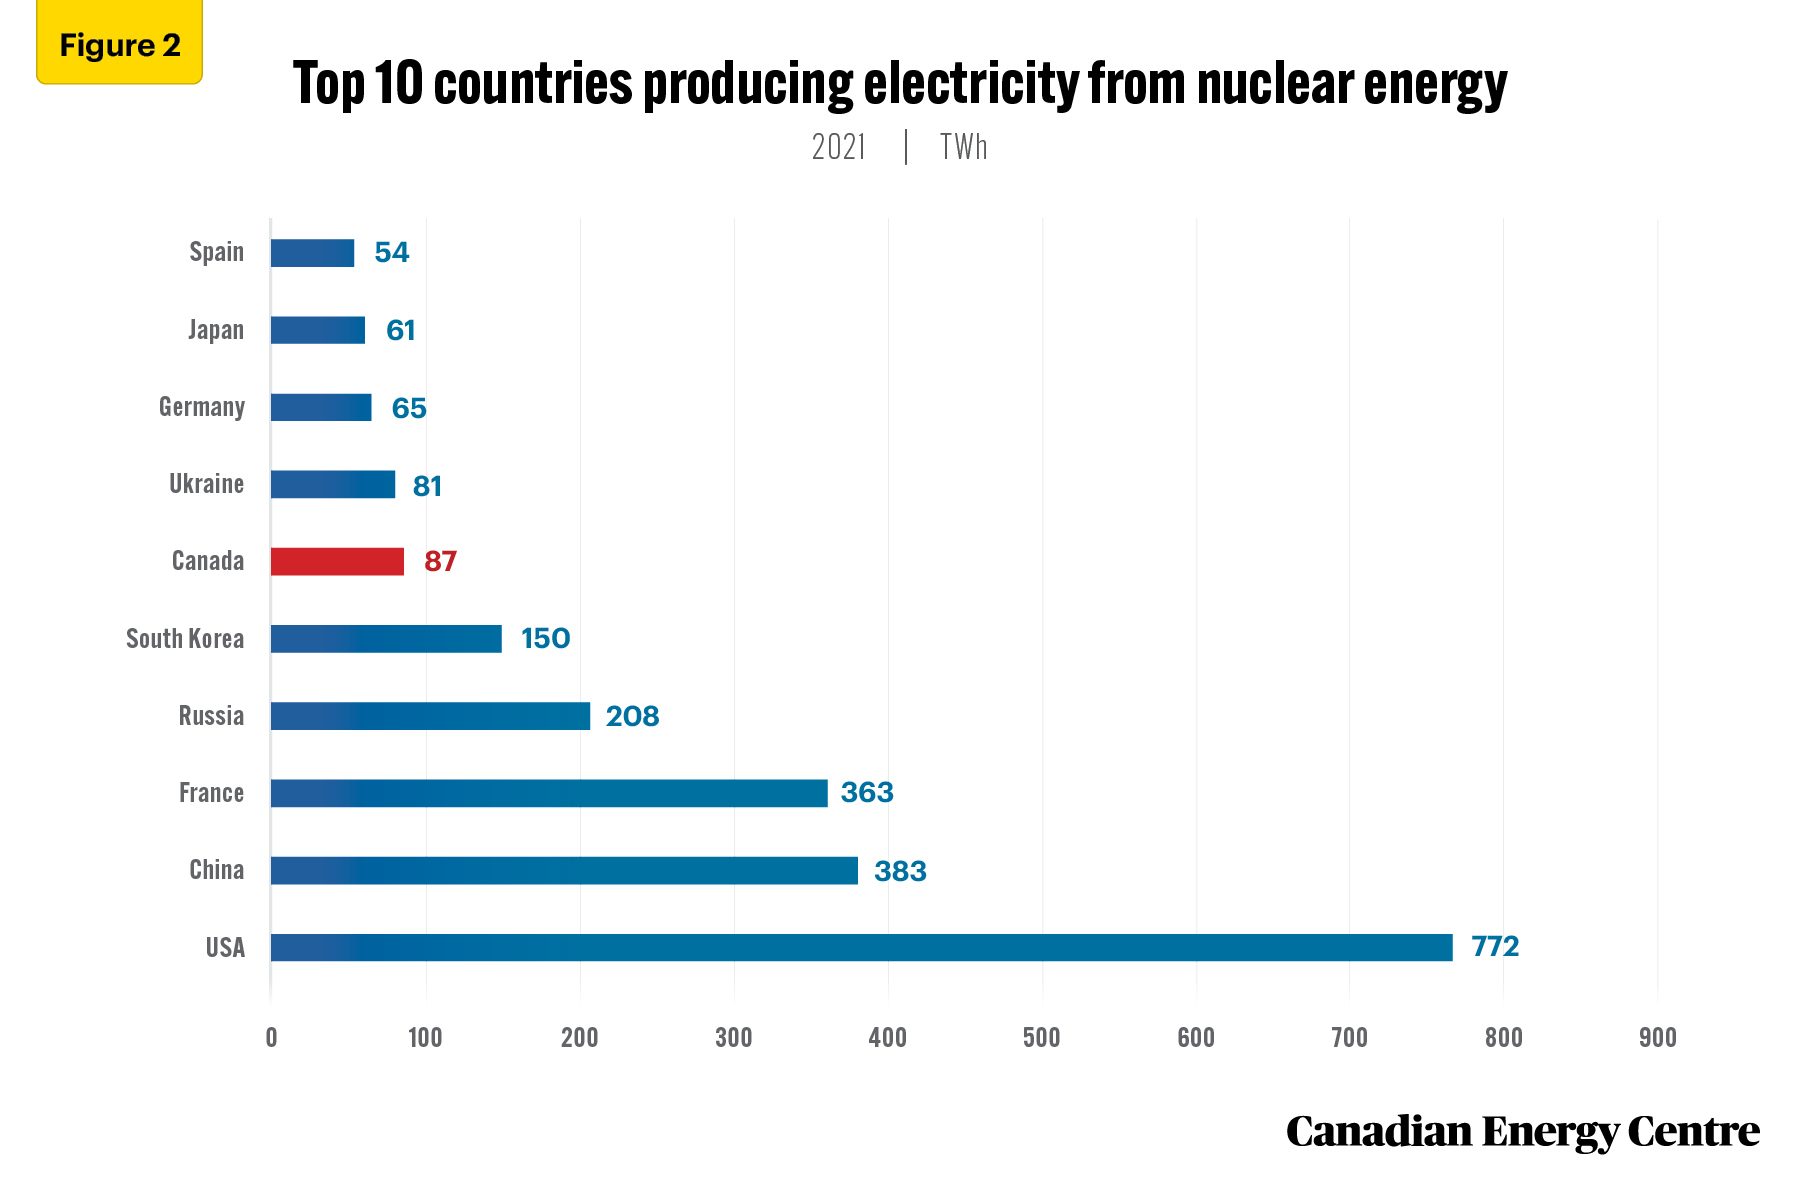
Source: IAEA, 2022
Nuclear power in Canada
Nuclear power plants have been producing electricity in Canada since the 1960s. As of 2022, four nuclear power plants operate in Canada. Of the four plants, three are in Ontario and one in New Brunswick.
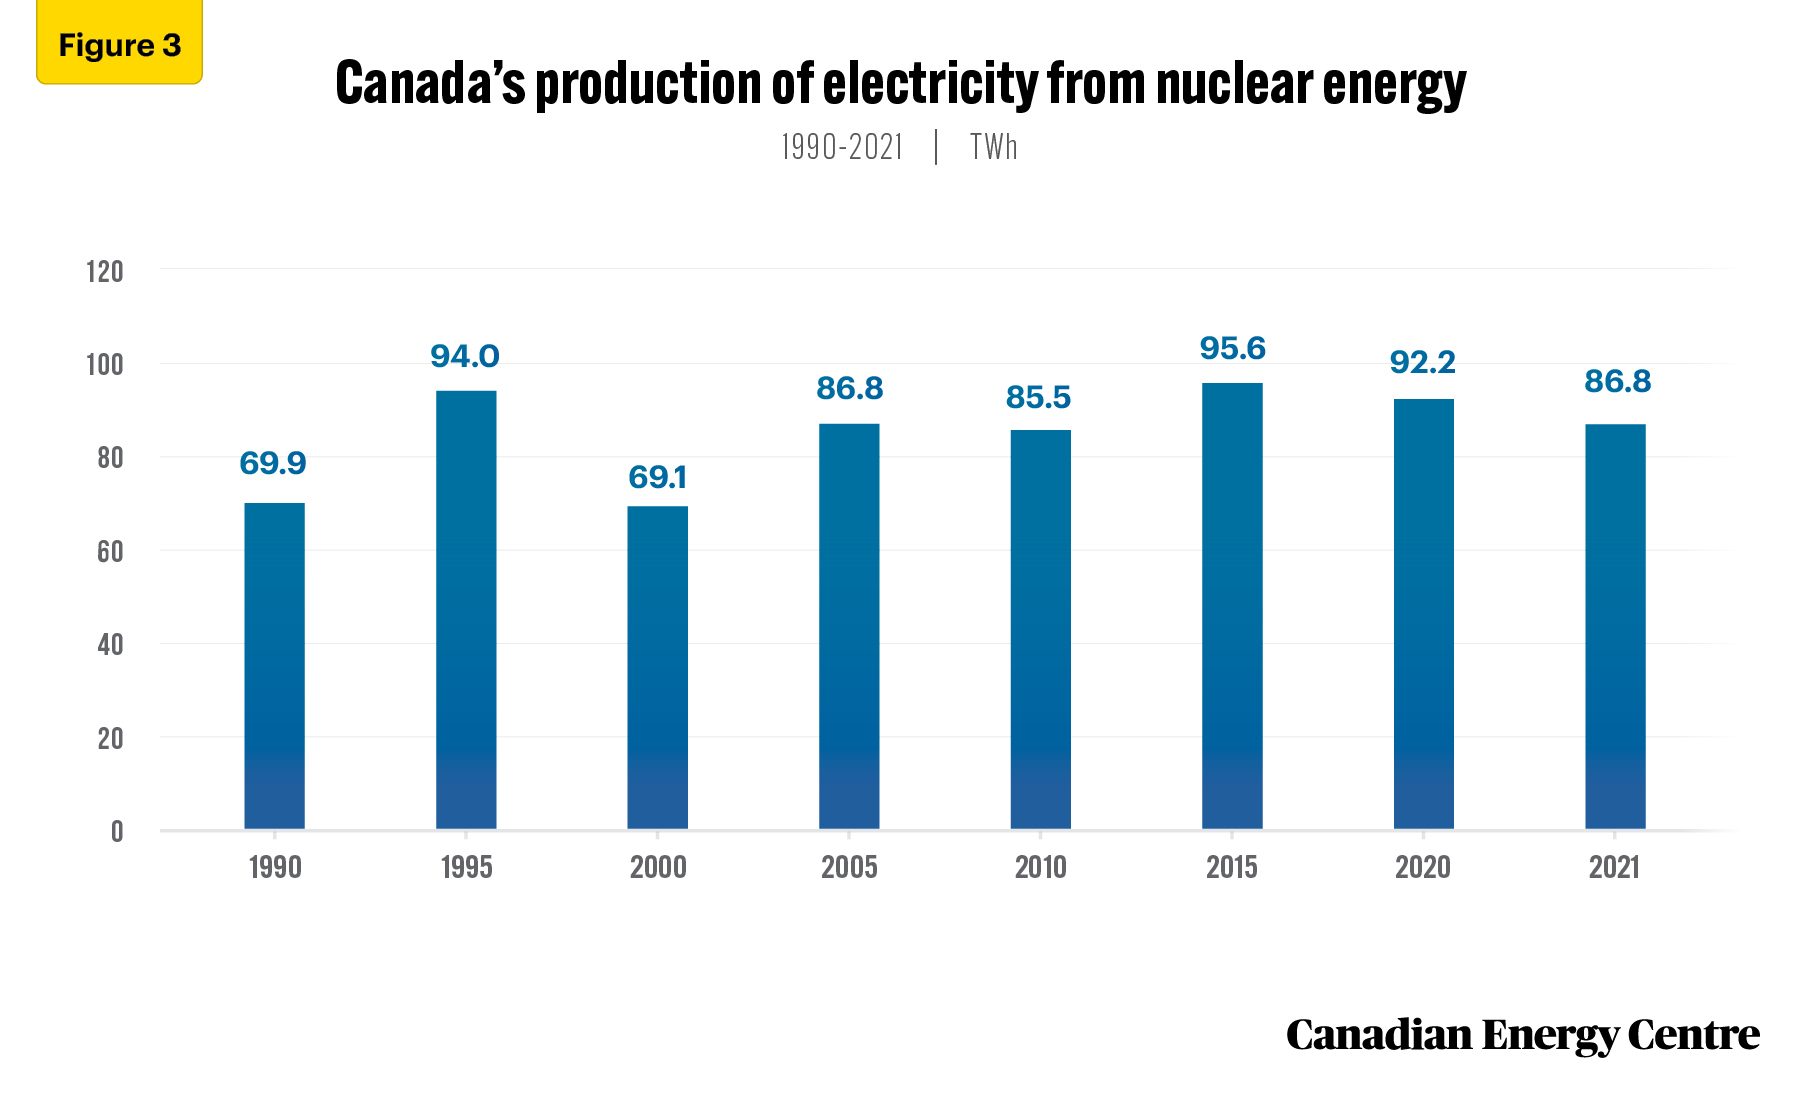
According to data from the IAEA, Canada’s share of nuclear electricity production has remained relatively stable over the past few decades. In 1990, nuclear energy accounted for about 14.8 per cent of Canada’s electricity production; by 2021, this share had decreased only slightly to about 14.3 per cent.
Over the same period, Canada’s nuclear power production increased from 69.9 TWh in 1990 to 86.8 TWh as of 2021 (see Figure 3).
It is worth noting that nuclear energy remains an integral part of Canada’s energy mix, particularly in Ontario, where it is the largest source of electricity generation. Sixty per cent of Ontario’s power needs are met by nuclear energy.
Source: IAEA, 2022
Dependence on nuclear power
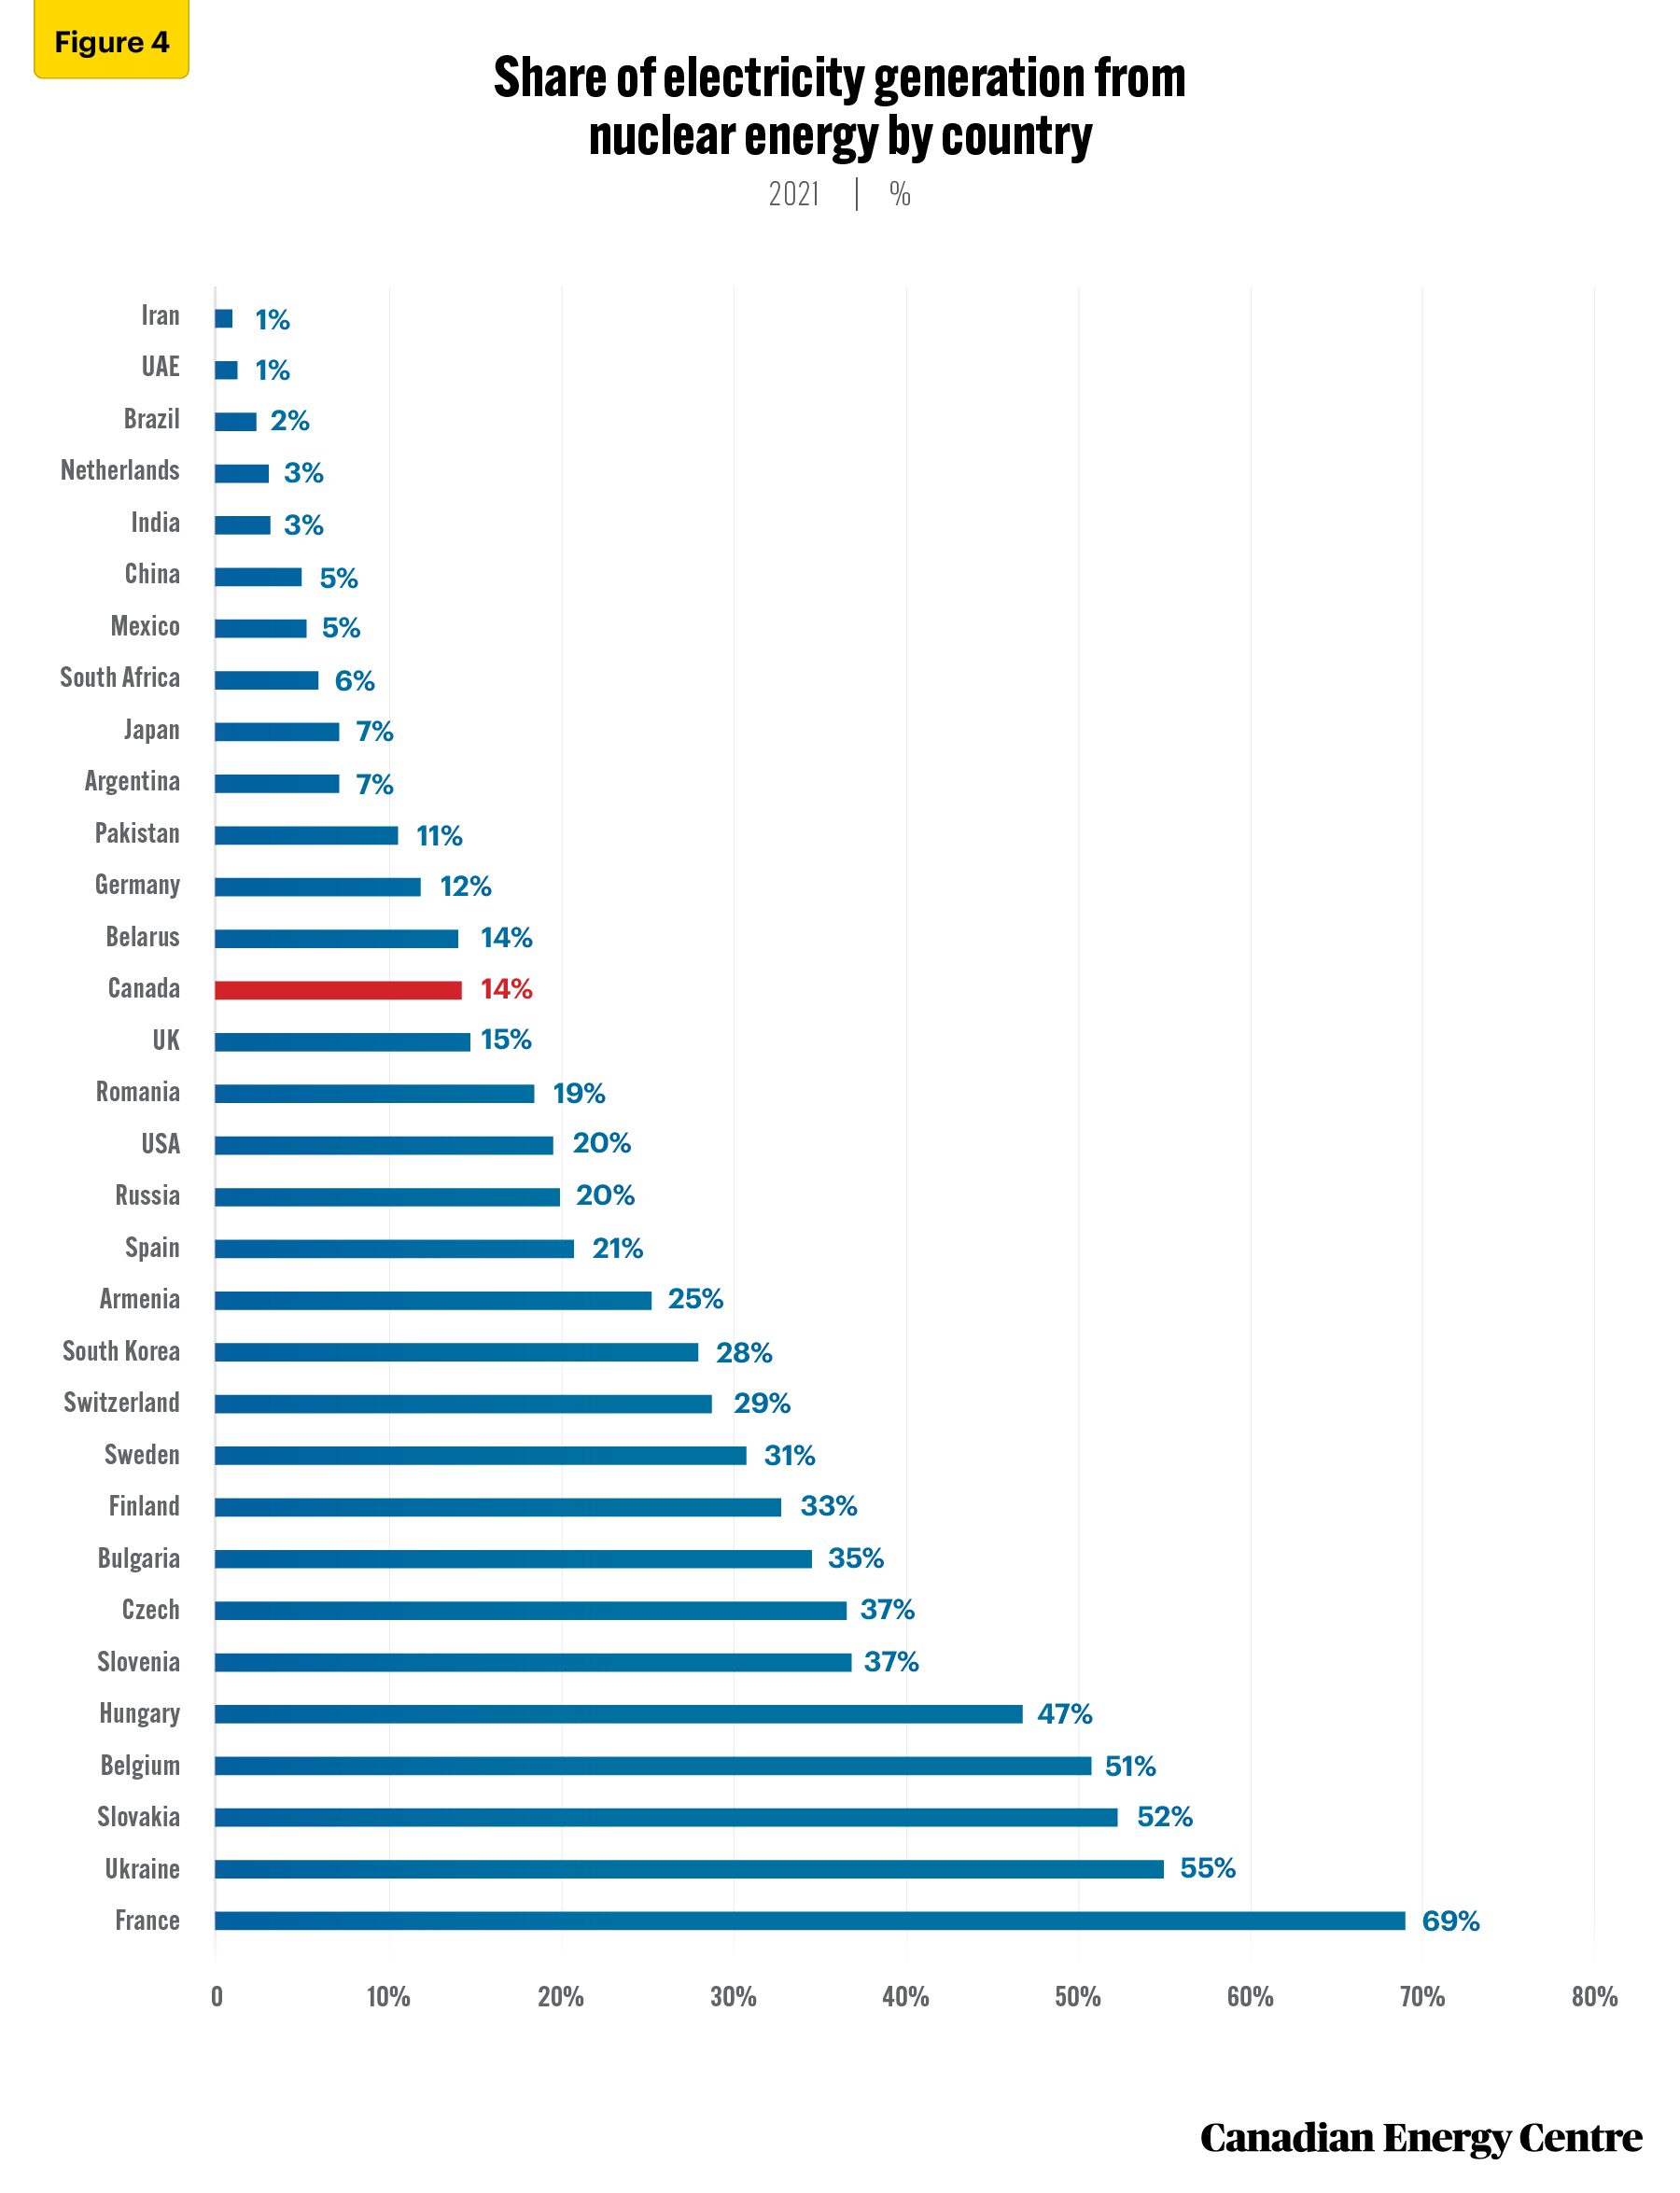
Several countries rely heavily on nuclear power to meet their electricity needs. France is the world’s most nuclear-dependent country, accounting for approximately 69 per cent of its electricity generation capacity. France has 56 nuclear reactors, making it the second largest in terms of the number of nuclear power plants after the U.S (see Table 1).
Of interest, the Ukraine relies heavily on nuclear power, accounting for around 55 per cent of electricity generation capacity. Ukraine has 15 nuclear reactors, making it one of Europe’s largest nuclear energy producers.
Nuclear power accounts for around 52 per cent of Slovakia’s electricity generation capacity. Slovakia has four nuclear reactors and plans to build two additional facilities.
Belgium relies on nuclear power for around 51 per cent of its electricity generation capacity.
Hungary obtains around 47 per cent of its electricity from nuclear power, with four reactors currently in operation.
South Korea generates around 28 per cent of its electricity from nuclear power, with 24 reactors currently operating.
As of 2021, Canada generates around 14 per cent of its electricity from nuclear power, with 19 reactors currently in operation.
The United States is the world’s largest nuclear power producer, with 93 nuclear reactors generating over 20 per cent of the country’s electricity (see Figure 4).
Source: IAEA, 2022
Global nuclear electricity generation capacity
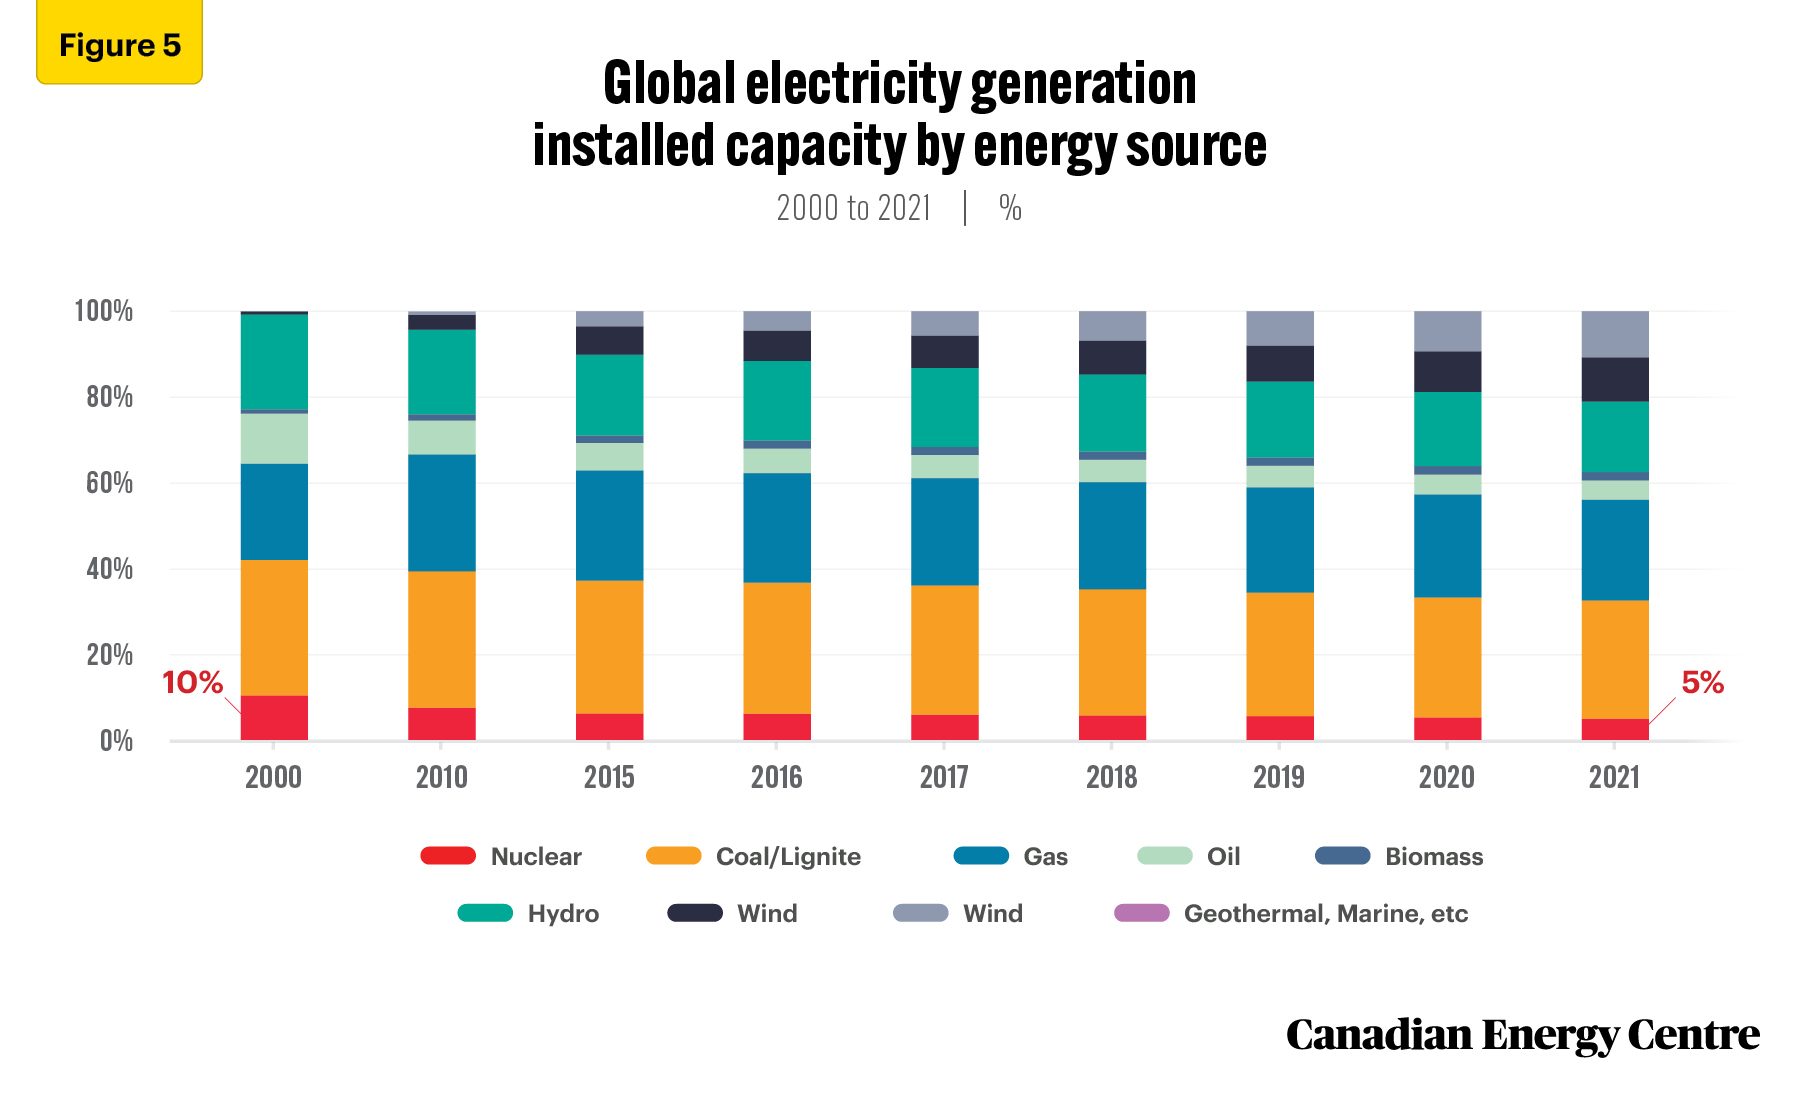
Nuclear electricity generation capacity² remains a relatively small percentage of global electricity generation capacity and has declined steadily since the 2000s. The share of nuclear electricity generation capacity was 10 per cent in 2000. By 2021, it had decreased to five per cent (see Figure 5).
2. Electricity generation means the conversion of any energy sources into electrical energy. Electricity generation can be divided into two categories of energy: conventional and renewable generation. Conventional electricity producers uses energy sources such as oil, coal, gas and nuclear. Renewable electricity generators use wind, solar and hydro energy. Electricity generation capacity is the maximum electricity output an electricity generator can produce under specific conditions. The installed generation capacity specifies the maximum possible electricity generation that can be produced by the installation and usually provided in megawatts.
Source: Enerdata, 2022
The share of global electricity generation capacity from renewable energy sources such as hydro, wind, solar, geothermal, and biomass has increased marginally between 2000 and 2021.
Fossil fuel-based electricity generation capacity continues to dominate the global electricity generation mix, with coal, natural gas, and oil combined accounting for approximately 55 per cent of the world’s electricity generation capacity in 2021.
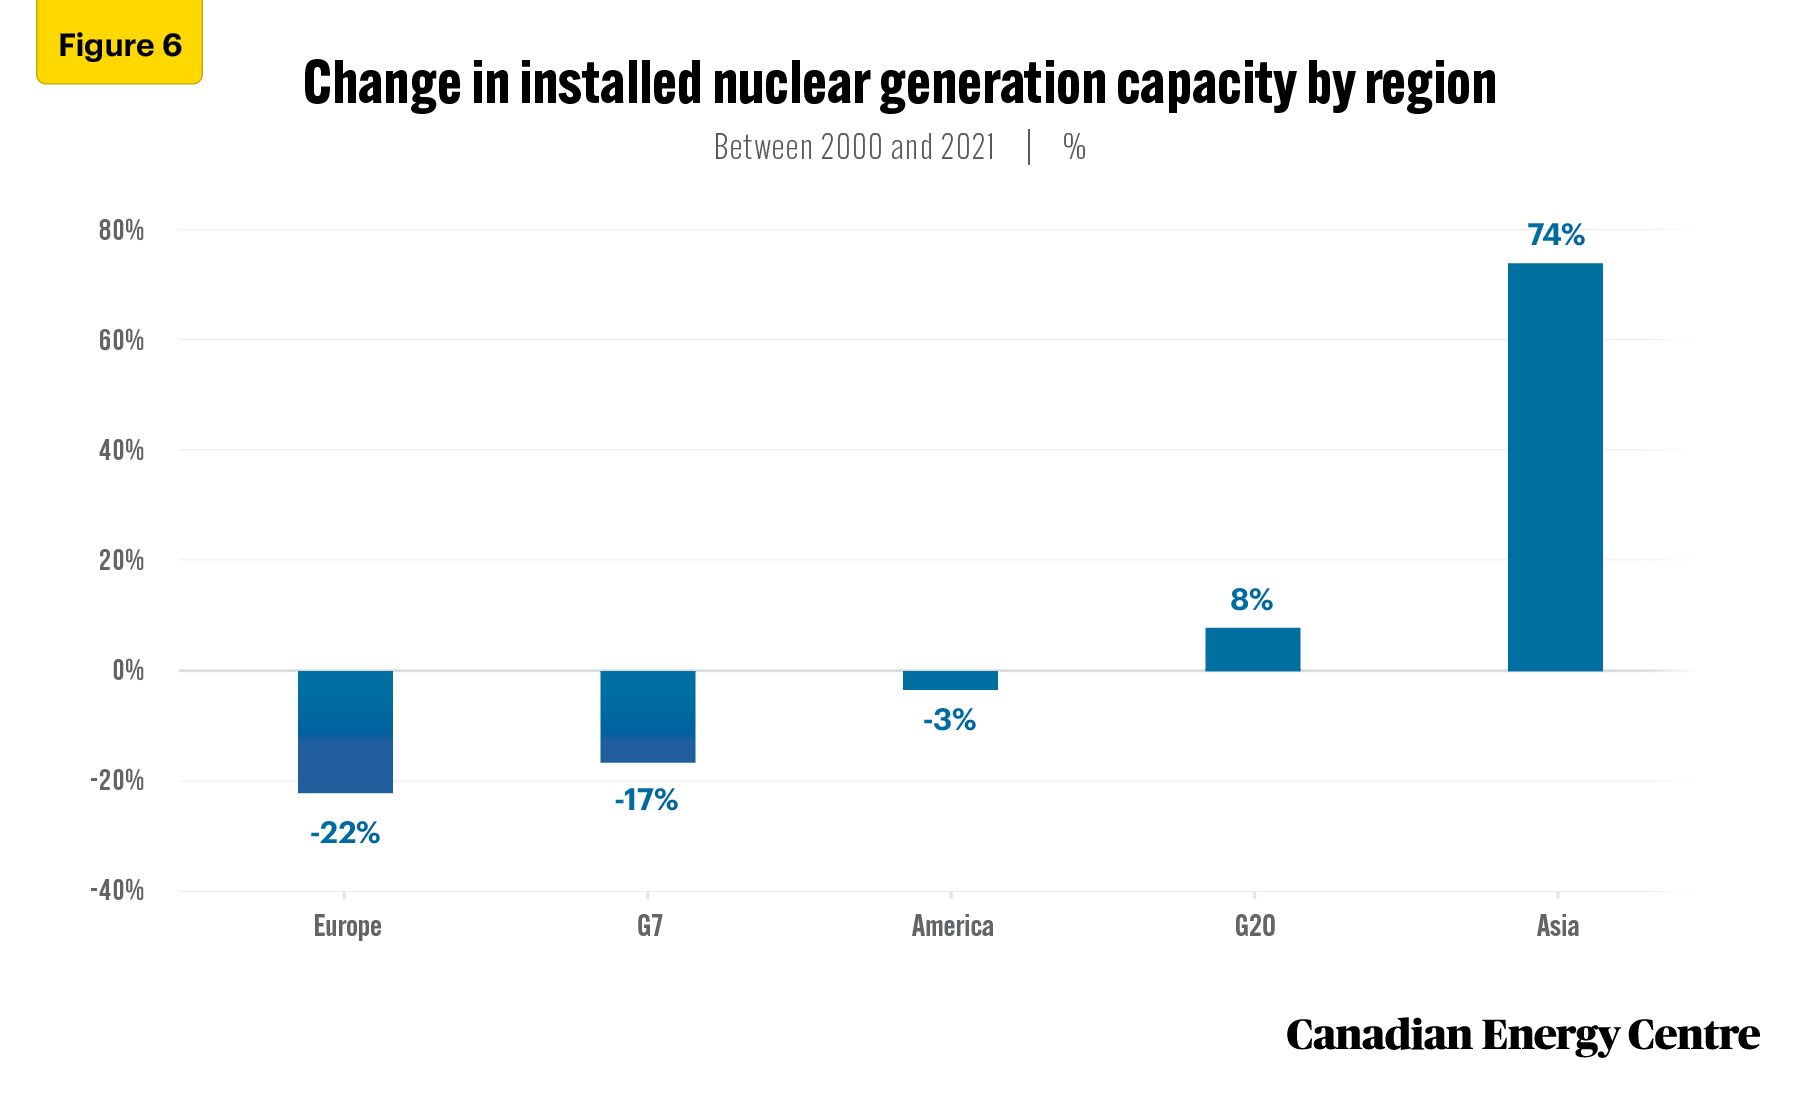
Across Asia, installed nuclear power generation capacity has increased as a percentage of the overall installed capacity from all sources. Between 2000 and 2021, Asia saw the highest jump at 74 per cent, followed by G20 countries³ at eight per cent. In America⁴, installed nuclear electricity generation capacity decreased by three per cent, while in G7 countries,⁵ installed nuclear electricity capacity decreased by about 17 per cent. The most significant decrease of 22 per cent was seen in Europe (see Figure 6).
3. The G20 countries include Argentina, Australia, Brazil, Canada, China, France, Germany, India, Indonesia, Italy, Japan, South Korea, Mexico, Russia, Saudi Arabia, South Africa, Türkiye, the United Kingdom, the United States, and the European Union.
4. America includes countries in North, South and Latin America.
5. The G7 countries include includes Canada, France, Germany, Italy, Japan, the United Kingdom, and the United States.
Source: Author’s calculations derived from Enerdata, 2022
Conclusion
Overall, while global nuclear electricity generation capacity has increased, its growth has been slower than other types of electricity generation.
Countries and regions have different energy sources for their electricity generation, depending on resource availability, energy policies, and economic considerations.
Asia is becoming increasingly reliant on nuclear energy to meet its electricity needs. With so many Asian countries investing heavily in this form of power generation, it looks likely that the growth trend over the past 20 years will in the future.
Notes
This CEC Fact Sheet was compiled by Ven Venkatachalam and Lennie Kaplan at the Canadian Energy Centre (www.canadianenergycentre.ca). The authors and the Canadian Energy Centre would like to thank and acknowledge the assistance of two anonymous reviewers in reviewing the original data and research for this Fact Sheet.
References (all links live as of April 12, 2023)
British Petroleum Company (2022), BP Statistical Review of World Energy in 2022: 71st Edition <https://on.bp.com/3nuuApW>; Canada Nuclear Safety Commission (n.d.),<https://bit.ly/3G3XKTn>; Nuclear power plants Enerdata (2023), Power Plant Tracker Database <https://bit.ly/3xfgOdF>; International Atomic Energy Agency (IAEA) (2004), Fifty Years of Nuclear Power – The Next Fifty Years, Non-serial Publications, IAEA, Vienna; IAEA (2022), Nuclear Power Reactors in the World, Reference Data Series No. 2, IAEA, Vienna <https://bit.ly/40Hokdn>; International Energy Agency (IEA) (2023) World Energy Statistics Database <https://bit.ly/31ca8fp>; Ontario Power Generation (n.d.), Nuclear power <https://bit.ly/3Zshy9P>.
Creative Commons Copyright
Research and data from the Canadian Energy Centre (CEC) is available for public usage under creative commons copyright terms with attribution to the CEC. Attribution and specific restrictions on usage including non-commercial use only and no changes to material should follow guidelines enunciated by Creative Commons here: Attribution-NonCommercial-NoDerivs CC BY-NC-ND.