
To sign up to receive the latest Canadian Energy Centre research to you inbox email: [email protected]
Download the PDF here
Download the charts here
Overview
A significant portion of Canada’s merchandise export trade each year comes from the export of energy products¹, and oil and natural gas products in particular.² Oil and gas exports are a key driver of growth in the Canadian economy and need to be recognized as such.
In fact, oil and gas exports as a proportion of all energy exports have grown over the decades and are becoming more important, not less. Oil and gas exports accounted for 60 per cent of all energy exports in 1988, 79 per cent in 2000, and 82 per cent in 2019.
This Fact Sheet examines the export value (in inflation-adjusted 2019 dollars) of energy products and then oil and natural gas products from Canada to other jurisdictions between 1988 and 2019. The information is drawn from Statistics Canada’s International Merchandise Trade by Commodity data set.
1. Energy products are comprised broadly of crude oil, crude bitumen, natural gas, natural gas liquids and related products, coal, nuclear fuel and other energy products, electricity (including
hydro, wind and solar), and refined petroleum energy products.
2. Oil and natural gas products are comprised specifically of crude oil, crude bitumen, natural gas, and natural gas liquids and related products.
Export value of energy products: Nearly $2.5 trillion between 1988 and 2019
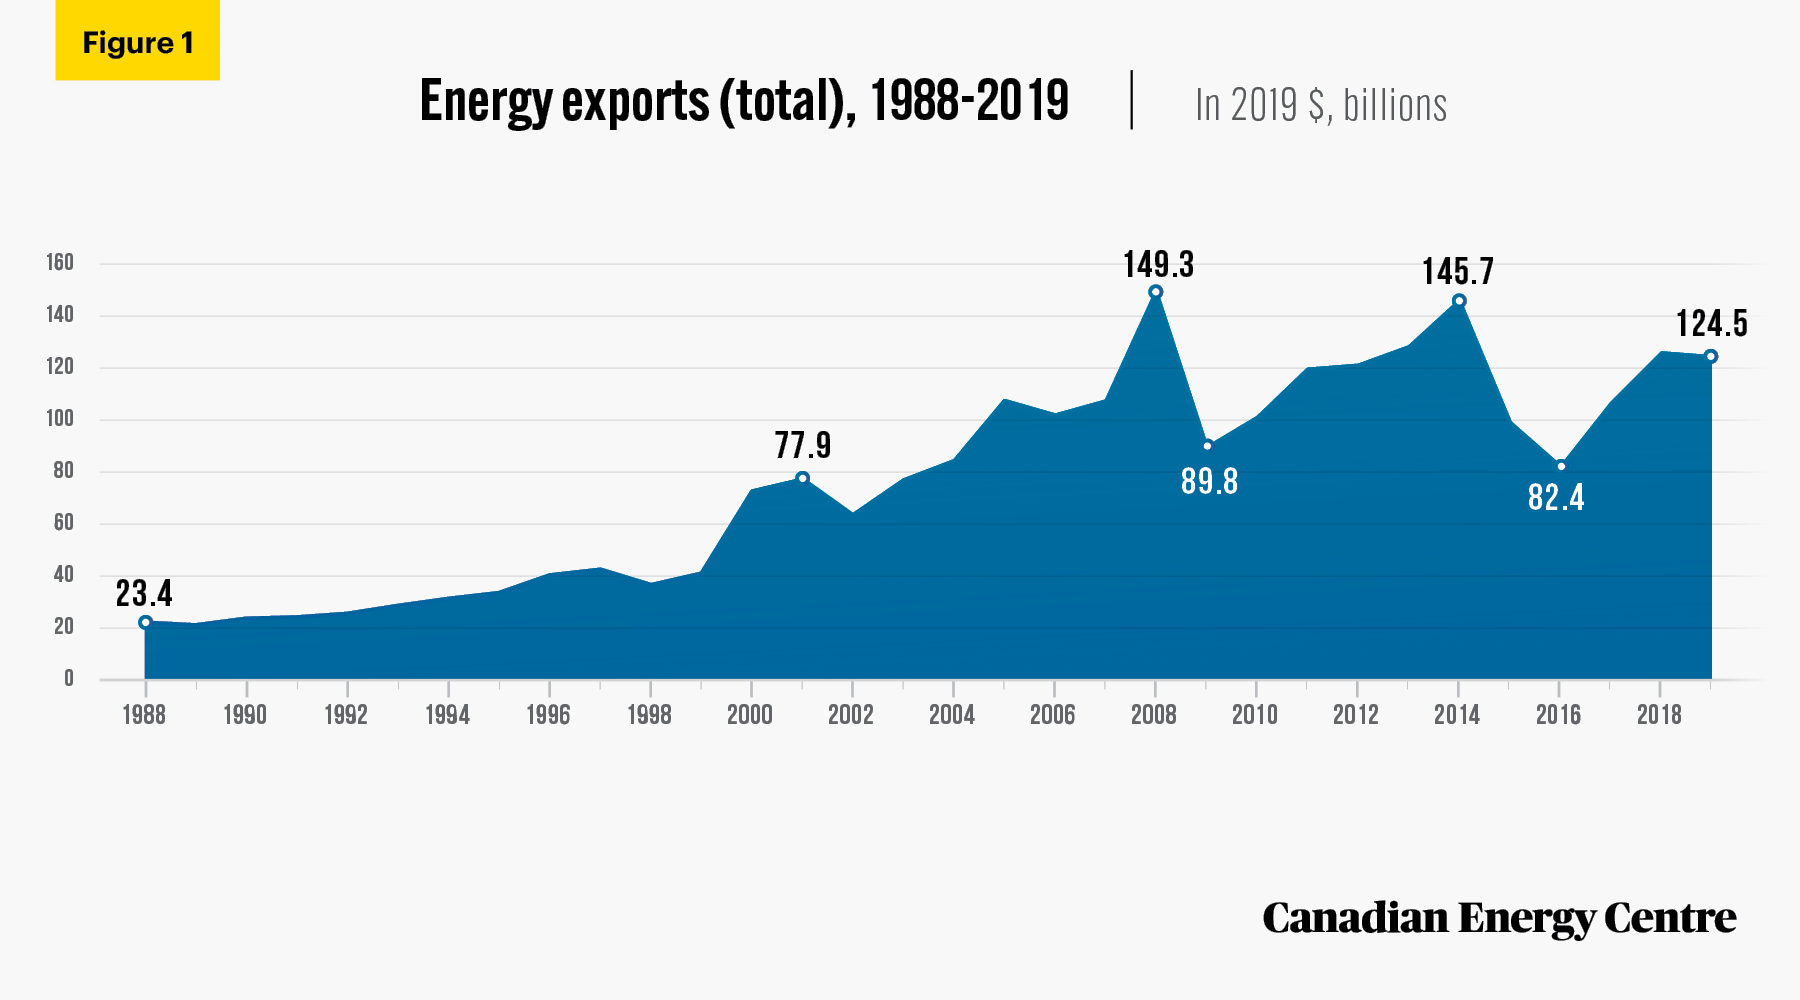
The cumulative value of Canada’s energy product exports was over $2.47 trillion between 1988 and 2019 (see Figure 1).
- The value of Canada’s energy product exports has been as low as $23.4 billion in 1988 an as high $149.3 billion in 2008.
- After 2008, energy exports have been as high $145.7 billion in 2014 and as low as $82.4 billion in 2016.
- As of 2019, energy exports were worth $124.5 billion.
- Between 1988 and 2019, the value of Canadian energy product exports increased by over 432 per cent.
Source: Statistics Canada. Table 12-10-0121-01.
Export value of oil and natural gas products: Over $1.9 trillion between 1988 and 2019
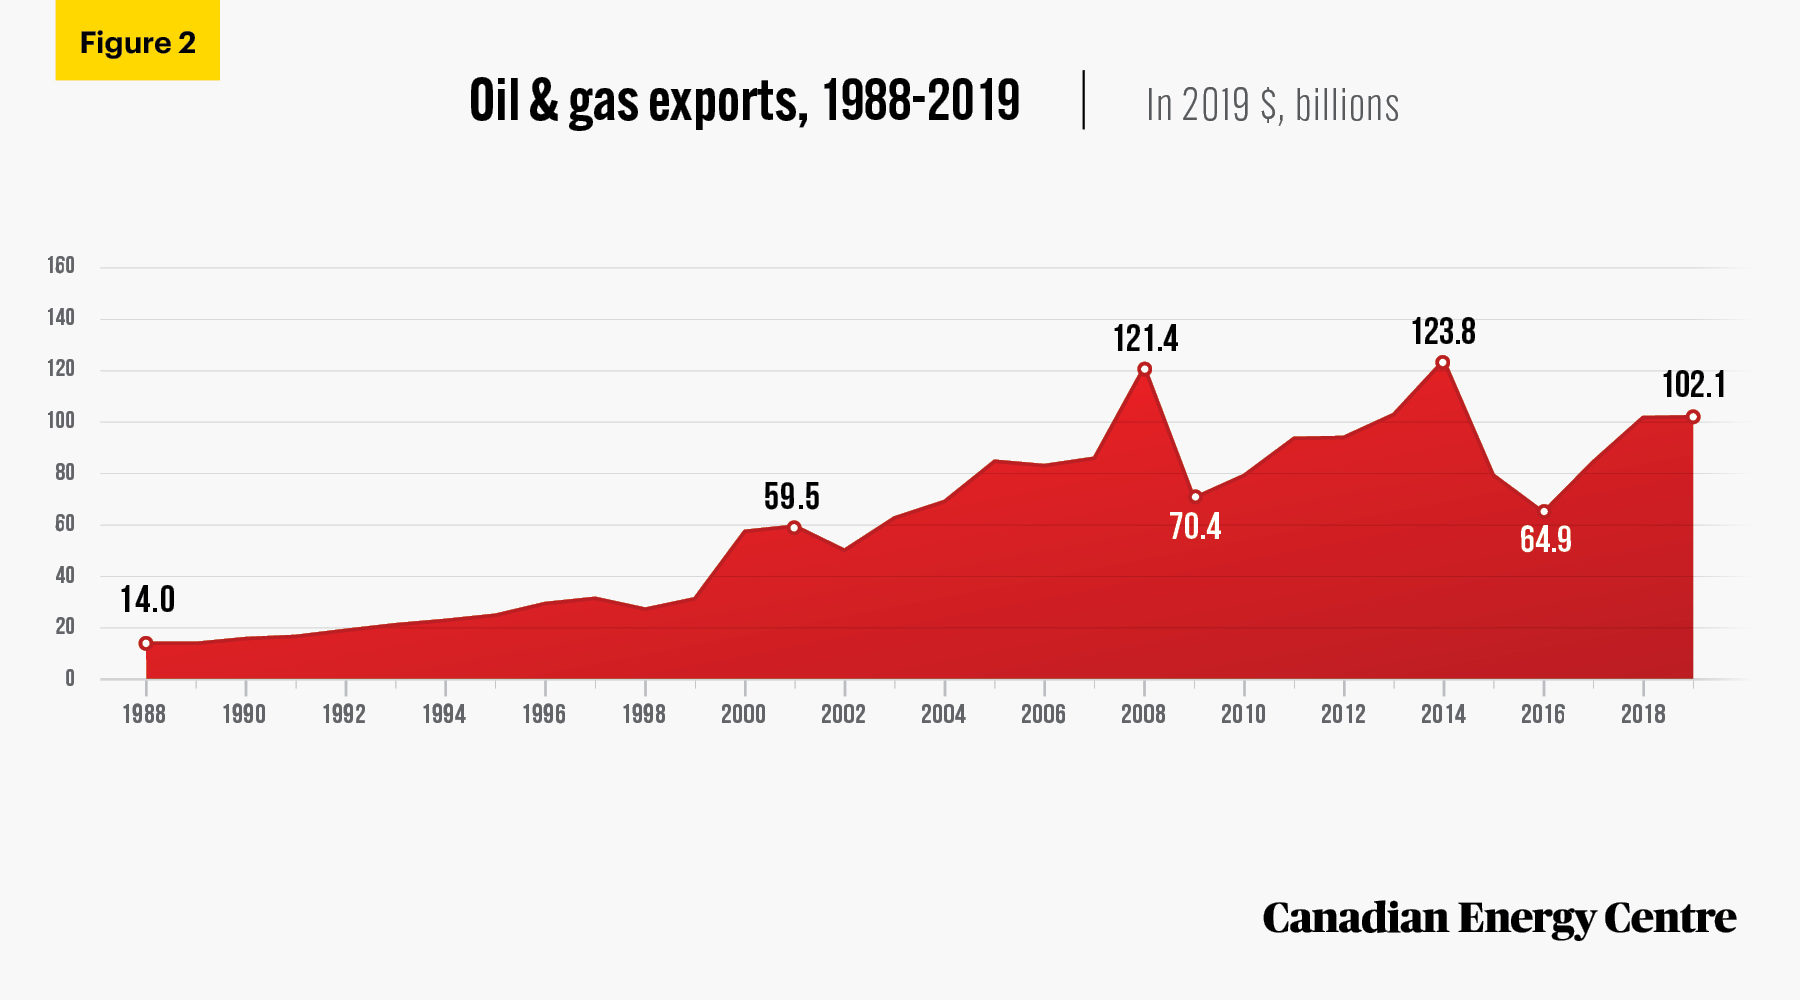
The cumulative value of Canada’s oil and natural gas product exports was over $1.94 trillion between 1988 and 2019 (see Figure 2).
- The value of Canada’s oil and natural gas product exports has been as low as $14 billion in 1988 and as high as $123.8 billion in 2014.
- After 2014, oil and natural gas exports ranged from a low of $64.9 billion in 2016 to a high of $102.1 billion in 2019.
- Between 1988 and 2019, the real value of Canadian oil and natural gas exports increased by nearly 630 per cent.
Source: Statistics Canada. Table 12-10-0121-01.
Oil and gas exports are increasing as a percentage of total energy exports
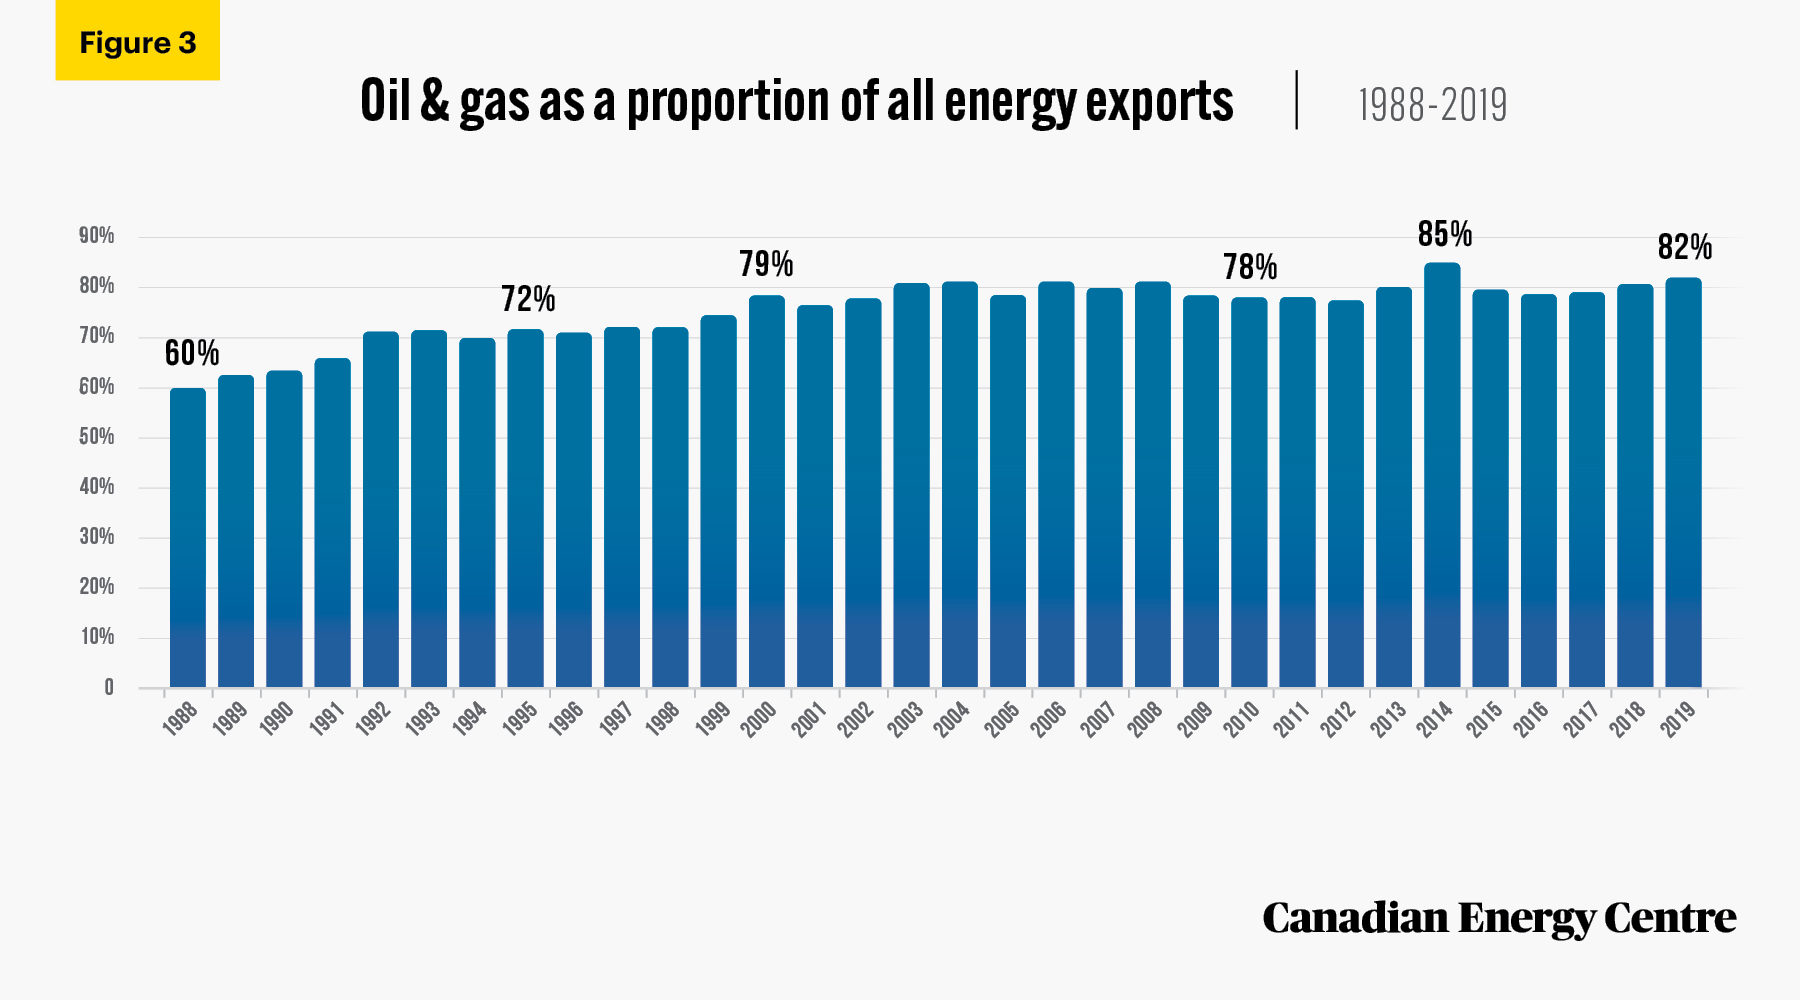
As a proportion of total energy exports, oil and natural gas product exports have for the most part been increasing (see Figure 3).
- Oil and gas exports accounted for 60 per cent of all energy exports in 1988, rising to 79 per cent in 2000 and 82 per cent in 2019.
- Oil and gas exports were down in 2019 compared to the peak year as a proportion of energy exports—2014 at 85 per cent, but still on the high end of the range
Source: Statistics Canada. Table 12-10-0121-01.
Value of energy product exports and oil and gas product exports as a percentage of total merchandise exports
As a proportion of total exports, energy and oil and natural gas have for the most part been increasing (see Figure 3).
- Energy exports—average: Canada’s energy product exports’ real share of total merchandise export value averaged 17.5 per cent between 1988 and 2019.
- Energy exports—range: Canada’s energy product exports’ share of total merchandise export value ranged from 9.1 per cent in 1988 to as high as 26.2 per cent in 2008, before declining 21.5 per cent in 2009. It then rose to 25.9 per cent in 2014 and declined again to 15.3 per cent in 2016 before recovering to 21.0 per cent in 2019.
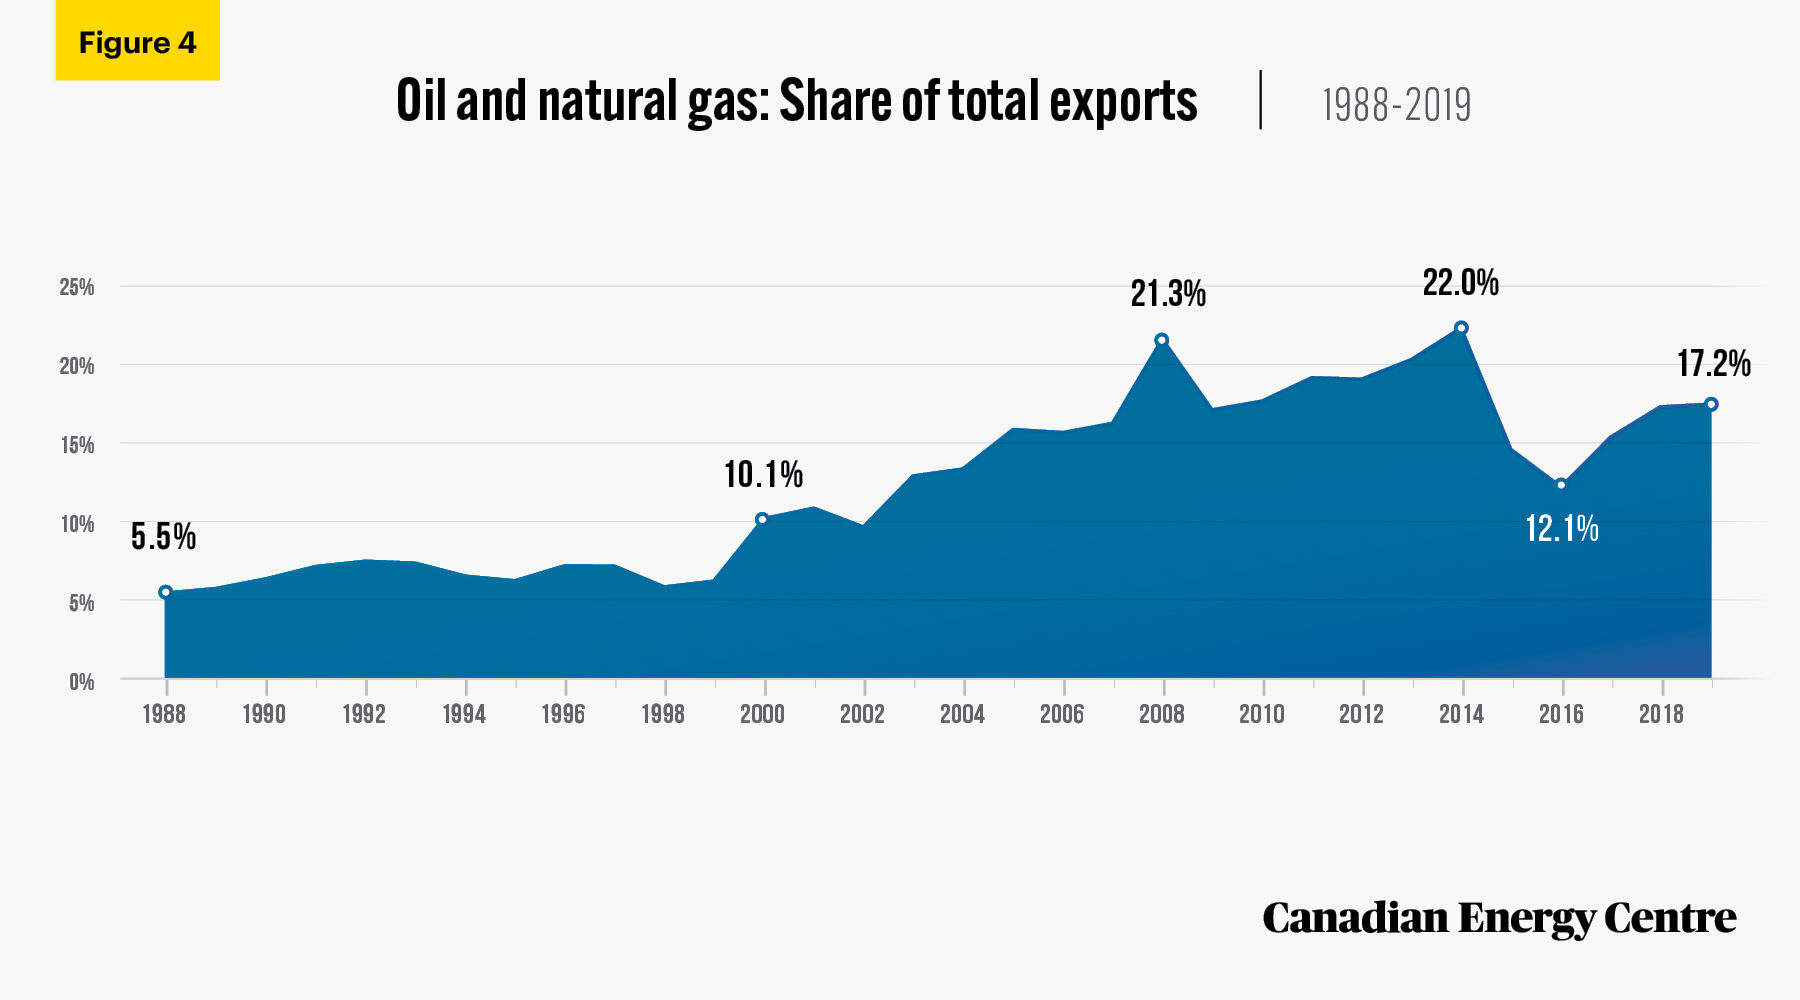
- Oil and gas exports—average: Canada’s oil and natural gas product exports’ real share of total merchandise export value averaged 13.2 per cent between 1988 and 2019.
- Oil and gas exports—range: Oil and gas product exports’ real share of total merchandise export value has ranged from a low of 5.5 per cent in 1988 to as high as 22.0 per cent in 2014. It declined to 12.1 per cent in 2016 before increasing to 17.2 per cent in 2019 (see Figure 4).
Source: Statistics Canada. Table 12-10-0121-01.
Comparisons with other key Canadian export products
The $2.47 trillion value of Canadian energy product exports and $1.94 trillion value of Canadian oil and natural gas product exports between 1988 and 2019 compares favourably to other key Canadian export products (see Figure 5). Between 1988 and 2019, the cumulative value of various exports included:
- electricity exports ($207 billion);
- aircraft and other transportation equipment ($566 billion);
- consumer goods exports³ (1.47 trillion); and
- motor vehicles and parts exports ($2.79 trillion).
- Between 1988 and 2019, energy exports were next highest exports (after motor vehicles and parts) at just under $2.5 trillion. The oil and gas export share of that figure was just over $1.9 trillion.
3. Food, beverage and tobacco products; clothing, footwear and textile products; paper and published products; pharmaceutical and medicinal products; furniture and fixtures; and cleaning products, appliances, and miscellaneous goods and supplies.

Source: Statistics Canada. Table 12-10-0121-01.
The takeaway
Merchandise exports are an important factor in driving economic growth and job creation across Canada. Energy products, and oil and natural gas products in particular, have been a significant component of those merchandise exports between 1988 and 2019.
Between 1988 and 2019, the cumulative value of Canadian energy product exports was $2.47 trillion, or 17.5 per cent of total merchandise exports.
Between 1988 and 2019, the value of Canadian oil and natural gas product exports were $1.94 trillion, or 13.8 per cent of total merchandise exports.
Notes
This CEC Fact Sheet was compiled by Lennie Kaplan and Mark Milke at the Canadian Energy Centre (www.canadianenergycentre.ca). The authors and the Canadian Energy Centre would like to thank and acknowledge the assistance of Tim Lutton and John D. Wilkin in reviewing the data and research for this Fact Sheet. Image credits: Tanker Ship Sunset by Raw2Jpeg at Pixabay.
References (All links live as of December 4, 2020)
Finance Canada (2020a). Economic and Fiscal Snapshot. <https://bit.ly/3nCrXhe>; Finance Canada (2020b). Fiscal Reference Tables. <https://bit.ly/36SvzWy>; Kneebone, Ronald and Wilkins, Margarita (2020). Canadian Provincial Government Budget Data – Newly Updated to 2018/19 <https://bit.ly/3lIbhDl>; Statistics Canada (2020). Table 12-10-0121-01 International merchandise trade by commodity, monthly. <https://bit.ly/34cAHDd>.
Creative Commons Copyright
Research and data from the Canadian Energy Centre (CEC) is available for public usage under creative commons copyright terms with attribution to the CEC. Attribution and specific restrictions on usage including non-commercial use only and no changes to material should follow guidelines enunciated by Creative Commons here: Attribution-NonCommercial-NoDerivs CC BY-NC-ND.