To sign up to receive the latest Canadian Energy Centre research to your inbox email: [email protected]
Download the PDF here
Download the charts here
Overview: Environmental spending in Canada
This Fact Sheet details spending on environmental protection by Canada’s oil and gas sector, other industries, and provincial governments. The comparisons are made using the most recent data from Statistics Canada. For provincial government spending, data are available from 2008 to 2020 on an annual basis.¹
As the data make clear, Canada’s oil and gas sector spent the most of any industry in the country on environmental protection—$6.6 billion during 2018 and 2019, accounting for 34 per cent of total environmental protection expenditures made by business across Canada in those years.
As for governments, Alberta spent $21.4 billion on environmental protection between 2008 and 2020. Measured per capita, Alberta’s spending on environmental protection was higher than the average of the other nine provinces every year, regardless of the party in power. For example, in 2020, the most recent year for which data are available, Alberta spent $327 per capita on environmental protection—112 per cent of the nine-province average of $293 per capita.
Comparison One: Environmental protection spending by industry
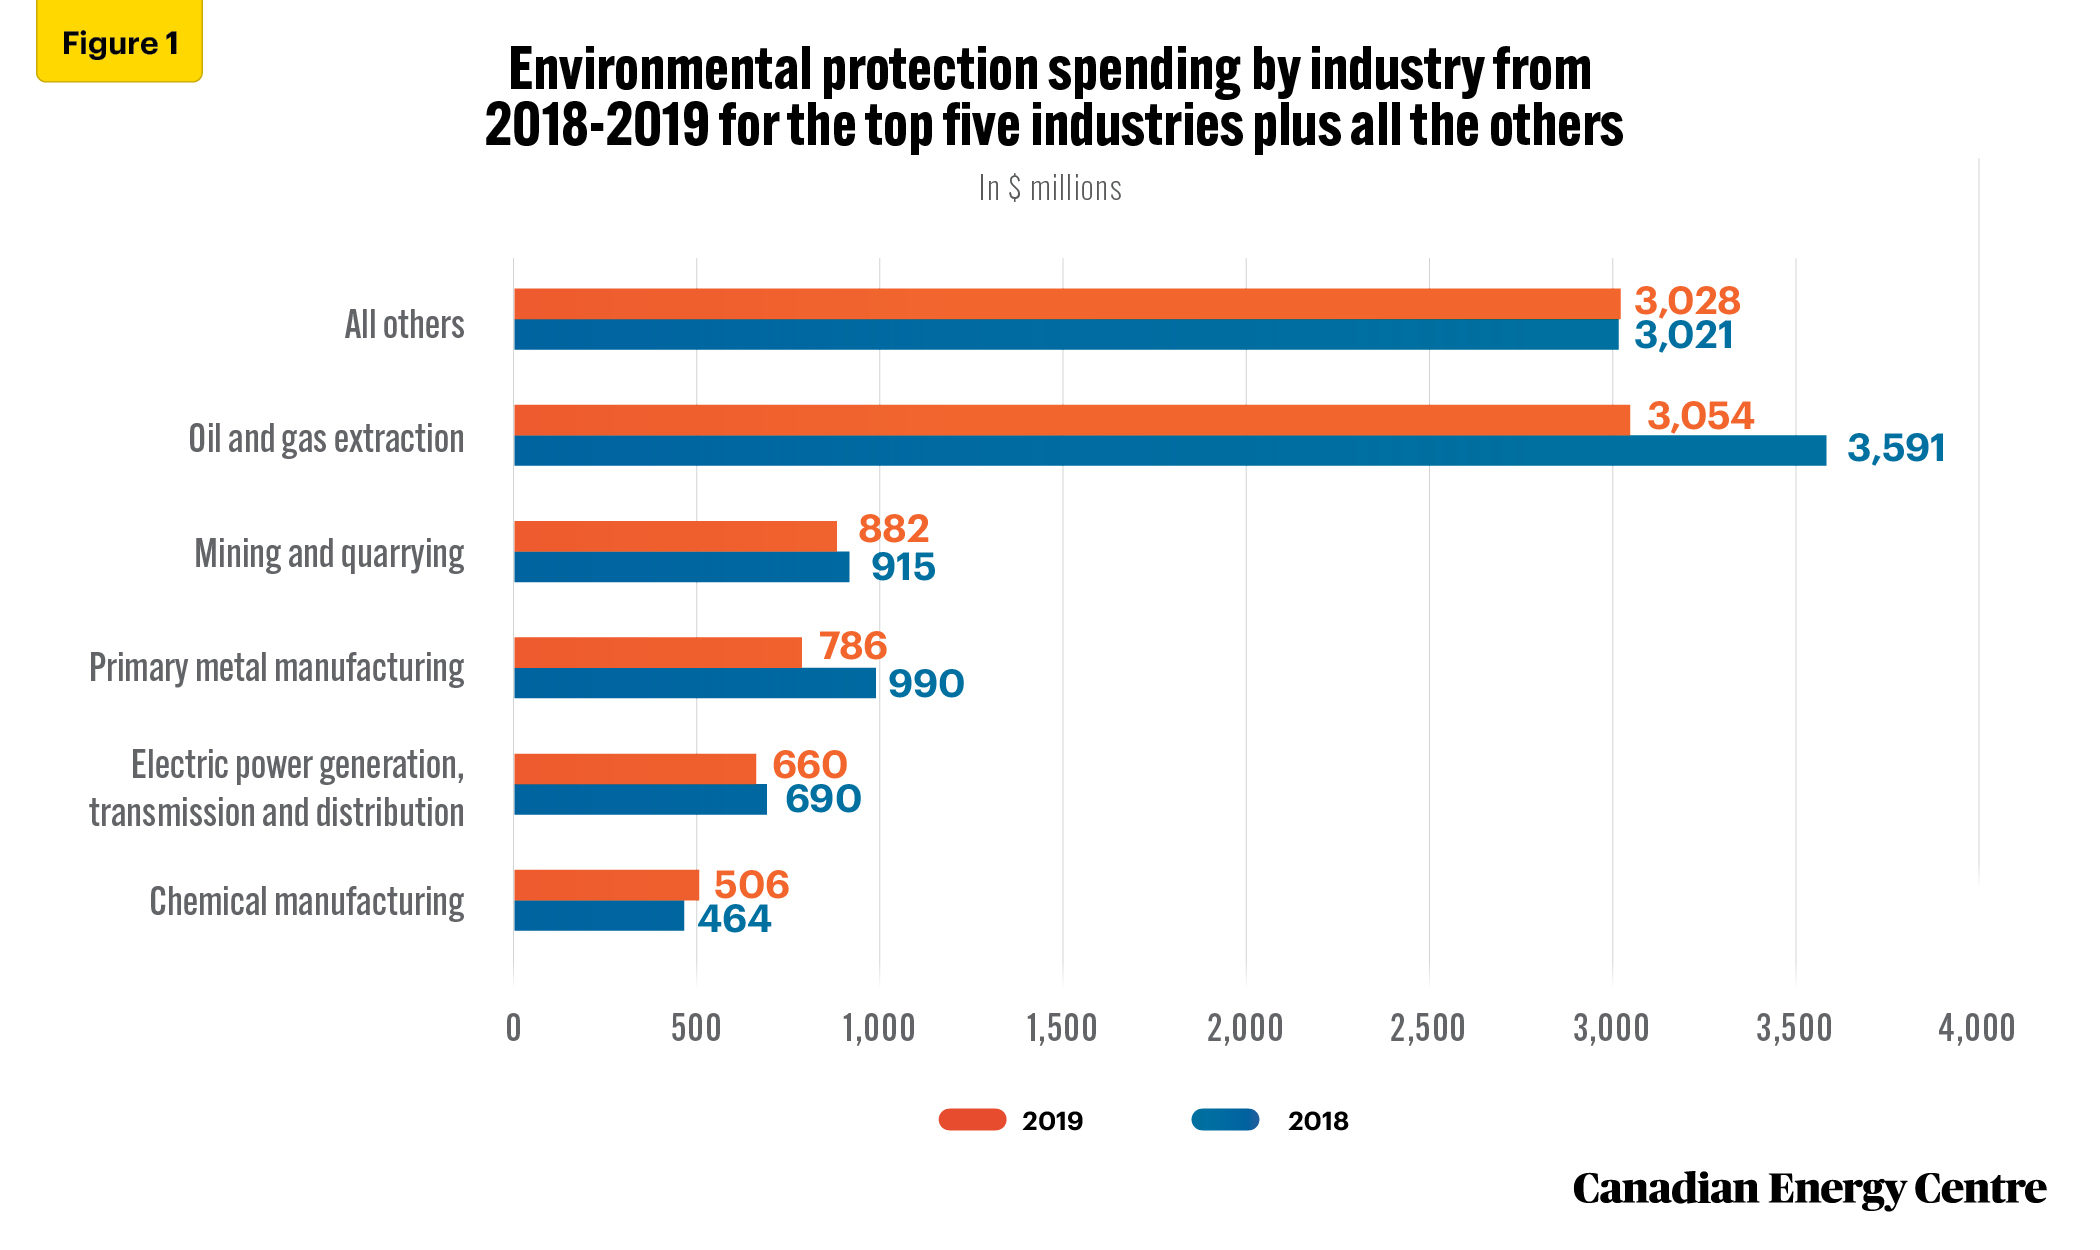
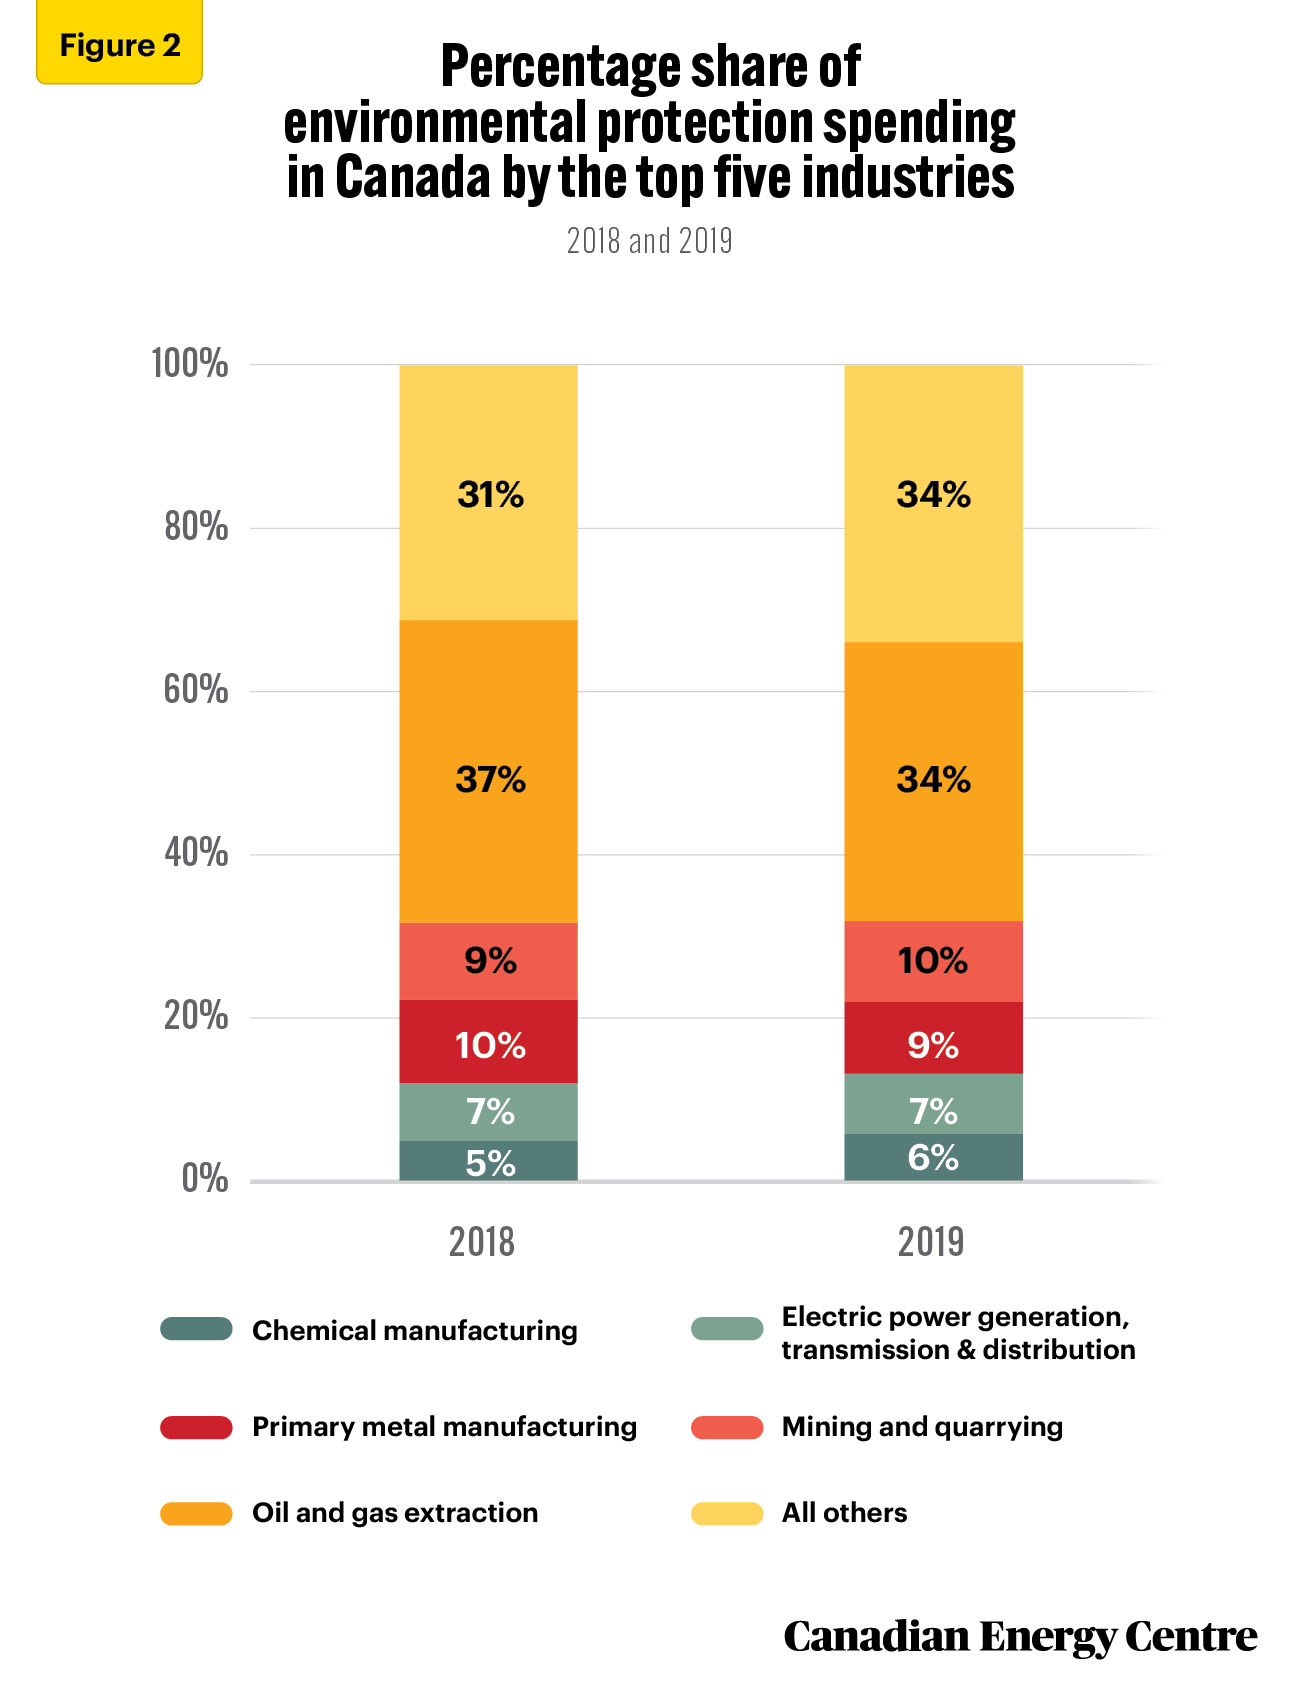
Figures 1 and 2 show that Canadian business spent $18.6 billion on environmental protection in 2018 and 2019.
- For total spending, i.e., when capital and operating expenses on environmental protection are combined, out of the $18.6 billion spent between 2018 and 2019:
º Over the two years 2018 and 2019, the oil and gas sector spent $6.6 billion or 34 per cent of the total over both years, while all other industries combined spent $11.9 billion or 64 per cent of the total during both 2018 and 2019 (see Figure 1).
1. Statistics Canada surveys companies only every second year, i.e., 2006, 2008, and so forth. This leads to an underestimate of environmental spending by companies, possibly by as much as 50 per cent, given that data for every second year is absent.
Source: Statistics Canada, Table 38-10-0130-01.
º In 2019, the oil and gas sector spent $3 billion in environmental protection expenditure, which constituted 34 per cent of all Canadian business environmental spending that year (See Figure 2).
º Those other major industries include mining and quarrying and primary metal manufacturing (each about $1.7 billion), electric power generation, transmission and distribution ($1.3 billion) and chemical manufacturing ($0.9 billion).
Historically, the oil and gas sector has spent a significant amount on environmental protection. Businesses in Canada spent $67.7 billion in total between 2006 and 2018 on capital and operating expenses on environmental protection. In that same period, the oil and gas sector alone spent $28.1 billion or 41 per cent on environmental protection, while all other industries combined spent $39.6 billion or 59 per cent.
Source: Statistics Canada, Table 38-10-0130-01.
Breakdowns by capital and operating
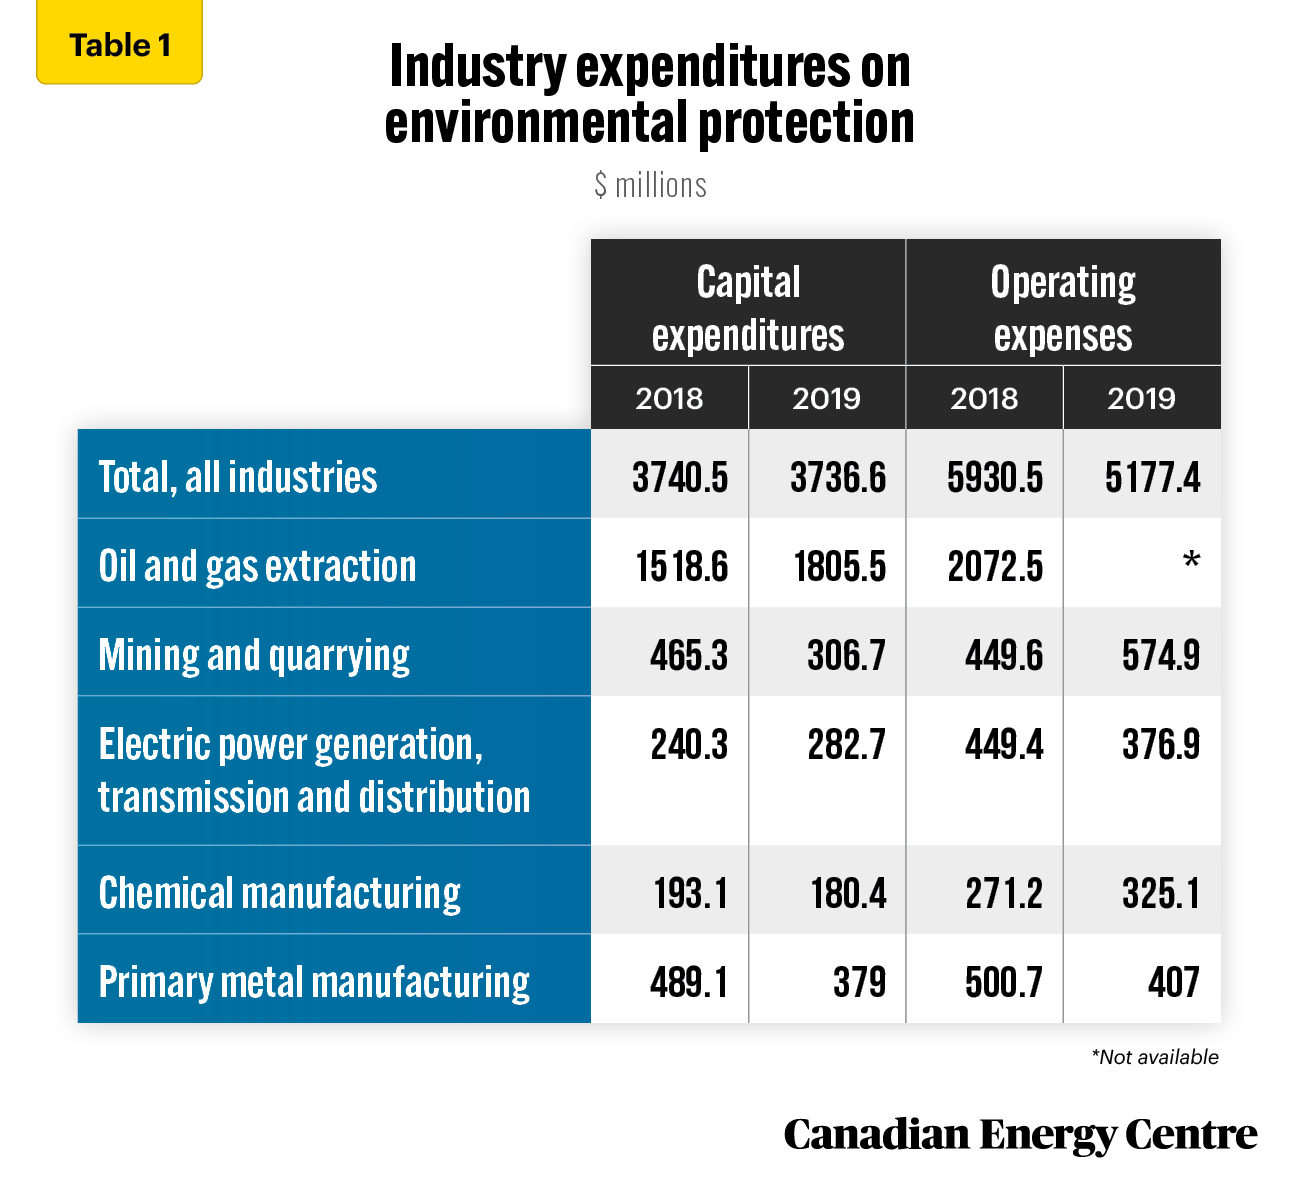
- Capital expenditure.² In 2018, the oil and gas sector was responsible for 41 per cent ($1.5 billion) of all capital spending on environmental protection compared with 59 per cent for all other industries ($2.2 billion). In 2019, the oil and gas sector spent $1.8 billion, accounting for 48 per cent of the all the industry spending on environmental protection (see Table 1); and
- Operating expenses.³ In 2018, the oil and gas sector was responsible for 34 per cent ($2 billion) of all operating expenditures for environmental protection compared with 66 per cent for all other industries combined ($3.8
billion).
From 2006 to 2018, the oil and gas sector was responsible for 51 per cent ($15.2 billion) of all capital spending for environmental protection compared with 49 per cent for all other industries ($14.7 billion). Meanwhile, in that period the oil and gas sector was responsible for 34 per cent ($12.9 billion) of all operating expenditures for environmental protection compared with 66 per cent for all other industries ($24.9 billion).
2. Capital expenditure includes outlays on machinery and equipment and for the construction of non-residential facilities, among other expenditures.
3. Operating expenses include expenses incurred for labour, materials and supplies, and maintenance and repair, among others.
Source: Statistics Canada, Table 38-10-0130-01.
Comparison Two: Environmental spending by the provinces, 2008-2020
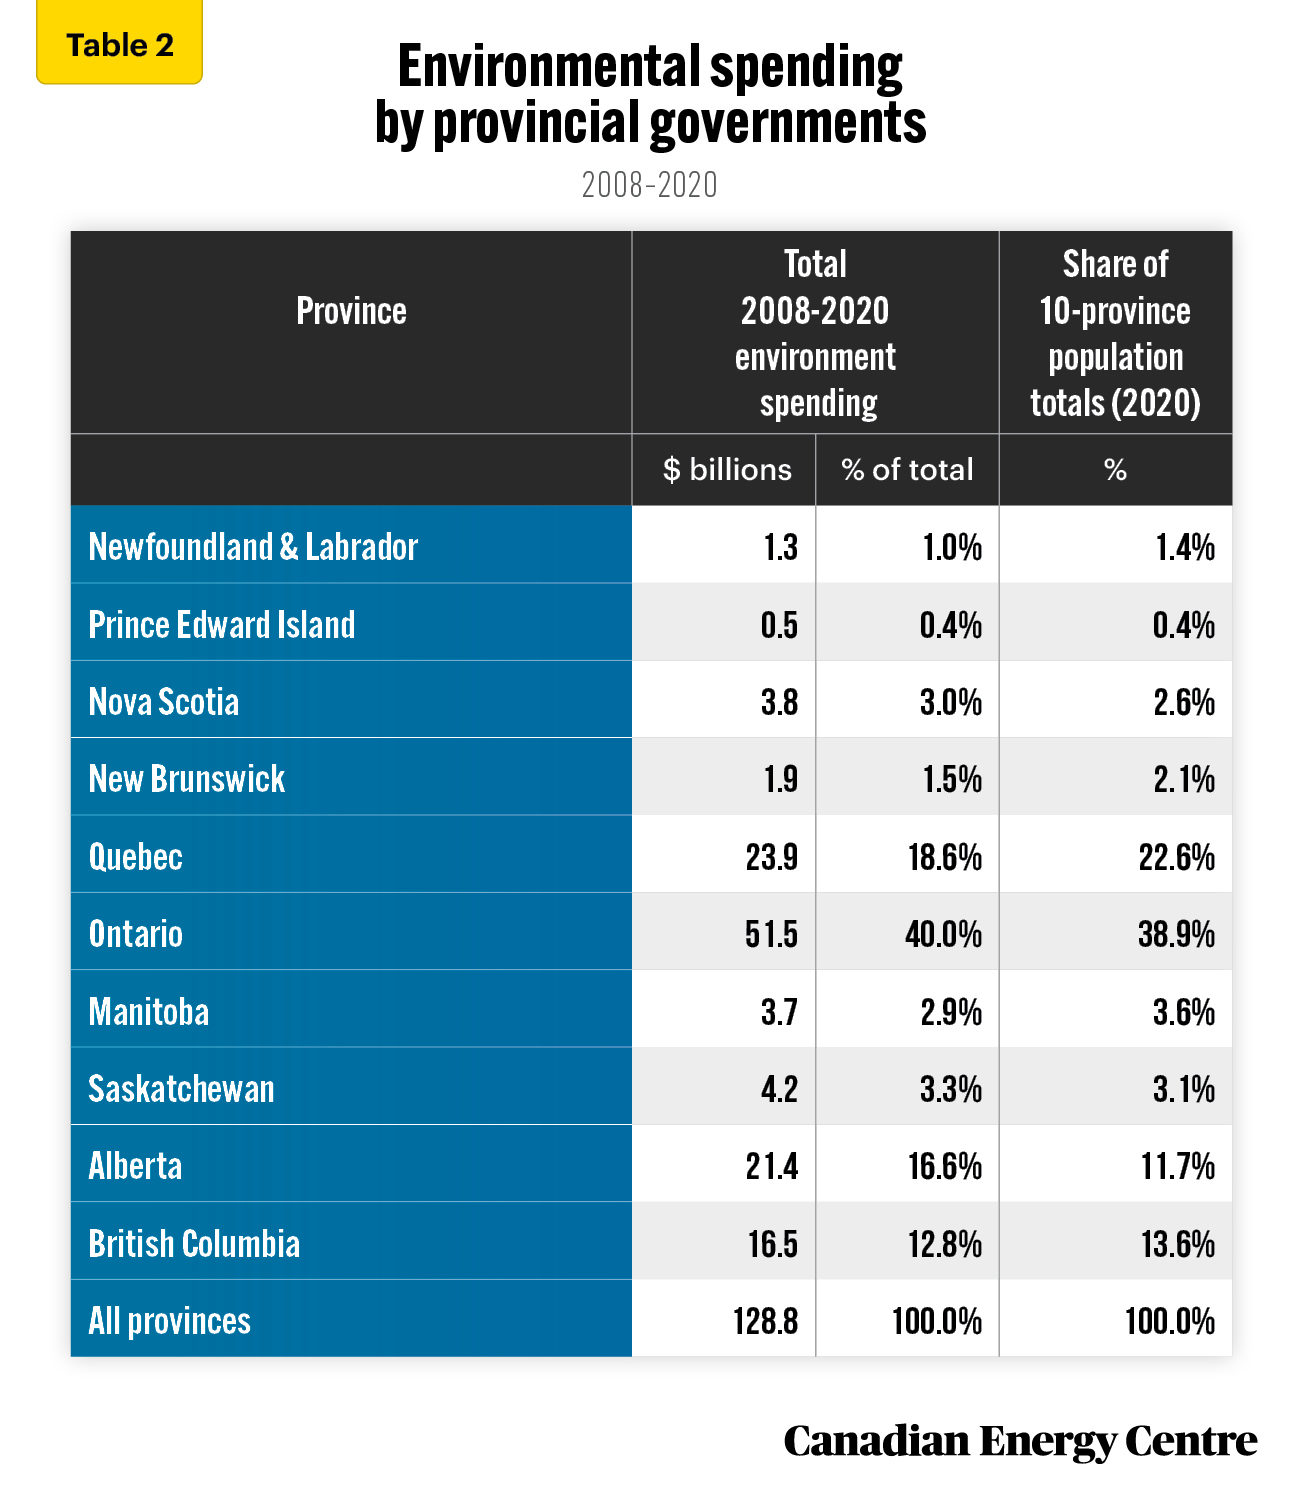
Not only industries but governments spend money on environmental protection. Table 2 shows that total provincial government spending on environmental protection between 2008 and 2020 was nearly $128.8 billion. (The federal government and the territories are excluded from this comparison.) Alberta spent $21.4 billion or 16.6 per cent of all provincial expenditures on the environment, while its proportion of the (10-province) population was 11.7 per cent as of 2020.
- Ontario spent $51.5 billion or 40 per cent of all provincial expenditures, while its proportion of the population was 38.9 per cent as of 2020.
- Nova Scotia and Saskatchewan also spent a higher proportion on the environment relative to their populations.
- Six provinces spent less on the environment than their share of the population: Quebec, British Columbia, Manitoba, New Brunswick, and Newfoundland & Labrador. Quebec’s government incurred just 18.6 per cent of all provincial environmental expenditures between 2008 and 2020, significantly below its 22.6 per cent share of the province’s population in 2020.
Source: Statistics Canada, Tables 10-10-0005-01 and 17-10-0005-01; and authors’ calculations
A per capita look at provincial spending on the environment
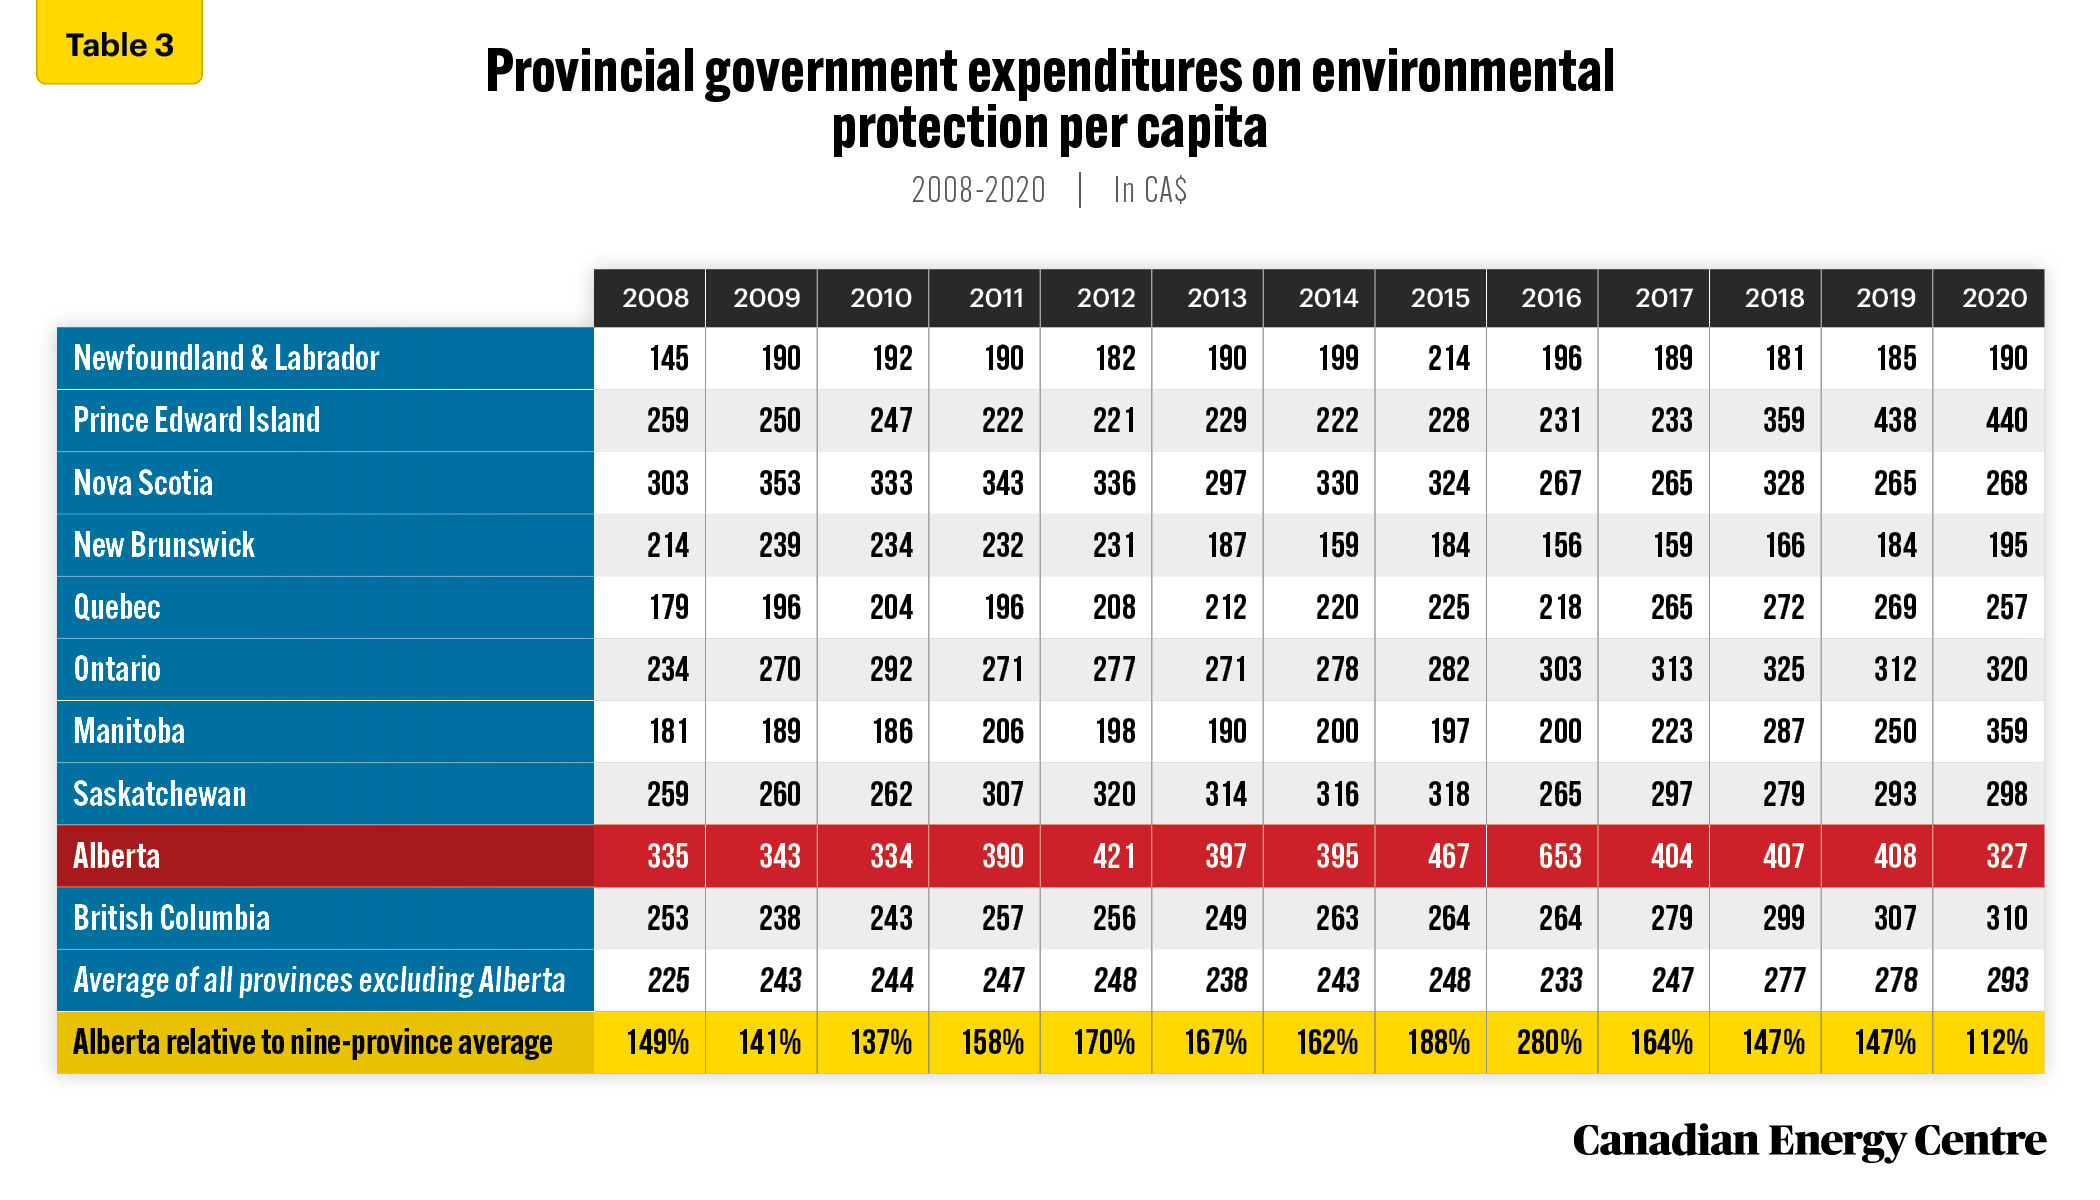
Table 3 lists all provincial spending on environmental protection between 2008 and 2020 inclusive.
Of note:
- Alberta spent more per capita on environmental protection than any other province in 2020, except for Manitoba and Prince Edward Island.
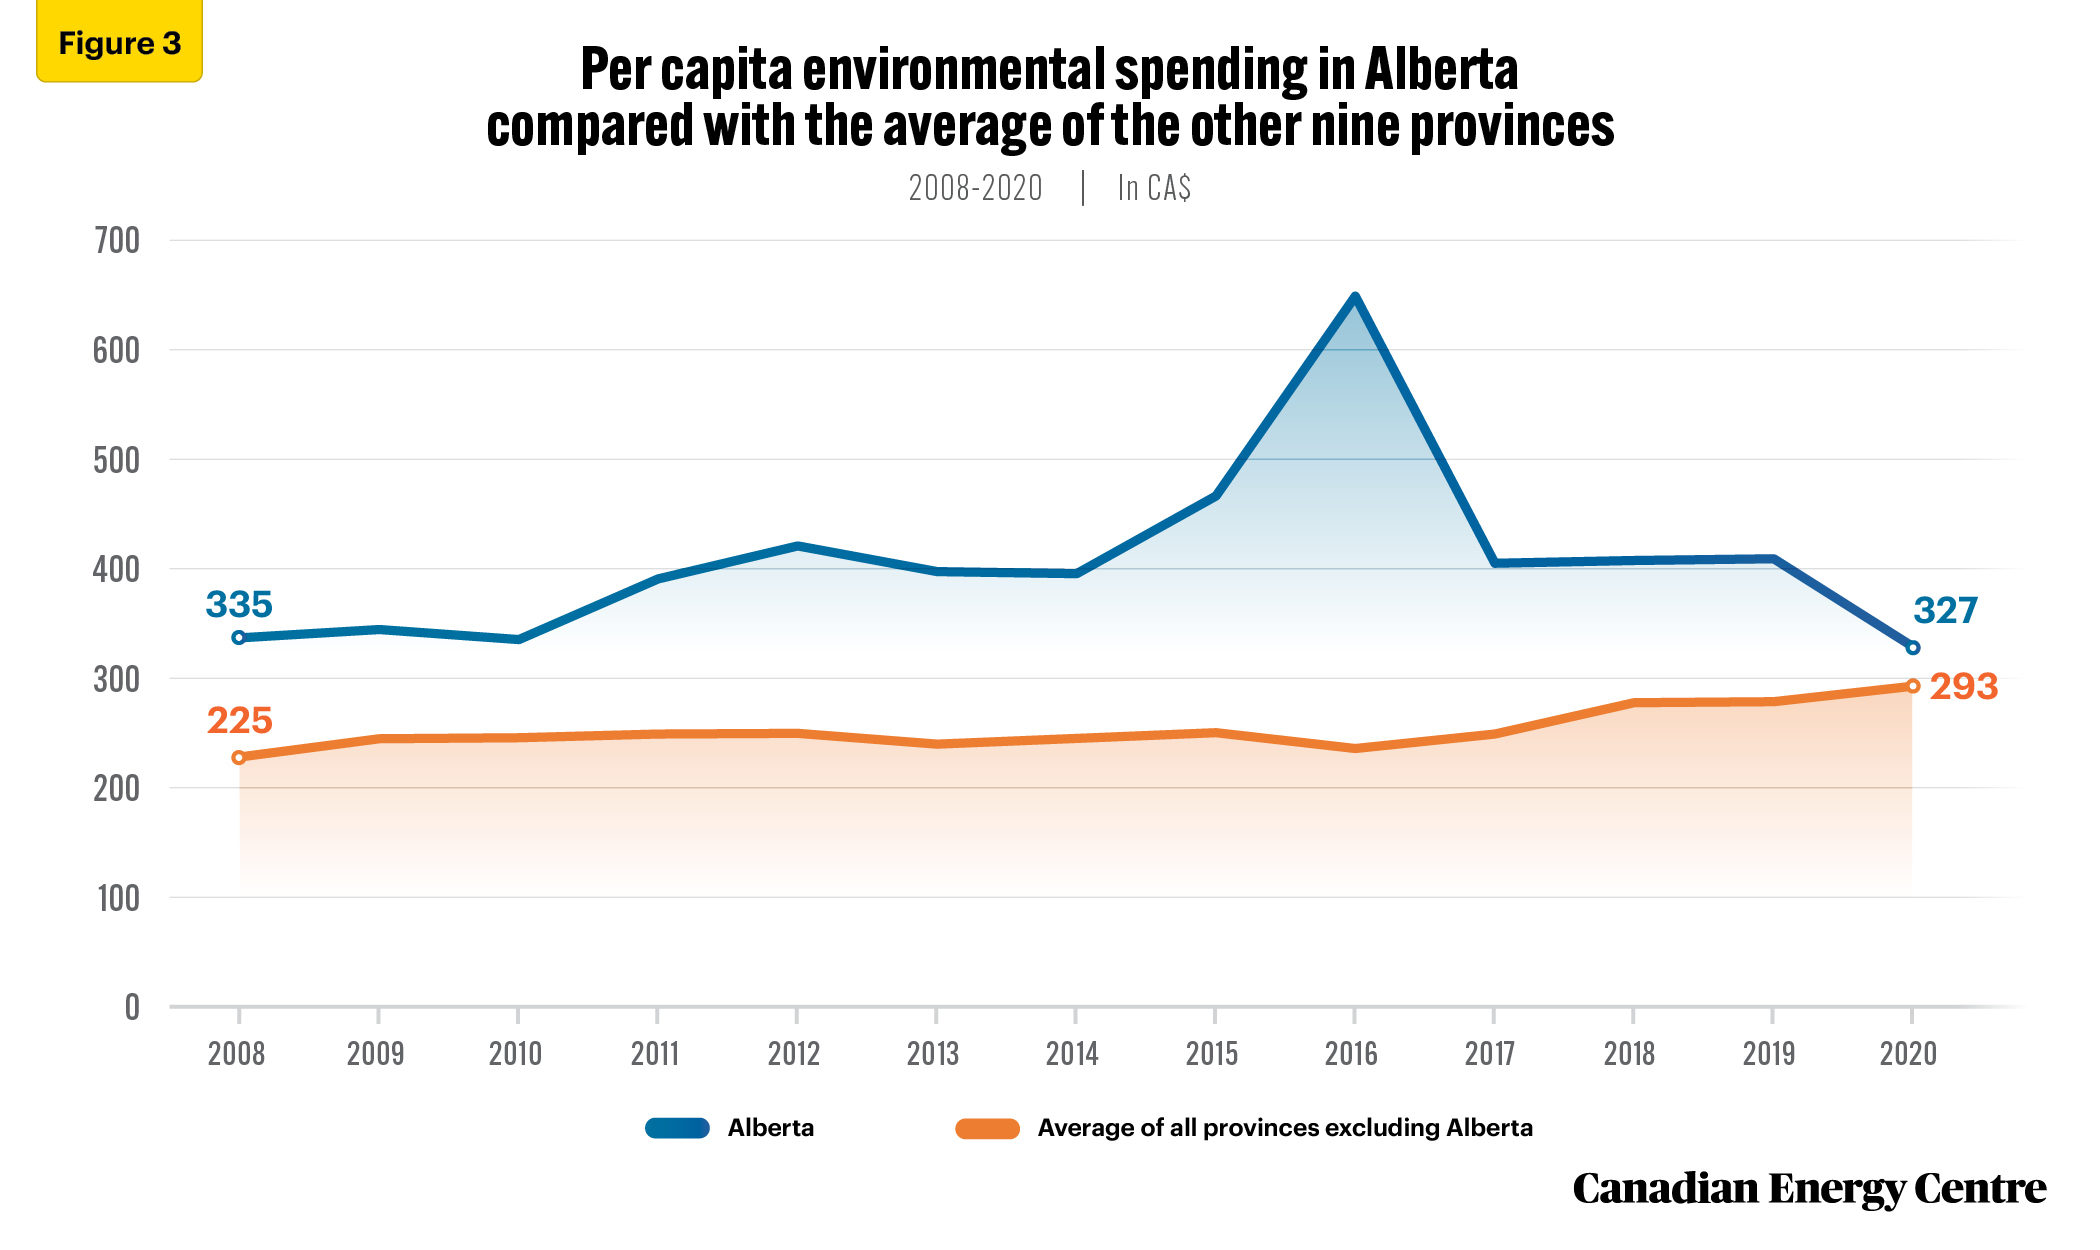
- When the annual average of the other nine provinces is compared, Alberta spent substantially more than the annual average of the other provinces on environmental protection every year.
Source: Statistics Canada, Tables 10-10-0005-01 and 17-10-0005-01.
Table 3 and Figure 3 also show the following:
• In 2020, Alberta’s spending on the environment at $327 per capita was 102 per cent of the amount spent by Ontario ($320); 105 per cent of that spent by British Columbia ($310); 112 per cent of the nine-province average ($293); and 127 per cent of what Quebec spent ($257).⁴
4. The spike in environmental spending in Alberta in 2016 was due to $1.1 billion in new spending from the province’s Climate Leadership Plan (Statistics Canada 2018.)
Source: Statistics Canada, Tables 10-10-0005-01 and 17-10-0005-01; and authors’ calculations.
Conclusion: Environmental spending highest by oil and gas industry, and highest by Alberta
In 2018 and 2019, the oil and gas sector spent $6.6 billion, or 34 per cent, of the amount spent by businesses on environmental protection.
Historically, when measured as a proportion of the $67.6 billion in all-industry spending on environmental protection between 2006 and 2018, not including years where there were “gaps” in Statistics Canada data, Canada’s oil and gas sector spent $28.1 billion, or 41 per cent. All other industries in Canada were responsible for $39.6 billion or 59 per cent of such spending.
When provincial government spending is examined using data available from 2008 to 2020, Alberta spent significantly more than its share of Canada’s population ($21.4 billion or 16.6 per cent of all provincial spending with a population at 11.7 per cent of provincial totals). This is also true of per capita spending: Alberta’s spending on environmental protection was significantly higher than the average of the other nine provinces for the entire 2008- 2020 period.
Notes
This CEC Fact Sheet was compiled by Ven Venkatachalam and Lennie Kaplan at the Canadian Energy Centre: www.canadianenergycentre.ca. The authors and the Canadian Energy Centre would like to thank and acknowledge the assistance of two anonymous reviewers in reviewing the data and research for this Fact Sheet. All percentages in this report are calculated from the original data, which can run to multiple decimal points. They are not calculated using the rounded figures that may appear in charts and in the text, which are more reader friendly. Thus, calculations made from the rounded figures (and not the more precise source data) will differ from the more statistically precise percentages we arrive at using source data.
References (all links live as of Sept 5, 2022)
Statistics Canada (2022), Table 38-10-0130-01 <https://bit.ly/3OERIKi>; Table 10-10-0005-01 <https://bit.ly/2ZEkp2W>; and Table 17-10-0005-01 <https://bit.ly/3d03wV5>; Statistics Canada (2018), Government Expenditures in Alberta: A presentation to deputy ministers in Alberta by Anil Arora (February 12) <https://bit.ly/3svYAyP>; Statistics Canada (2020), Table 38-10-0042-01 <https://bit.ly/2Y65iQi>.
Creative Commons Copyright
Research and data from the Canadian Energy Centre (CEC) is available for public usage under creative commons copyright terms with attribution to the CEC. Attribution and specific restrictions on usage including non-commercial use only and no changes to material should follow guidelines enunciated by Creative Commons here: Attribution-NonCommercial-NoDerivs CC BY-NC-ND.