
To sign up to receive the latest Canadian Energy Centre research to your inbox email: [email protected]
Download the PDF here
Download the charts here
Overview
Fluctuations in the value of Canadian energy exports affect many macroeconomic variables in the Canadian economy, including jobs, GDP, and labour income. An increase in the production and export of oil and gas products boosts Canada’s economic performance and federal and provincial government revenues. Studies have shown that exports have a positive impact on economic growth.
A significant portion of Canada’s merchandise export trade each year comes from the export of energy products and, in particular, oil and natural gas products.¹ Oil and gas exports as a proportion of all energy exports have grown over the past three decades. Oil and gas exports accounted for 60 per cent of all energy exports in 1988, rising to 79 per cent in 2000, and reaching 82 per cent in 2019. In 2020, for example, Canada exported $63.8 billion worth of crude oil and $8.9 billion in natural gas.
This CEC Fact Sheet explores the impact of a crude oil and natural gas export surge on the Canadian economy. Using Statistics Canada’s National Input/Output model (I/O model), we simulate an increase of $100 million in crude oil and natural gas exports, showing the direct and indirect impacts on employment, GDP, output, and labour income. Strong growth in oil and gas exports since the COVID-19-induced recession demonstrates the benefits of crude oil and natural gas exports to the Canadian economy.
1. Energy products are composed broadly of crude oil, crude bitumen, natural gas, natural gas liquids and related products, coal, nuclear fuel and other energy products, electricity (including hydro, wind, and solar), and refined petroleum energy products. Oil and natural gas products are composed specifically of crude oil, crude bitumen, natural gas, and natural gas liquids, and related products.
Export value of Canadian crude oil and natural gas products: Over $1.9 trillion between 1988 and 2019
The cumulative real value of Canada’s crude oil and natural gas product exports was over $1.94 trillion between 1988 and 2019 (see Figure 1).
- Since 1988, the value of Canada’s crude oil and natural gas product exports has been as low as $14 billion (in 1988) and as high as $123.8 billion (in 2014).
- After 2014, crude oil and natural gas exports ranged from a low of $64.9 billion in 2016 to a high of $102.1 billion in 2019.
- Between 1988 and 2019, the real value of Canadian crude oil and natural gas exports increased by nearly 630 per cent.
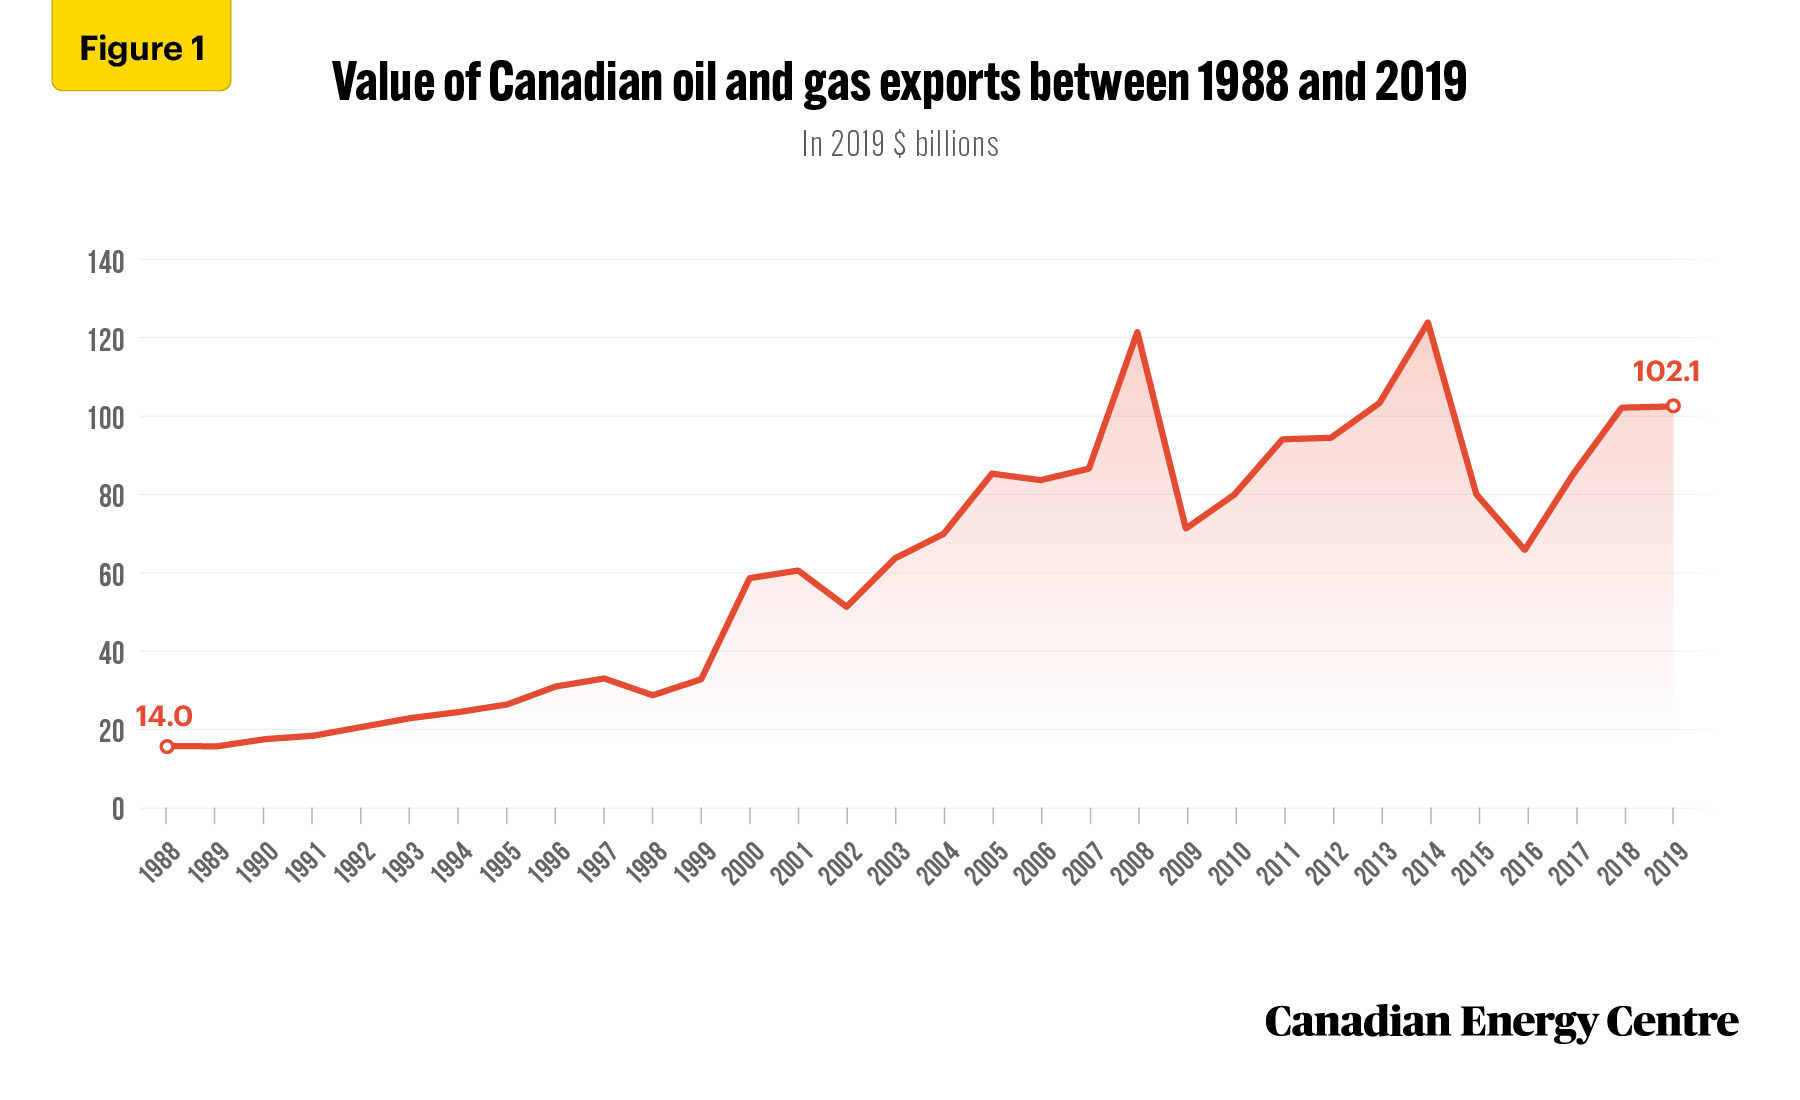
Source: Statistics Canada, Table 12-10-0121-01.
Export value of Canadian crude oil and natural gas during the COVID-19 era
In 2020 and into early 2021, COVID-19 had a devastating impact on Canadian crude oil and natural gas exports. Over the past few months as the global economy has begun to recover from COVID-19, however, the demand for oil and gas has increased. Alberta saw record crude oil production in the first half of 2021, averaging 3.53 million barrels per day. International crude oil exports from Canada have also increased; between July and September 2021, Canada exported $31.9 billion of oil and gas (see Figure 2).
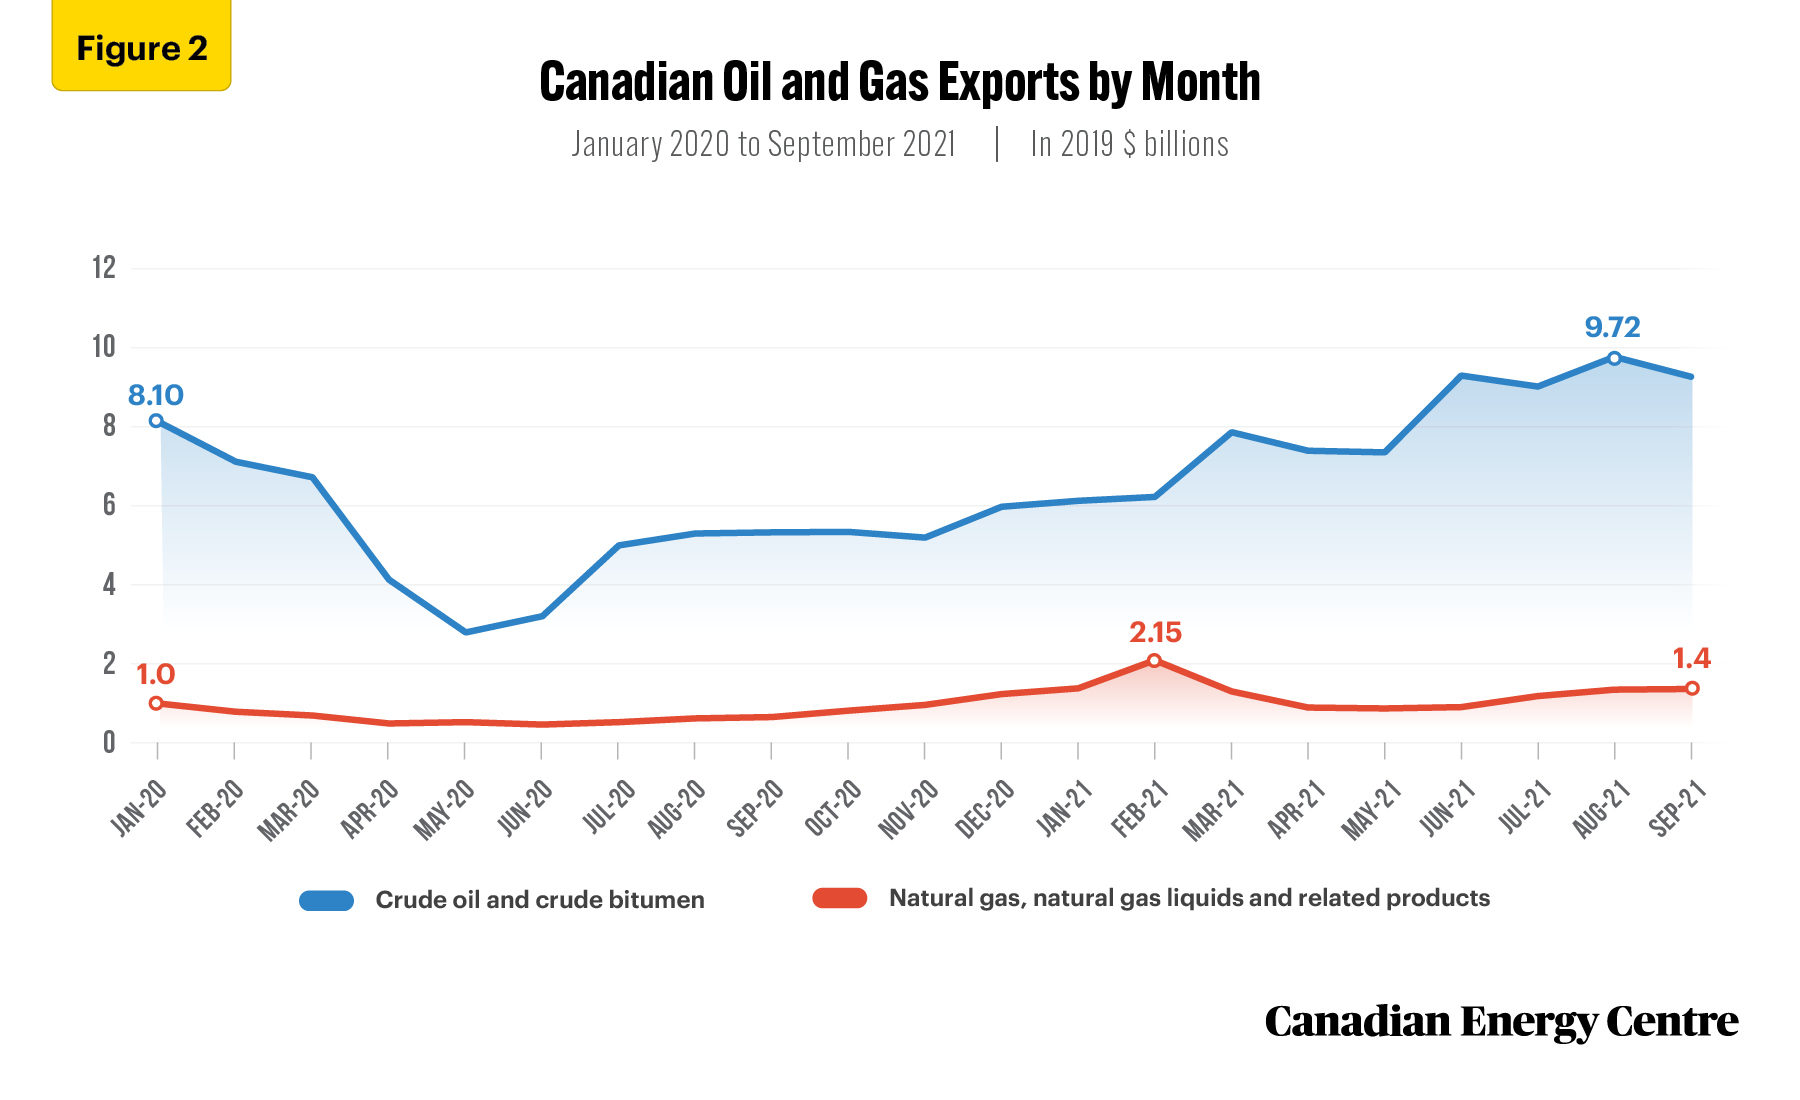
Source: Statistics Canada, Table 12-10-0121-01.
Simulating the impact of a $100 million increase in crude oil and natural gas exports on the Canadian economy in 2022
The impact of the crude oil and natural gas sector on employment, GDP, output, and labour income in Canada is very relevant to current discussions about the role of crude oil and natural gas in Canada’s future.
The estimates presented in this paper are derived from a custom simulation of the Statistics Canada National Input/Output model (I/O National model). The study estimates how the Canadian economy will benefit from a $100 million surge in oil and gas exports.
Table 1 reports on the changes to the Canadian economy from a $100 million surge in crude oil and natural gas exports. The analysis includes the direct impacts of Canadian crude oil and natural gas exports on jobs, nominal GDP, output, and labour income and the indirect effects of such export activities on other sectors in Canada.
Results
- Each $100 million increase in crude oil and natural gas exports is estimated to support 289 direct and indirect Canadian jobs in 2022;
- Each $100 million increase in crude oil and natural gas exports is estimated to add $86 million to nominal GDP in 2022;
- Each $100 million increase in crude oil and natural gas exports is estimated to generate nearly $153 million in outputs in 2022, consisting primarily of the value of goods and services produced; and
- Each $100 million increase in crude oil and natural gas exports is estimated to add $40 million to labour income in 2022.
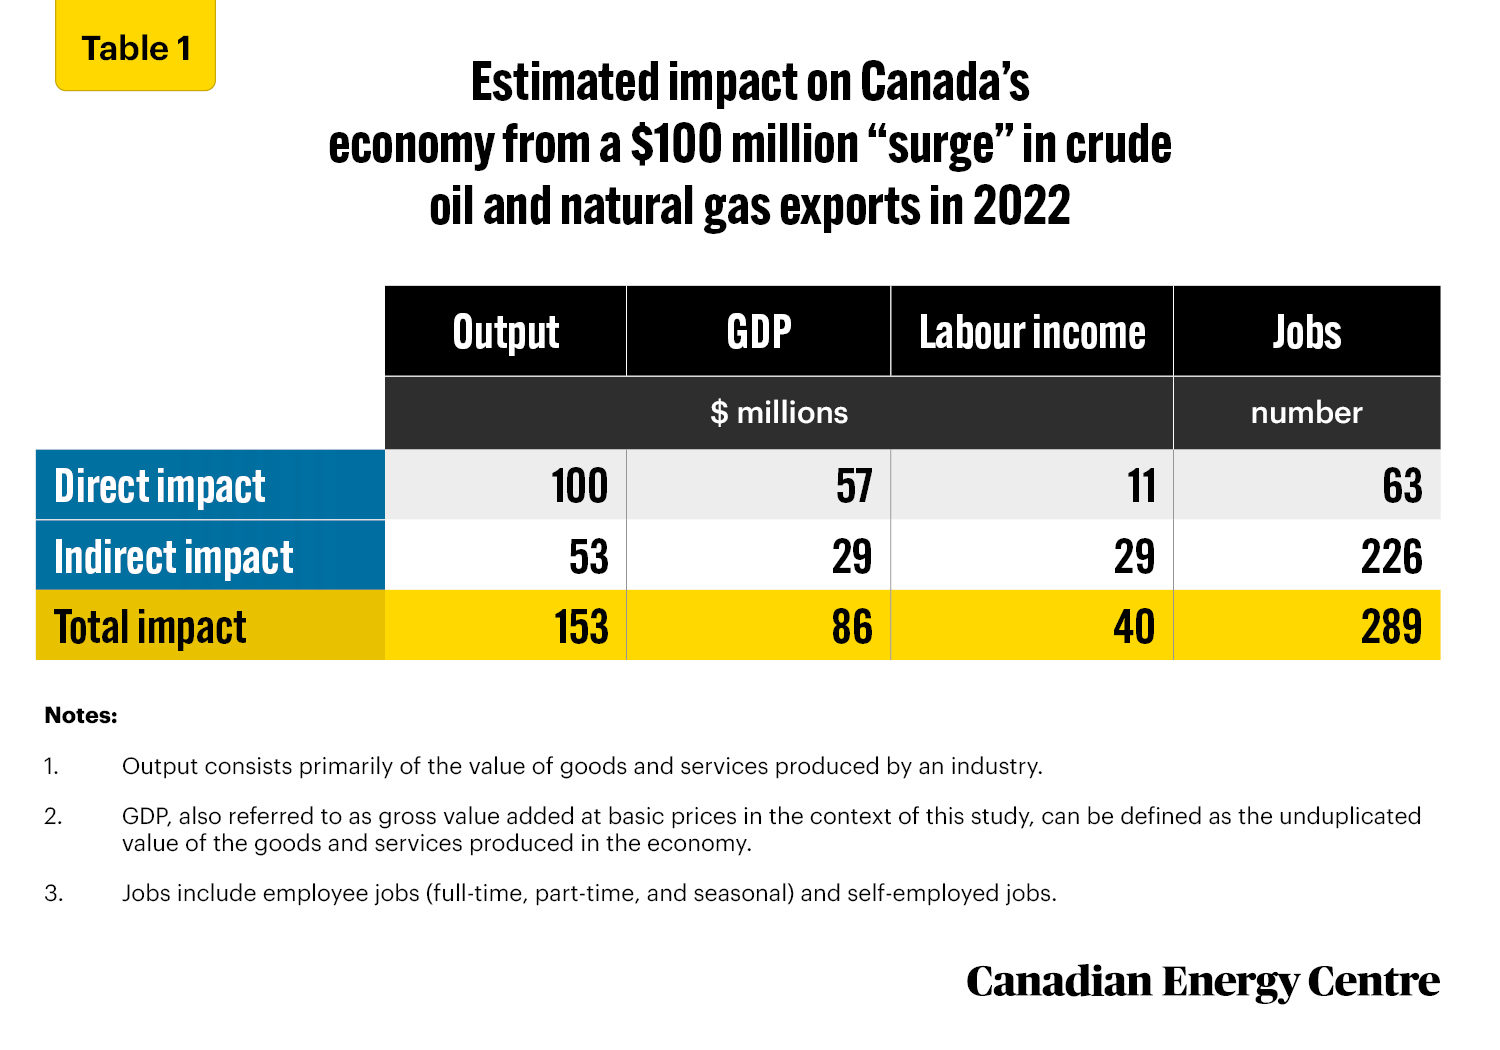
Source: Derived from Statistics Canada (2021), Supply and Use Tables, custom tabulation. Totals may not add due to rounding.
Conclusion
As global demand for crude oil and natural gas picked up after the first wave of COVID-19, Canada’s energy exports increased significantly in 2021 compared to 2020 and will likely continue to grow in 2022.
Given the recent debate about the future role of crude oil and natural gas, it is worth noting that even a marginal increase in crude oil and natural gas exports will have a significant positive impact on Canada’s national economy.
Each $100 million increase in Canadian oil and natural gas exports is estimated to add $86 million to the country’s nominal GDP and create 289 jobs in 2022.
Appendix: Methodology, Assumptions, and Definitions
Methodology
There are several ways to estimate the impact of increased oil and gas exports on the Canadian economy. This type of analysis can be done using the Input/Output model (I/O model) or some form of Computational General Equilibrium (CGE) model. Over the past number of years, there has been some debate about the strengths and weaknesses of I/O models in assessing the contribution of industry sectors to the Canadian economy.²
For background on Statistics Canada and its I/O model that we used to arrive at the estimates in this CEC Fact Sheet, we refer to extracts from the following papers by Statistics Canada. From Statistics Canada, Supply, Use and Input-Output Tables, 2020:
Input/output (I/O) models are generally used to simulate the economic impacts of the output of one or several industries. The I/O tables allow the analyst to explore “what if?” questions at a detailed level, exploring the impact of changes in final demand on output while taking account of the interdependencies between different industries and regions of the economy and the leakages to imports and taxes. For example, such models might be used to study the question: “If Canadian oil and gas exports doubled, what industries would be most affected and in which provinces?”
The estimates presented in this paper are derived from a custom simulation of the Statistics Canada National InputOutput model (I/O National model). The study estimates how the Canadian economy will benefit from a $100 million “surge” in oil and gas exports. The I/O National model can capture the extent to which an increase in oil and gas sector exports will benefit Canada’s economy.
Increased crude oil and natural gas exports change the final demand for oil and gas, driving demand for products and services in other sectors. The interrelationship between industries in the economy is captured in the I/O model. The I/O model uses the economic relationship between sectors to satisfy the increased crude oil and natural gas export demand by increasing demand for related non-oil and gas sectors.
The I/O model is constructed from Supply and Use Tables (SUTs). The SUTs capture and present the production of products by domestic industries, imports of products, and their use, either as inputs, final consumption, investment, or exports. The SUTs are from the 2017 calendar year.
2. For an in-depth discussion and comparison between the I/O model and the CGE model, refer to G. Kent Fellows and Jennifer Winter (2018), Getting to Know Models: A Primer and Critique on Input-Output and Computable General Equilibrium Models and Their Uses for Policy and Project Analysis.
Assumptions
A few assumptions are made in running the I/O model. We assume no supply constraints, no relative price effect, and a fixed proportion of technology in production. The model assumes a short-run time horizon, and the economy is in equilibrium during that short period.
To run the I/O model, a forecast for oil and gas prices is required. The study assumes a West Texas Intermediate (WTI) crude oil price of $69.00 per barrel, a Western Canada Select (WCS) oil price of $43.00 per barrel, and a natural gas price of $4.20 per MMBtu for 2022. The model uses estimated 2022 production and investment values based on the 2017 SUTs.
Using these inputs, Statistics Canada performed a custom simulation for the Canadian Energy Centre (CEC) to study the impact of a $100 million surge in crude oil and natural gas exports on the Canadian economy in 2022.
Definitions
We define the broad Canadian oil and gas sector as the sum of oil and gas extraction (NAICS 211) and oil and gas investment. Oil and gas extraction comprises establishments primarily engaged in operating oil and gas field properties. Such activities may include exploration for crude petroleum and natural gas; drilling, completing, and equipping wells; operating separators, emulsion breakers, desilting equipment, and field gathering lines for crude petroleum; and all other activities in the preparation of oil and gas up to the point of shipment from the producing property. This subsector includes the production of oil, the mining and extraction of oil from oil shale and oil sands, and the production of gas and hydrocarbon liquids, through gasification, liquefaction, and pyrolysis of coal at the mine site. Oil and gas investment includes capital expenditures on construction, machinery and equipment, and exploration by the oil and gas extraction industry. GDP is defined as the unduplicated value of the goods and services produced in the economy. Output consists primarily of the value of goods and services produced by an industry. Jobs include employee jobs (full-time, part-time, and seasonal) and self-employed jobs. Direct impact of oil and gas extraction is the effects directly attributed to this industry’s production. The direct impact of oil and gas investment is the deliveries by domestic industries to satisfy capital expenditures by the oil and gas extraction industry. Indirect impact covers upstream economic activities associated with supplying intermediate inputs (the current expenditures on goods and services used up in the production process) to the directly affected industries.
Notes
This CEC Fact Sheet was compiled by Ven Venkatachalam, Chief Research Analyst, and Lennie Kaplan, Executive Director, Research, at the Canadian Energy Centre (www.canadianenergycentre.ca). All percentages in this report are calculated from the original data, which can run to multiple decimal points. They are not calculated using the rounded figures that may appear in charts and in the text, which are more reader friendly. Thus, calculations made from the rounded figures (and not the more precise source data) will differ from the more statistically precise percentages we arrive at using source data. The authors and the Canadian Energy Centre would like to thank and acknowledge the assistance of Philip Cross and an anonymous reviewer in reviewing the data and research for the initial edition of this Fact Sheet. Image credits: Christian Pauschert.
References (all links live as of December 23, 2021)
ATB Economics (October 18, 2021), Oil production in Alberta higher than ever <https://bit.ly/3mRmJzF>; Athanasia S. Kalaitzi and Trevor W. Chamberlain (2020), Merchandise exports and economic growth: multivariate time series analysis for the United Arab Emirates, Journal of Applied Economics 23, 1: 163-182 <https://bit.ly/3DIosxA>; CAPP (undated), Oil Sands and Canada’s Economy <https://bit.ly/3CHXPaw>; Financial Post (August 24, 2021), Business Cycle Council declares end of COVID-19 recession, says recovery is ongoing <https://bit.ly/3kZhwEU>; G. Kent Fellows and Jennifer Winter (2018), Getting to Know Models: A Primer and Critique on Input-Output and Computable General Equilibrium Models and Their Uses for Policy and Project Analysis, University of Calgary, School of Public Policy <https://bit.ly/3mQ9jSY>; Lennie Kaplan and Mark Milke (2020), 701 Billion: The Energy Sector’s Revenues to Canadian Governments 2000–2019, Canadian Energy Centre <https://bit.ly/3cCu14F>; Lennie Kaplan and Mark Milke (2020), Over $1.9 Trillion: The Value of Canada’s Oil and Gas Exports, 1988 to 2019, Canadian Energy Centre <https://bit.ly/3nF7Ykc>; Lennie Kaplan and Mark Milke (2020), Jobs and GDP: The Oil and Gas Sector’s Contribution to Canada’s Economy in a “Slump” Year, Canadian Energy Centre <https://bit.ly/3cKisZc>; Statistics Canada (2018), National and Provincial Multipliers, Surveys and statistical programs, Documentation: 15F0046X <https://bit.ly/32L4L8q>; Statistics Canada (2019), Supply, Use and Input-Output Tables <https://bit.ly/3kWU8aY>; Statistics Canada (2020), Workshop: Statistics Canada Supply-Use Framework, The Use Table, March 9-10, 2020; Statistics Canada (2021a), Table 12-10-0121-01: International merchandise trade by commodity, monthly <https://bit.ly/3xbpXSo>; Statistics Canada (undated), Input Output Model Simulations (National Model), custom tabulation <https://bit.ly/3xfSI0f>.
Creative Commons Copyright
Research and data from the Canadian Energy Centre (CEC) is available for public usage under creative commons copyright terms with attribution to the CEC. Attribution and specific restrictions on usage including non-commercial use only and no changes to material should follow guidelines enunciated by Creative Commons here: Attribution-NonCommercial-NoDerivs CC BY-NC-ND.