
To sign up to receive the latest Canadian Energy Centre research to your inbox email [email protected]
Overview
The broad oil and gas sector¹ has been and continues to be a significant contributor to Canada’s economy. Compared to the narrower direct oil and gas extraction sector, which comprised about 2.2 per cent of GDP in 2016, the broad oil and gas sector includes both the direct and indirect impacts of oil and gas extraction and oil and gas investment on the economy. Even with the energy price decrease as of 2016, the broad energy sector’s contribution (direct and indirect) amounted to 5.4 per cent to Canada’s total GDP.
The impact of the broad oil and gas sector on GDP, jobs, and output (the production of goods and services) on key sectors of the Canadian economy is not well-known outside that sector and regions and provinces where such resource activity occurs, but is relevant to current discussions about the oil and gas sector’s importance to Canada’s future.
In this Fact Sheet (which can be downloaded here as a pdf), we examine the impact that the broad oil and gas sector had on the Canadian economy in 2016, a “slump” year following two years of decline due to lower oil prices that began in 2014.²
Statistics Canada terminology
At the outset it would be useful to explain some of the Statistics Canada terminology used to assess the economic contribution of the broad oil and gas sector in this Fact Sheet.³
- The broad Canadian oil and gas sector is defined as the sum of oil and gas extraction and oil and gas investment;
- Oil and gas extraction comprise establishments primarily engaged in operating oil and gas field properties;
- Oil and gas investment include capital expenditures on construction, machinery and equipment and exploration by the oil and gas extraction industry;
- GDP is defined as the unduplicated value of the goods and services produced in the economy;
- Output consists primarily of the value of goods and services produced by an industry;
- Jobs include employee jobs (full-time, part-time and seasonal) and self-employed jobs;
- The direct impact of oil and gas extraction are effects directly attributed to the industry’s production. The direct impact of the oil and gas investment are the deliveries by domestic industries to satisfy capital expenditures by the oil and gas extraction industry. Indirect impacts cover upstream economic activities associated with supplying intermediate inputs (the current expenditures on goods and services used up in the production process) to the directly impacted industries.
2016 as a “slump” year
The year 2016 is chosen as an example of a low or “slump” year due to two years of oil and natural gas price declines and due to Statistics Canada Supply and Use data availability. The Supply and Use tables provide a detailed accounting of the Canadian economy. Information is provided by industry, products, provinces, sectors, and components of final use.
The analysis presented here includes not only the direct impact that the oil and gas sector has on the overall Canadian economy in terms of nominal GDP, jobs and output, but also the indirect impact that such activities have on other key Canadian industries. The most recent data availability for the latter measurement (indirect impact that oil and gas activities have on other key Canadian industries) is 2016.
In short, as the data show, despite the severe decline in the prices received for oil and natural gas between 2014 and 2016 and the resulting decline in economic activity, Canada’s oil and gas sector’s direct and indirect share of GDP at 5.4 per cent in 2016 still produced the following effects on Canada’s economy.
1. See ‘definitions’ at the end of the Fact Sheet for what is included in this sectoral measurement.
2. Measured as a monthly average, in 2014, Western Canada Select ranged from a high of U.S.$ 86.56 per barrel (in June) to a low of $43.24 (in December). The price continued to decline and in
2016, reached a low of $16.30 in February with a high of $37.18 in December. Natural gas prices (in Canadian dollars) ranged from a high in 2014 of $5.20 per gigajoule (in February) to a low of
$3.39 (in December). In 2016, the range was from $.94 (in May) to $2.75 (in December).
3. Extracts taken from Statistics Canada, Contribution of the Oil and Gas Sector to the Canadian Economy in 2016, 2020, Custom Tabulation.
Top line impacts
The Canadian oil and gas sector has both direct and indirect impacts on the national and provincial economies, including GDP, jobs and output generated in other key industries across Canada.
GDP and Output
In 2016, the GDP associated with the Canadian oil and gas sector totalled $101.9 billion, or 5.4 per cent of the total Canadian economy. In 2016, the output, or value of goods and services produced by the Canadian oil and gas sector and its supply chain was $209.8 billion, representing about 5.9 per cent of Canada’s total output, (see Table 1).
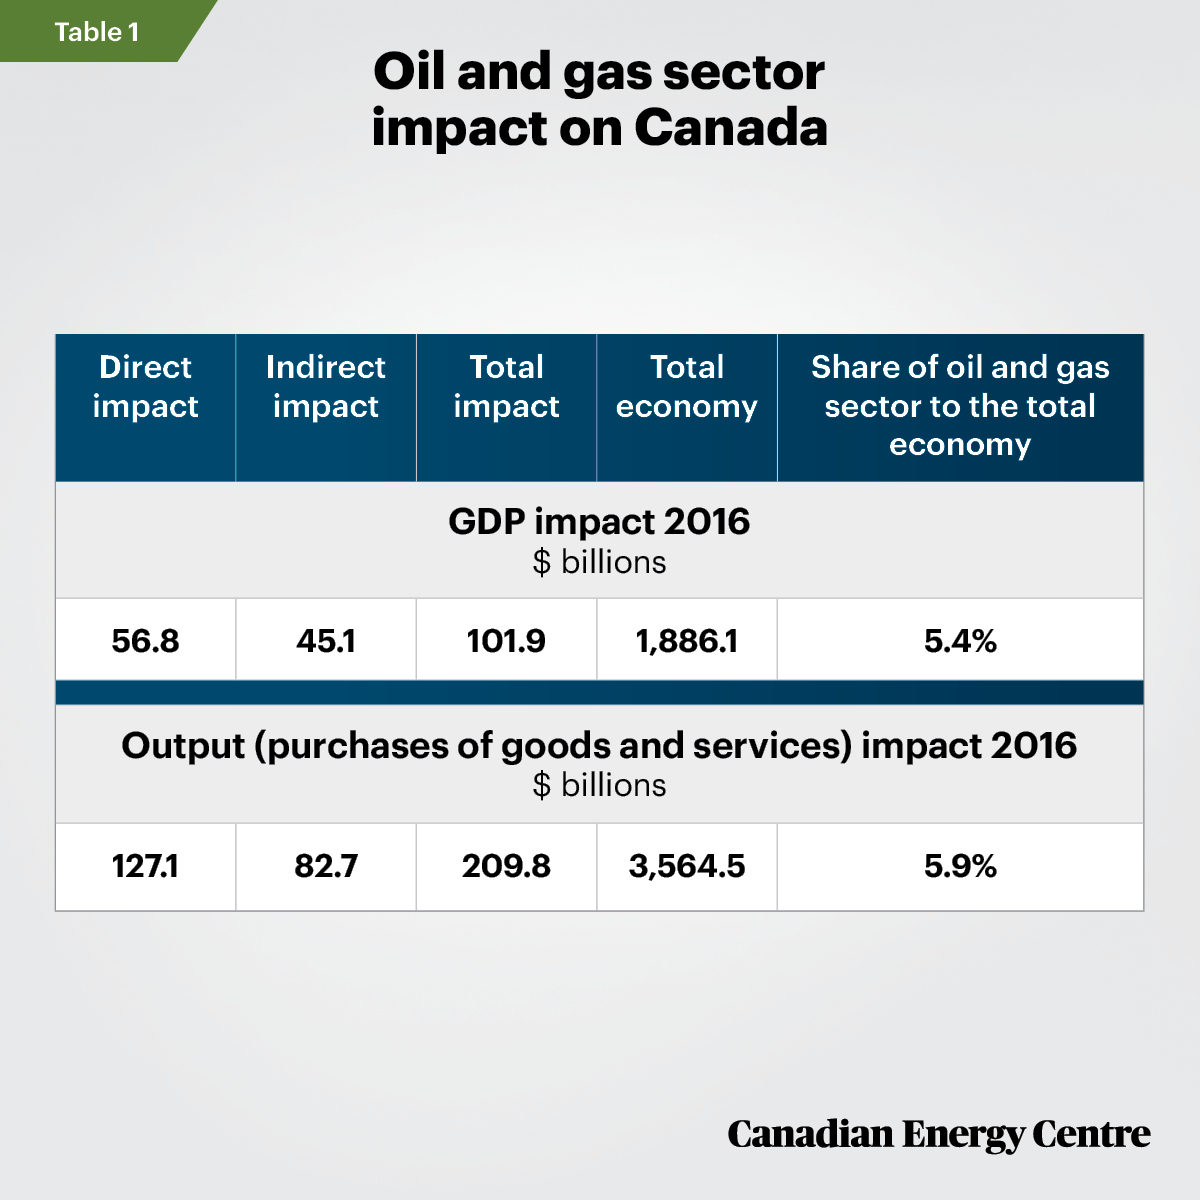
Source: Derived from Statistics Canada Custom Tabulation of the Supply and Use Tables, 2016.
Jobs
In 2016, there were 220,021 direct jobs and 381,371 indirect jobs associated with the Canadian oil and gas sector, or 603,392 in total, representing 3.3 per cent of all jobs across Canada (see Table 2). In 2016, total wages and salaries paid directly to oil and gas sector workers and to those employed indirectly due to oil and sector activities amounted to over $10.4 billion.
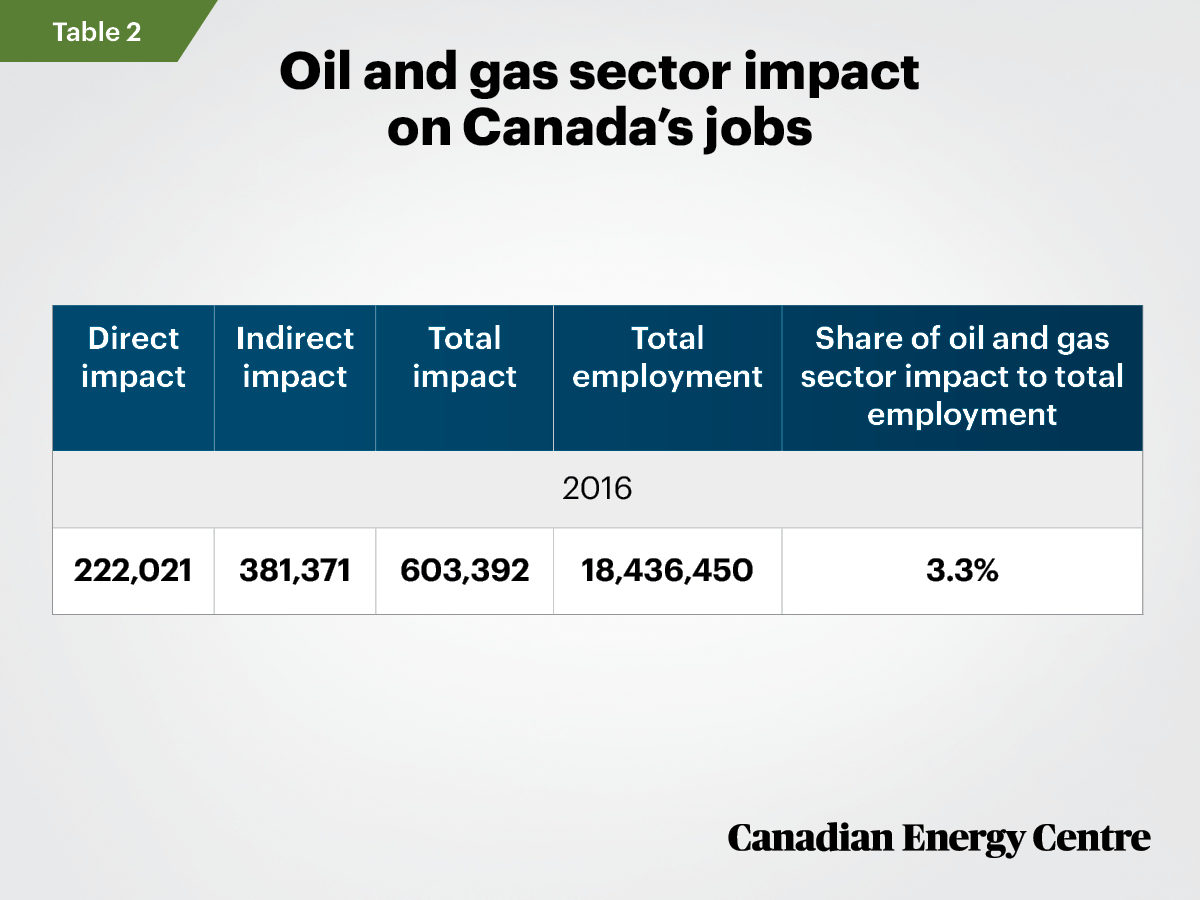
Source: Derived from Statistics Canada Custom Tabulation of the Supply and Use Tables, 2016.
A detailed breakdown: The oil and gas sector’s impact on key sectors of the Canadian economy GDP
The activities of the Canadian oil and gas sector are responsible for significant portions of GDP in key industries across Canada. They range from approximately $490 million in GDP in the Statistics Canada (NAICS⁴) sector for the manufacturing of agriculture, construction, and mining machinery, or 15.9 per cent of that sector’s GDP, to $3.9 billion, or 16.9 per cent of GDP for architectural engineering and related services (see Table 3).
4. North American Industry Classification System.
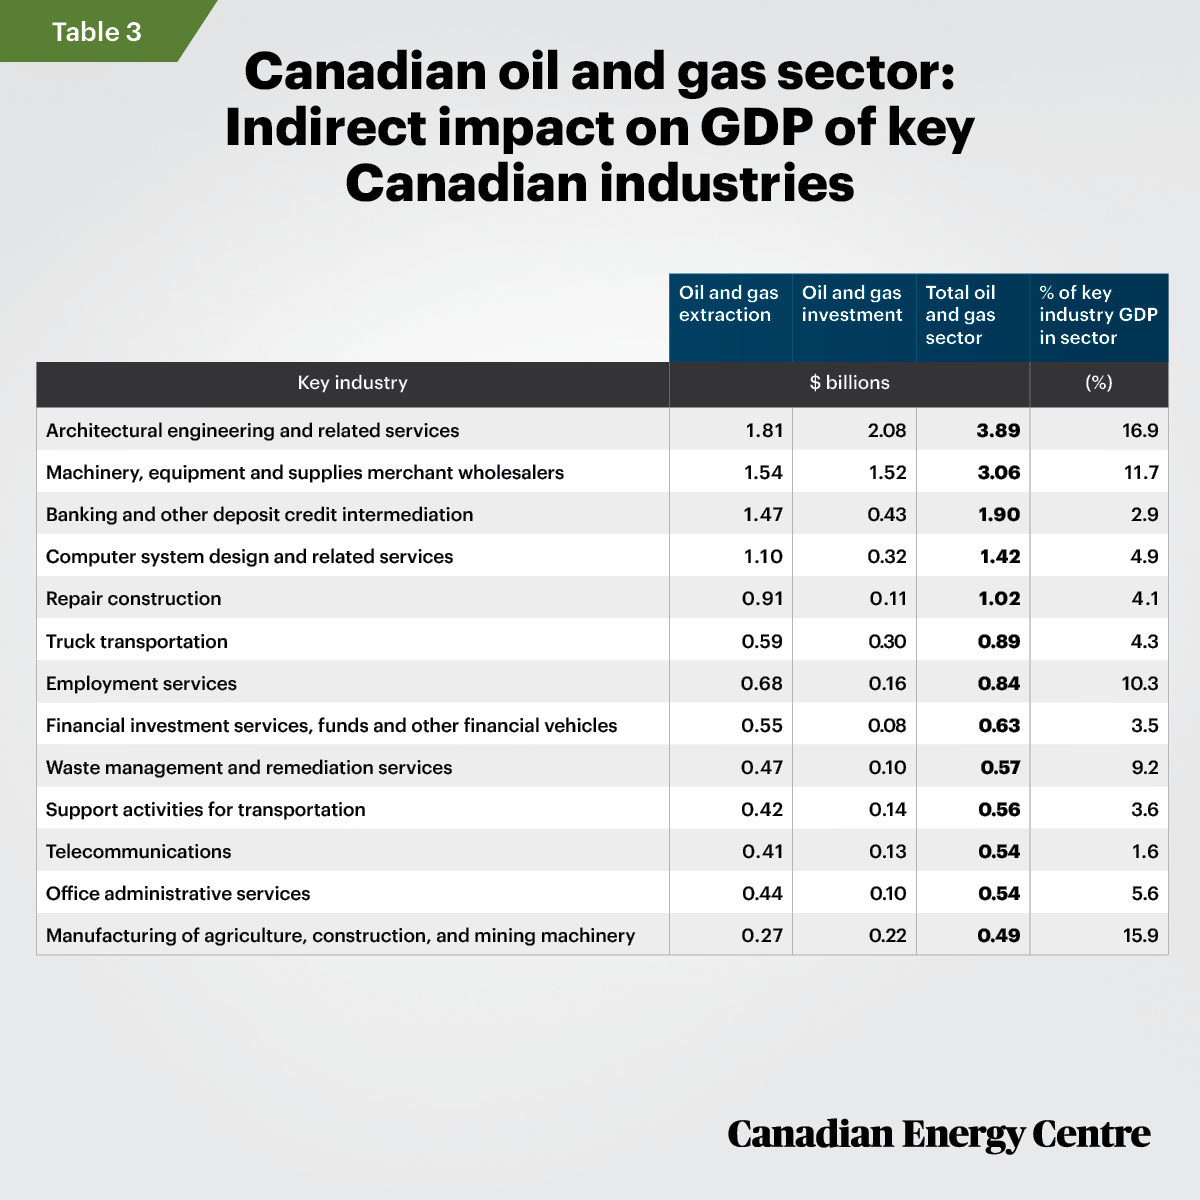
Source: Derived from Statistics Canada Custom Tabulation of the Supply and Use Tables, 2016.
Output (value of goods and services produced)
The oil and gas industry and its supply chain purchases ranged from $120 million worth of goods and services from the sector categorized as general merchandise stores, or 0.8 per cent of that sector’s total output, to over $6.2 billion of goods and services related to the architecture engineering and related services sector, or 17.5 per cent of that industry’s total output (see Table 4).
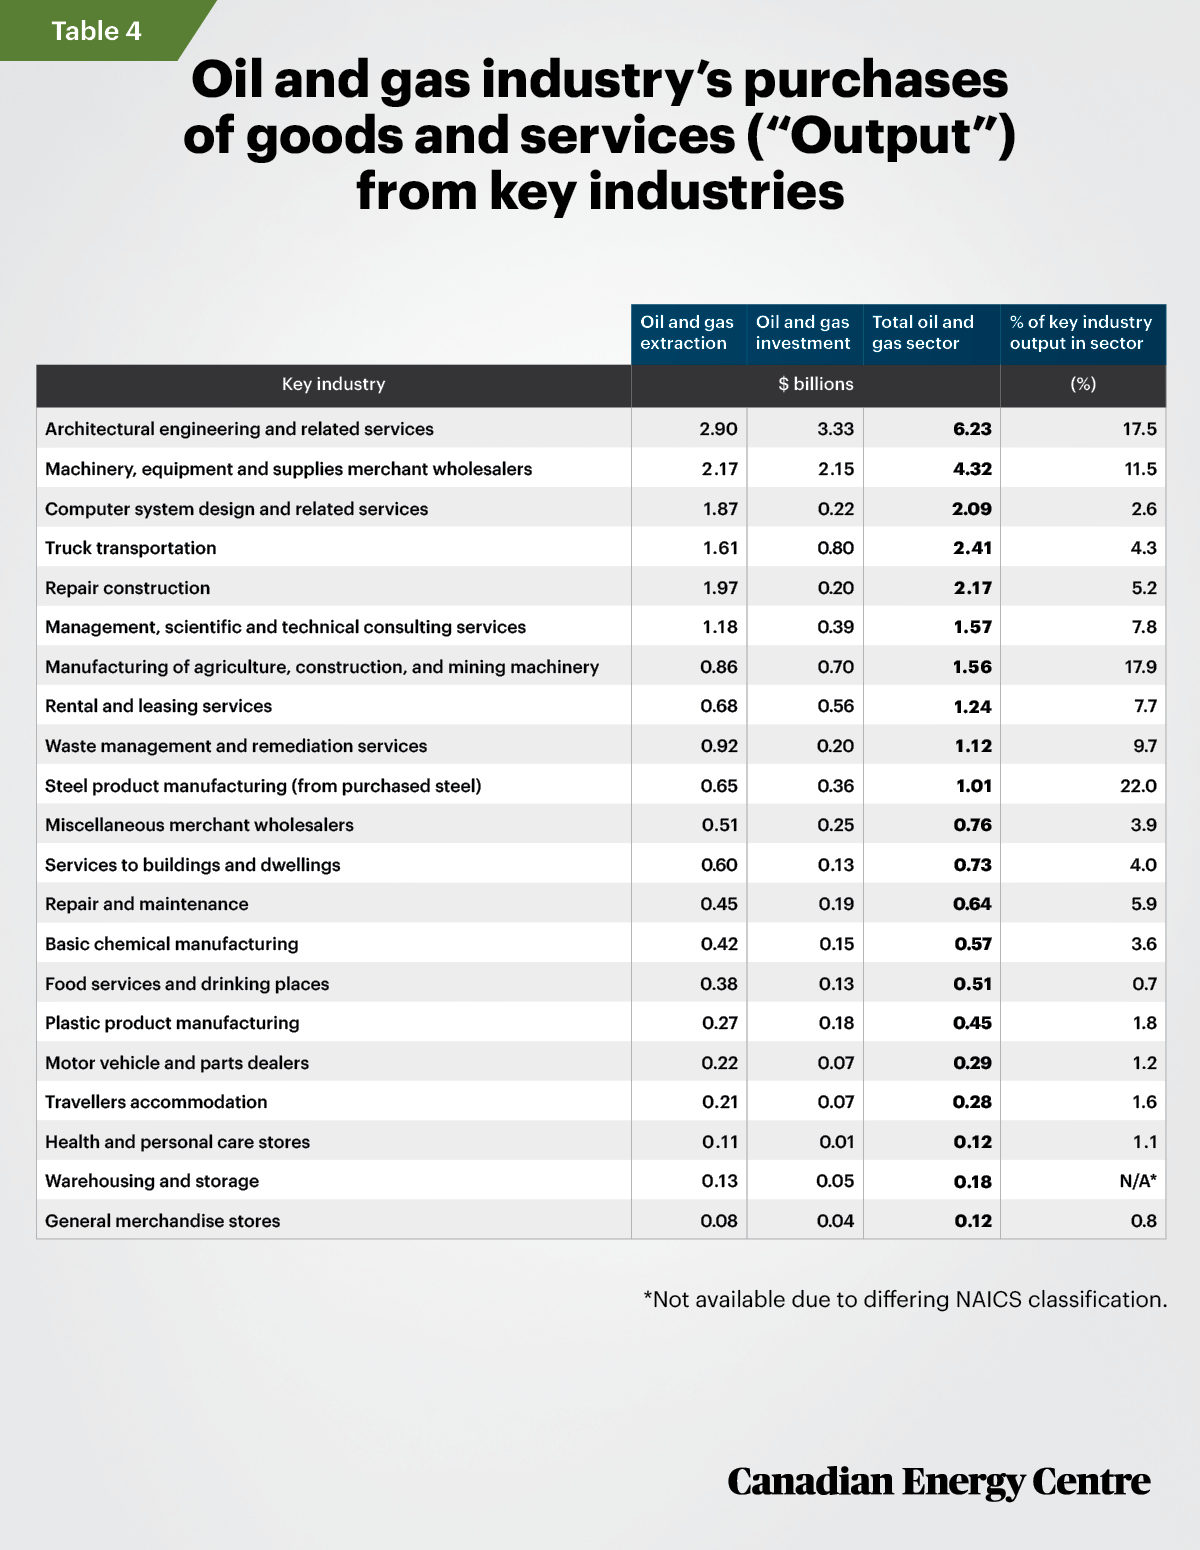
Source: Derived from Statistics Canada Custom Tabulation of the Supply and Use Tables, 2016.
Jobs
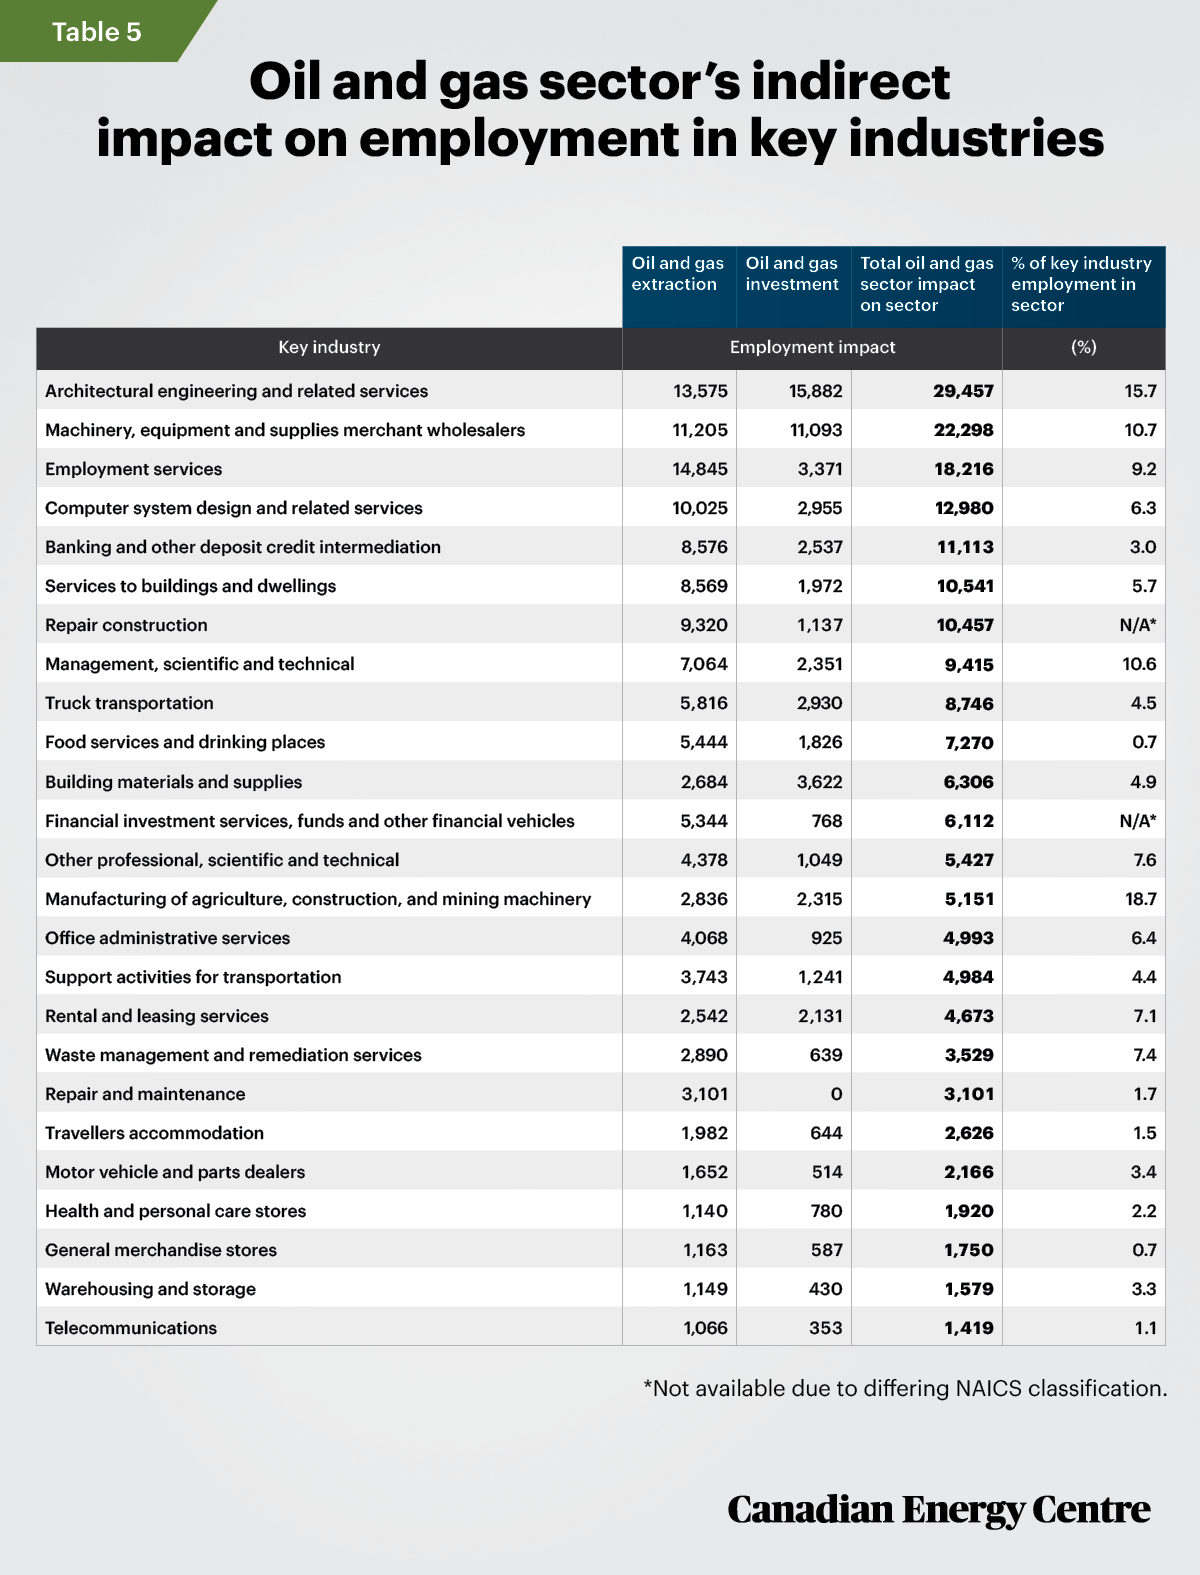
In 2016, the Canadian oil and gas sector was responsible for jobs created in other sectors ranging from just over 1,400 in the telecommunications sector (or 1.1 per cent of all jobs in that industry) to 29,457, or 15.7 per cent of all jobs in the architectural engineering and related services sector (see Table 5).
Source: Derived from Statistics Canada Custom Tabulation of the Supply and Use Tables, 2016.
Conclusion
The broad Canadian oil and gas sector’s contribution to the Canadian economy — even with the energy price decrease as of 2016 — was significant, representing 3.3 per cent of all direct and indirect jobs across Canada, and a direct and indirect contribution of 5.4 per cent to Canada’s total GDP. The activities of the broad Canadian oil and gas sector are also indirectly responsible for significant portions of GDP, employment and output in key industries across Canada.
As compared to the narrower direct oil and gas extraction sector which comprised about 2.2 per cent of GDP in 2016, the broad oil and gas sector includes both the direct and indirect impacts of oil and gas extraction and oil and gas investment on the economy.
Appendix: A primer on the Statistics Canada I/O model and Supply and Use Tables (SUTs)
There has been some debate over the past number of years about the strengths and weaknesses of Input/Output (I/O) models in assessing the contribution of industry sectors to the Canadian economy. For background on the Statistic’s Canada I/O model used to arrive at the estimates in this CEC Fact Sheet, we refer to extracts from the following papers by Statistics Canada (2020) and G. Kent Fellows and Jennifer Winter (2018).
From Statistics Canada, Supply, Use and Input-Output Tables, 2020:
Input/output (I/O) models are generally used to simulate the economic impacts of the output of one or several industries. The simulation results from a “shock” to an I/O model will show the direct and indirect and impacts on GDP, which industries benefit the most, and the number of jobs created … The I/O accounts focus on measuring the productive structure of the Canadian economy, and consists of the supply and use tables, among others…
These tables can be used to calculate economy-wide gross domestic product (GDP) either directly, by summing value added over the industries, or indirectly, by summing to the economy-wide cost of primary inputs (incomebased GDP) or by computing the grand total of the flow of products into final use categories (expenditure-based GDP)…The I/O tables allow the analyst to explore “what if?” questions at a fairly detailed level, exploring the impact of changes in final demand on output while taking account of the interdependencies between different industries and regions of the economy and the leakages to imports and taxes. For example, such models might be used to study the question: “If Canadian oil and gas exports doubled, what industries would be most affected and in which provinces?”
From Statistics Canada Workshop: Statistics Canada’ Input-Output Framework, Input-Output Multipliers and Economic Impact Simulation, March 9-10, 2020:
The supply and use tables represent the most coherent and detailed accounting of the Canadian economy available. Information is provided by industry, products, provinces, sectors, and components of final use… The Canadian input-output framework is an important component of the Canadian System of Macroeconomic Accounts and highly integrated with the Income and Expenditure Accounts…The national input-output tables go back to 1961. The provincial input-output tables go back to 1997…The I/O model and supply and use tables can be used to determine the economic contribution or “footprint” of a given establishment or industry…
Statistics Canada’s model is a “pure” Input-Output model and is not a general equilibrium (GE) mode…Perhaps the most significant limitation of I/O is the assumption that extra output can be produced in one area without taking resources away from other activities, thus overstating economic impacts. The actual impact is likely to be dependent on the extent to which the economy is operating at or near capacity…No functions or parameters are included in the I/O model to address the issues related to the constraints of the model…The Statistics Canada model is an excellent Input-Output model that can become the core or basis of a GE model.
A 2018 University of Calgary, School of Public Policy paper from G. Kent Fellows and Jennifer Winter, “Getting to Know Models: A Primer and Critique on Input-Output and Computable General Equilibrium Models and Their Uses for Policy and Project Analysis,” provides the following background on I/O models:
Economic Impact Models (EIA) models can take many forms, but traditionally Input-Output (I/O) models have (been) predominant… I/O models are basically just a bunch of ratios (multipliers) that relate final demand in any sector to all of the initial inputs required to produce
that final demand…I/O models remain ubiquitous because they are easy to access, easy to use…In Canada, the StatCan I/O model is widely employed to do a model simulation. StatCan conducts approximately 100-125 runs per year… At some point (late 1990’s?), the goal or use of
I/O based economic impact assessments seems to have shifted from “distribution and planning” to “magnitude of the impact” (specifically on labour) …I/O models have come under criticism due to a view that the underlying assumptions are unreasonable and the results are often misinterpreted…
By comparison Computational General Equilibrium (CGE) models are generally presented as more reasonable abstractions. Yet both rely on similar structures and are calibrated using similar (if not identical) datasets…Despite what we might deem as unrealistic assumptions, the I/O model (without induced effects) can generate results similar to a Computable General Equilibrium (CGE) model and is still (in my opinion) a useful model.
For small shocks, the difference can be quite small for overall GDP. From a starting point at initial equilibrium, I/O is almost a linear approximation of CGE. I/O models are also relatively adept at identifying the distribution of induced demand across other sectors…I/O results should generally be interpreted as a gross effect, not a net effect. I/O results are more likely to produce a “rising tide lifts all ships” result. A positive shock is accommodated with new labour, capital and resources, so there is no competition for factors of production (or any other input). If significant resources are unemployed/idle, IO and CGE models should produce similar and reasonable projections. CGE models are closer to established economic theory and are more internally consistent (and consistent with contemporary economic theory) in their assumptions.
Use of a CGE model requires lots of assumptions (factor supply functions). Modelers have discretion in which assumptions they rely on. This flexibility is both a benefit and a liability of CGE models.
Notes
This CEC Fact Sheet was compiled by Lennie Kaplan and Mark Milke at the Canadian Energy Centre (www.canadianenergycentre.ca). The authors and the Canadian Energy Centre would like to thank and acknowledge the assistance of Jack Mintz, Robert Mansell, and Philip Cross in reviewing the data and research for this Fact Sheet. Image credits: Oilfield Worker by Hoptocopter from Getty Images.
Methodology
The estimates presented in this paper are the result of a Statistics Canada custom tabulation of the Canadian oil and gas sector taken from the Supply and Use Tables (SUTs). The SUTs capture and present the production of products by domestic industries, imports of products as well as their use, either as inputs, final consumption, investment or exports. The latest SUTs are for the 2016 calendar year. The total impact of the oil and gas industry on the Canadian economy, including the direct and indirect, can be quantified using input-output multipliers derived from the SUTs. According to Statistics Canada (2018), these multipliers “… provide a measure of the interdependence between an industry and the rest of the economy.” (Statistics Canada, 2018, “National and Provincial Multipliers”, Surveys and statistical programs, Documentation: 15F0046X). As Statistics Canada notes, although there is a lag from the 2016 data, the structure of the Canadian economy evolves slowly, so the lag should have a minimal impact on the estimates of GDP, jobs and output. (Statistics Canada, Economic Insights, 11-626-X, No. 109, The Decline in Production and Investment in Canada’s Oil and Gas Sector and its Impact on the Economy, July 2020. This fact sheet applies the same concepts and definitions of oil and gas extraction activities as used by the North American Industry Classification System (NAICS), Canada 2012. The Canadian SUTs use the Supply and Use Product Classification (SUPC) system, a variant based on the North American Product Classification System (NAPCS), to classify products within the economy.
Definitions
Using Statistics Canada terminology, we define the broad Canadian oil and gas sector as the sum of oil and gas extraction (NAICS 211) and oil and gas investment. For the purposes of NAICS and NAPCS, oil and gas extraction comprise establishments primarily engaged in operating oil and gas field properties. Such activities may include exploration for crude petroleum and natural gas; drilling, completing and equipping wells; operating separators, emulsion breakers, desilting equipment and field gathering lines for crude petroleum; and all other activities in the preparation of oil and gas up to the point of shipment from the producing property. This subsector includes the production of oil, the mining and extraction of oil from oil shale and oil sands, and the production of gas and hydrocarbon liquids, through gasification, liquefaction and pyrolysis of coal at the mine site. Oil and gas investment include capital expenditures on construction, machinery and equipment and exploration by the oil and gas extraction industry; GDP is defined as the unduplicated value of the goods and services produced in the economy; Output consists primarily of the value of goods and services produced by an industry; Jobs include employee jobs (full-time, part-time and seasonal) and self-employed jobs; The direct impact of oil and gas extraction are the effects directly attributed to this industry’s production. The direct impact of the oil and gas investment are the deliveries by domestic industries to satisfy capital expenditures by the oil and gas extraction industry; The indirect impact covers upstream economic activities associated with supplying intermediate inputs (the current expenditures on goods and services used up in the production process) to the directly impacted industries. (Excerpts taken from Statistics Canada, Contribution of the Oil and Gas Sector to the Canadian Economy in 2016, 2020, Custom Tabulation.)
Sources (Links live as of Sept 19, 2020)
Alberta (undated). Oil prices. <https://bit.ly/2FK1Cg7>; Fellows, G. Kent and Jennifer Winter (2018). “Getting to Know Models: A primer and critique on Input-Output and Computable General Equilibrium Models and their uses for policy and project analysis,” University of Calgary, School of Public Policy. <https://bit.ly/3mQ9jSY>; Statistics Canada, Contribution of the Oil and Gas Sector to the Canadian Economy in 2016, 2020, Custom Tabulation; Statistics Canada (2020a). Table 34-10-0035-01 Capital and repair expenditures, non residential tangible assets, by industry and geography, <https://bit.ly/3kwcTPW>; Statistics Canada (2020b). Custom Tabulation of the Oil and Gas Sector Derived from the Supply and Use Tables, <https://bit.ly/3hK6HSK>; Statistics Canada (2020c). Economic Insights, 11-626 X, No. 109, The Decline in Production and Investment in Canada’s Oil and Gas Sector and its Impact on the Economy, July 2020, <https://bit.ly/32LbTlb>; Statistics Canada (2020c). Table 36-10-0400-01 Gross domestic product (GDP) at basic prices, by industry, provinces and territories, percentage share, <https://bit.ly/2ZNJAQU>: Statistics Canada (2020d). Table 36-10-0401-01 Gross domestic product (GDP) at basic prices, by industry (x 1,000,000), <https://bit.ly/3kte7LV>; Statistics Canada (2020e). Table 36-10-0402-01 Gross domestic product (GDP) at basic prices, by industry, provinces and territories (x 1,000,000), <https://bit.ly/35MzpQA>; Statistics Canada (2020f). Table 36-10-0480-01 Labour productivity and related measures by business sector industry and by non-commercial activity consistent with the industry accounts, <https://bit.ly/3kte82r>; Statistics Canada (2018). “National and Provincial Multipliers”, Surveys and statistical programs, Documentation: 15F0046X, <https://bit.ly/32L4L8q>; Statistics Canada (2020g). Table 36-10-0488-01 Output, by sector and industry, provincial and territorial (x 1,000,000), <https://bit.ly/2FKNKlM>; Statistics Canada (2020h). Table 36-10-0478 01 Supply and use tables, detail level, provincial and territorial (x 1,000), <https://bit.ly/3mCm9nt>; Statistics Canada, Supply, Use and Input-Output Tables, 2019. <https://bit.ly/2G0S3tk>; Statistics Canada, Workshop: Statistics Canada Supply-Use Framework, The Use Table, March 9-10, 2020.
Creative Commons Copyright
Research and data from the Canadian Energy Centre (CEC) is available for public usage under creative commons copyright terms with attribution to the CEC. Attribution and specific restrictions on usage including non-commercial use only and no changes to material should follow guidelines enunciated by Creative Commons here: Attribution-NonCommercial-NoDerivs CC BY-NC-ND.