To sign up to receive the latest Canadian Energy Centre research to your inbox email: [email protected]
Download the PDF here
Download the charts here
The following summary facts and data were drawn from 30 Fact Sheets and Research Briefs and various Research Snapshots that the Canadian Energy Centre released in 2023. For sources and methodology and for additional data and information, the original reports are available at the research portal on the Canadian Energy Centre website: canadianenergycentre.ca.
Environment
1.
Canada’s share of Global CO2 emissions is dropping
Since the Kyoto Summit in 1997, Canada’s share of the world’s CO2 emissions has fallen from 2.2 per cent to 1.6 per cent. Canada’s share of world CO2 emissions decreased by 25 per cent from the Kyoto climate summit to the recent Dubai climate summit.

Source: CEC Research, Calculation from Various Database (2023)
2.
Canadian natural gas is getting cleaner
Emissions intensity is the emission rate of a given pollutant relative to the intensity of a specific activity or industrial production process. Emissions intensity is determined by dividing the number of absolute emissions by some unit of output, such as GDP, energy used, population, or barrel of oil produced. Between 2010 and 2021, the CO2 emissions intensity of Canadian natural gas production fell from 63.5 kilograms CO2e per barrel of oil equivalent to 44.5 kilograms CO2e per barrel of oil equivalent, a decline of nearly 30 per cent.
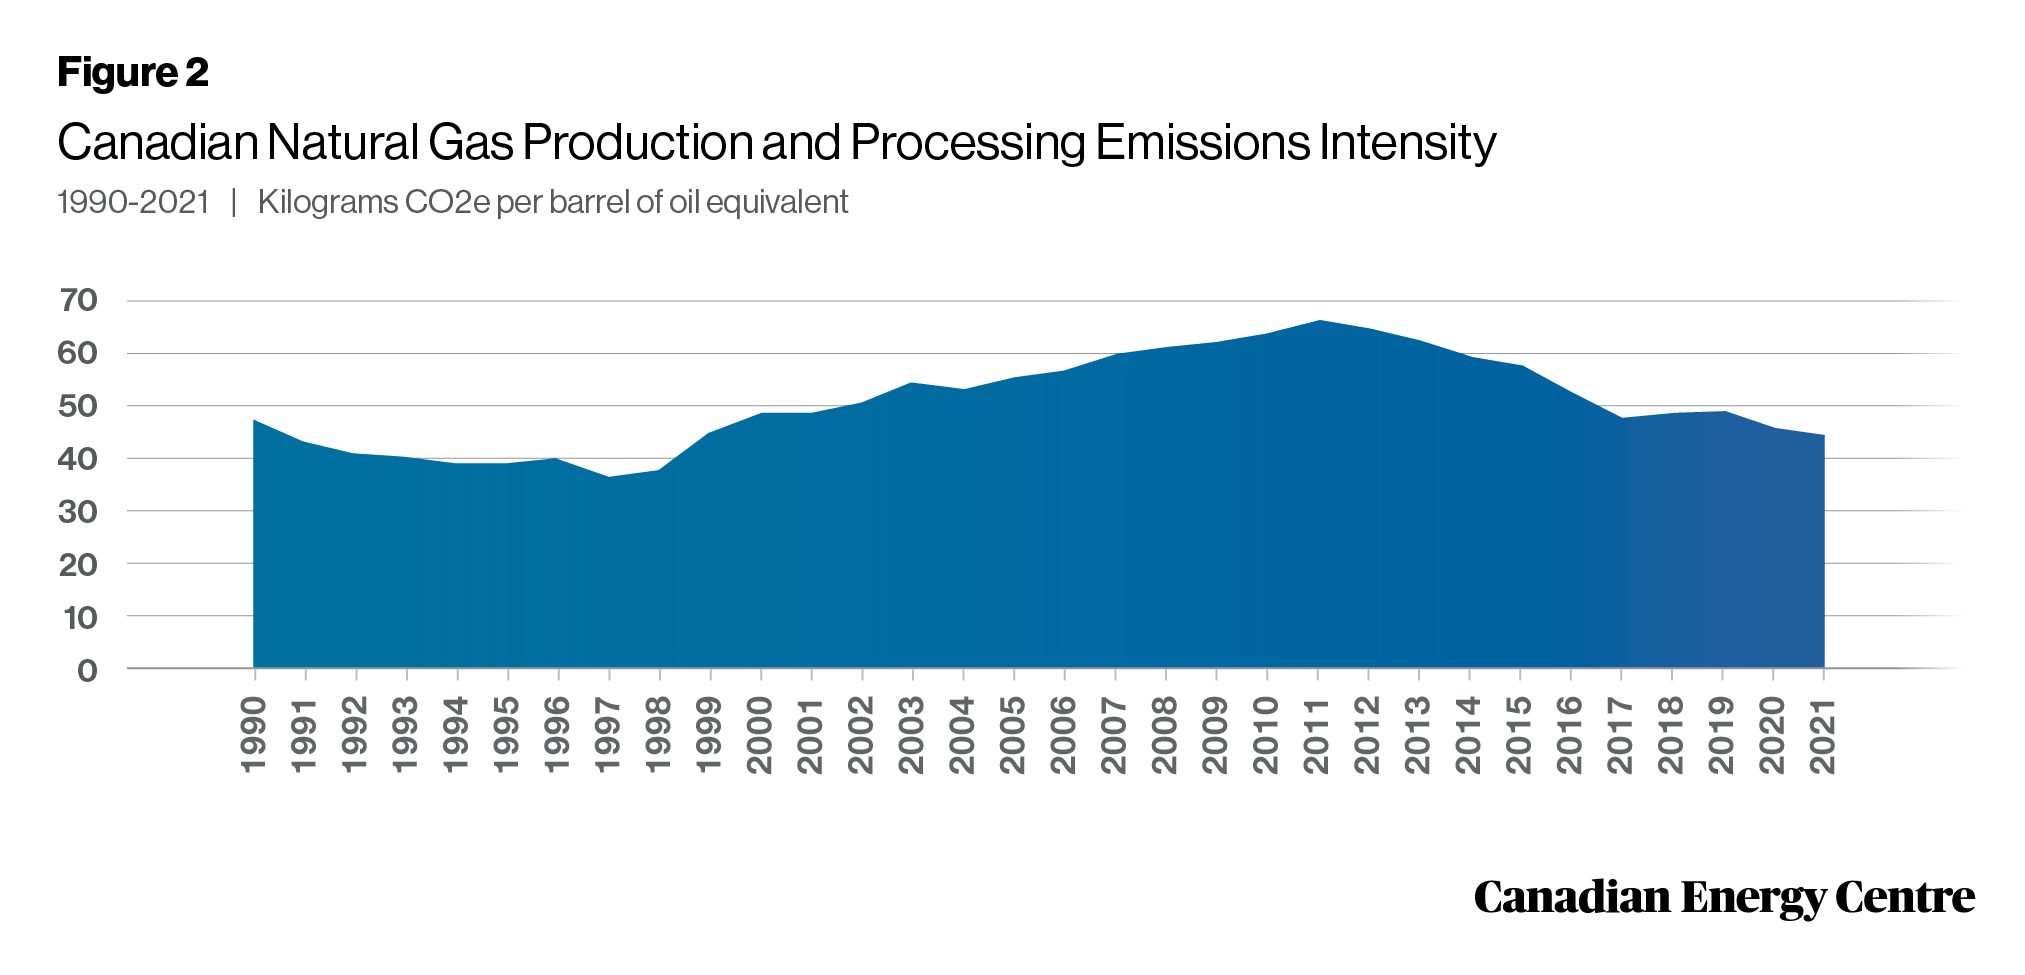
Source: Derived from Rystad Energy
3.
Canadian oil sands production is getting cleaner
Between 2000 and 2021, the emissions intensity of the oil sands subsector fell from 111.8 kilograms CO2e per barrel to just under 79.3 kilograms CO2e per barrel, a decline of over 29 per cent. As GHG emissions intensity in the upstream oil sector continues to decline and because Canada’s ESG performance remains highly rated, Canadian oil has the potential to become the barrel of choice on the world stage.
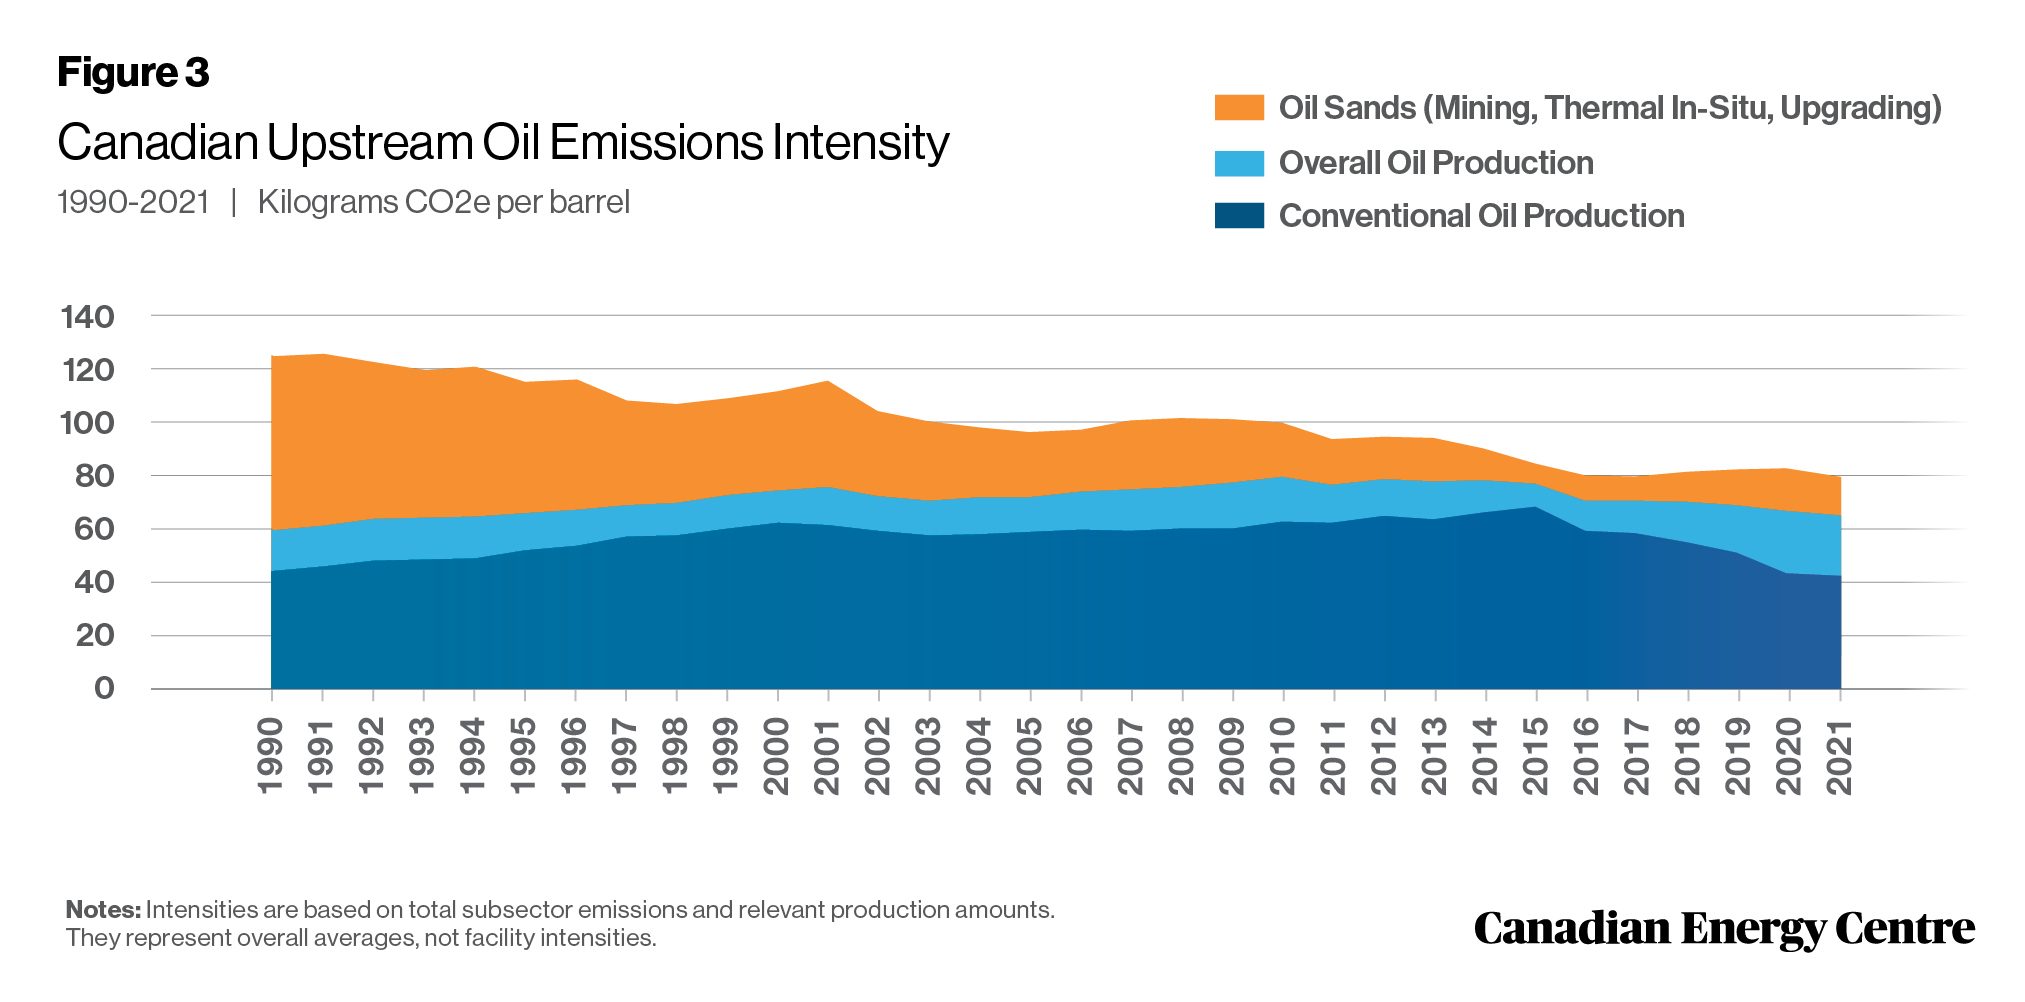
Source: Derived from Rystad Energy
4.
Canada’s oil and gas sector is doing its part to reduce methane emissions
Gas flaring is the burning off of the natural gas that is generated in the process of oil extraction and production. It is a significant source of greenhouse gas emissions (GHGs). In 2022, 138,549 million cubic meters (m3) (or 139 billion cubic meters (bcm)) of flared gases were emitted worldwide, creating 350 million tonnes of CO2 emissions annually. At 945 million m3 in 2022, Canada was the eighth lowest flarer among the world’s top 30 oil and gas producers (23rd spot). Canada decreased its flaring emissions by 320 million m3 from its 2012 level of 1,264 million m3, a 25 per cent drop. In 2022, Canada contributed just 0.7 per cent of the global amount of gas flaring despite being the world’s fourth largest oil producer.

Source: World Bank (undated)
5.
Environmental spending by Canada’s oil and gas sector remains high
Canadian businesses spent $28.6 billion on environmental protection between 2018 and 2020. When capital and operating expenses on environmental protection are combined, out of that $28.6 billion the oil and gas sector spent $9.4 billion, or nearly 33 per cent. In 2020 alone, when capital and operating expenses on environmental protection are combined, the oil and gas sector spent $2.7 billion, or 27 per cent of all Canadian business spending on the environment that year.

Source: Derived from Statistics Canada, Table 38-10-0130-01
6.
Alberta among top provincial spenders on environmental protection
Industries are not alone in spending money on environmental protection; provincial governments do as well. Total provincial government spending on environmental protection between 2008 and 2021 was nearly $143.5 billion. In 2021, Alberta spent $22.6 billion or 15.7 per cent of all provincial expenditures on the environment, while its proportion of the national population was 11.6 per cent.
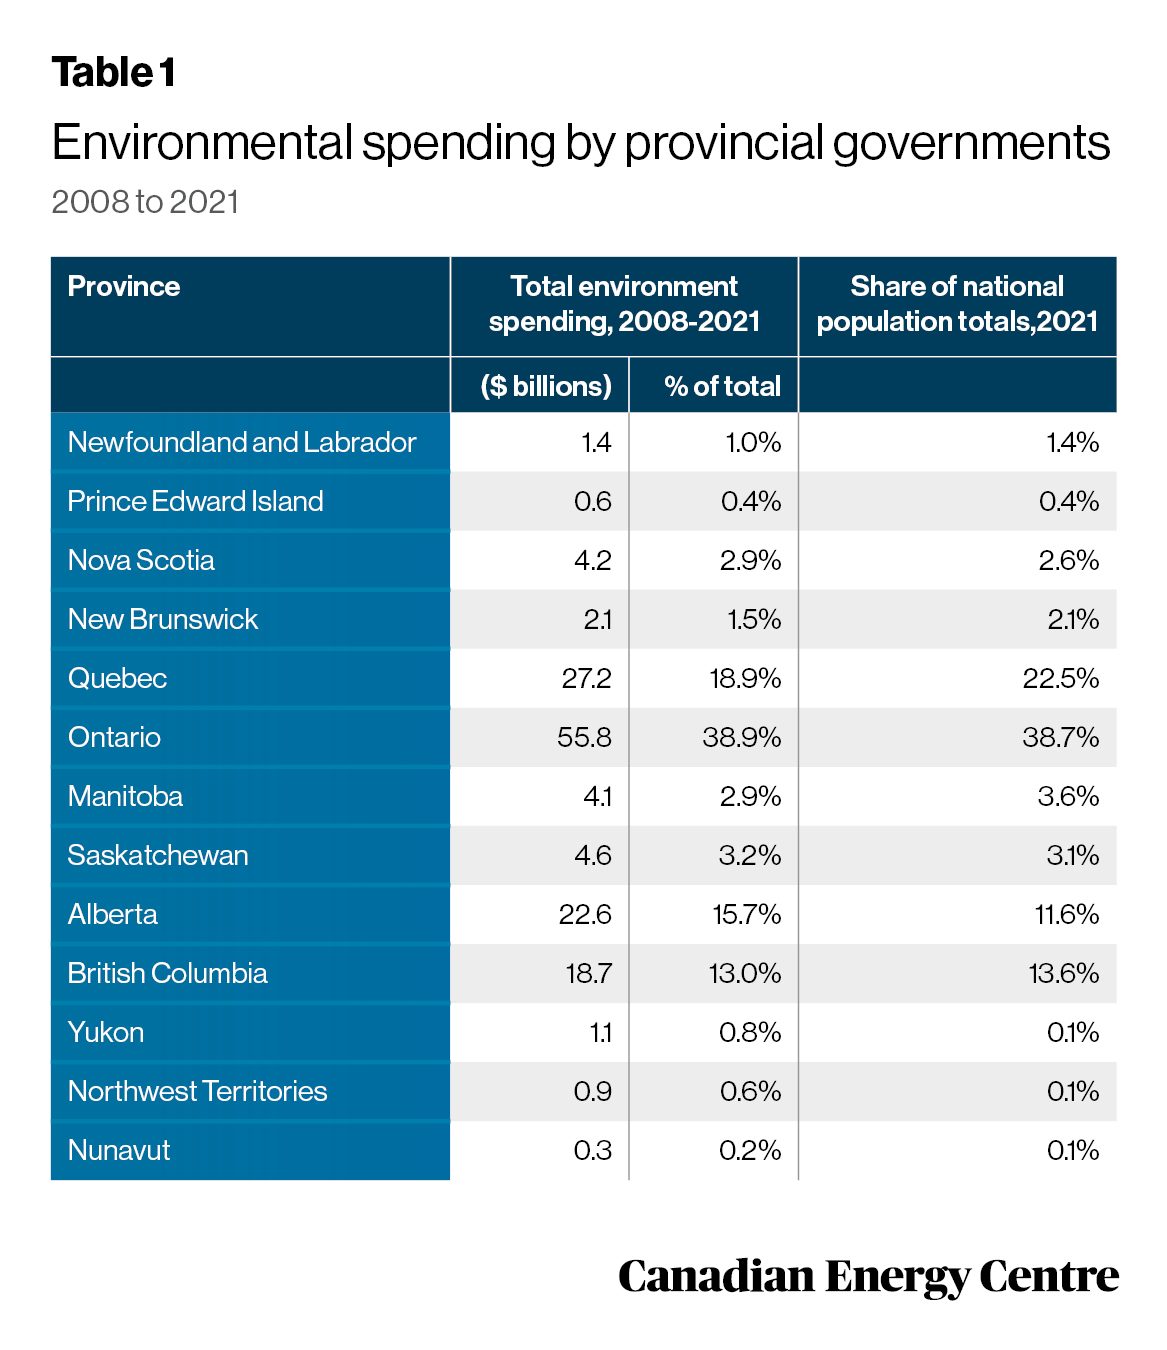
Source: Statistics Canada, Tables 10-10-0005-01 and 17-10-0005-01; and authors’ calculations
Economics of the Oil and Gas Sector
7.
Revenue contribution from the oil and gas sector: $578.7 billion between 2000 and 2021
The gross revenue contribution to federal, provincial, and municipal governments received exclusively from the oil and gas sector was $578.7 billion between 2000 and 2021, an average of $26.3 billion per year. The $578.7 billion figure includes $461.6 billion in direct provincial revenues, $99.6 billion in direct federal revenues, and $17.3 billion in indirect federal, provincial, and municipal taxes.
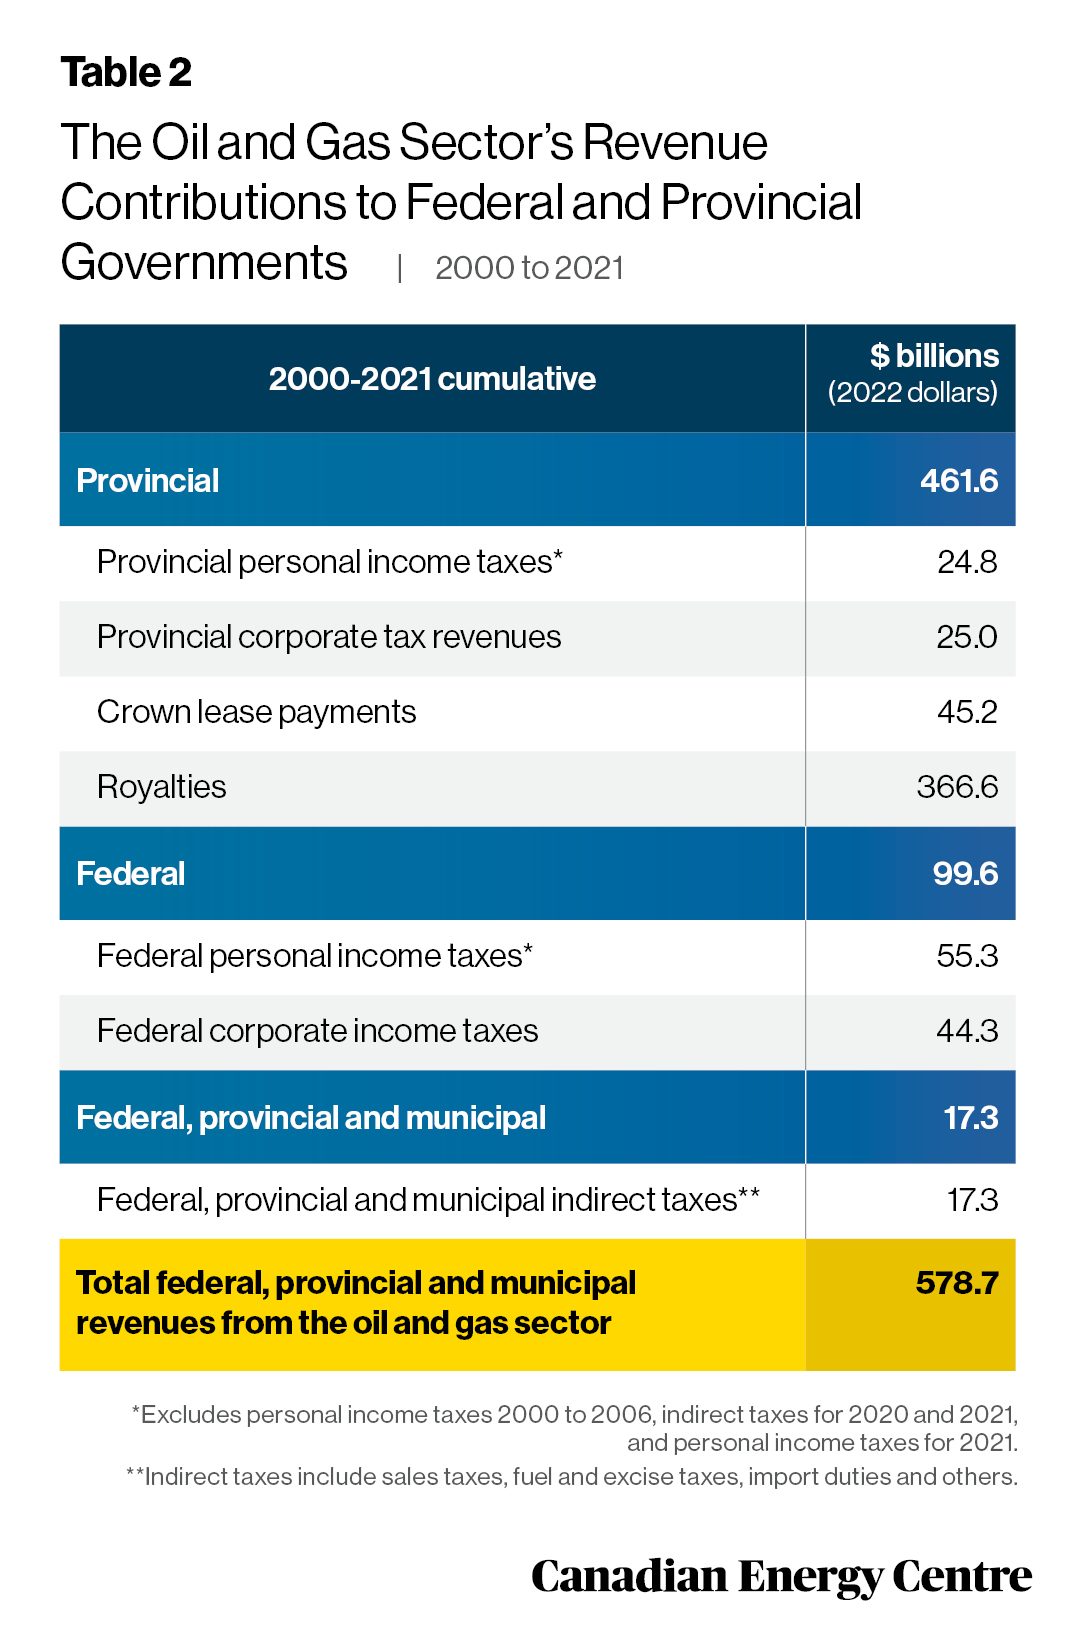
Sources: Statistics Canada, 2022 (a, b, c, d), Statistics Canada 2023 (a,b), and CAPP, 2022
8.
Projected government revenues from Canada’s oil sands sector: US$231 billion from 2023 to 2032
Government revenues from Canada’s oil sands sector (which includes provincial royalties and federal and provincial corporate taxes) are expected to rise from US$17.1 billion in 2023 to US$28.7 billion in 2032—nearly US$231 billion cumulatively—assuming the price of oil is a flat US$80 per barrel. Both projections would be about 20 per cent more in Canadian dollars at the current exchange rate.
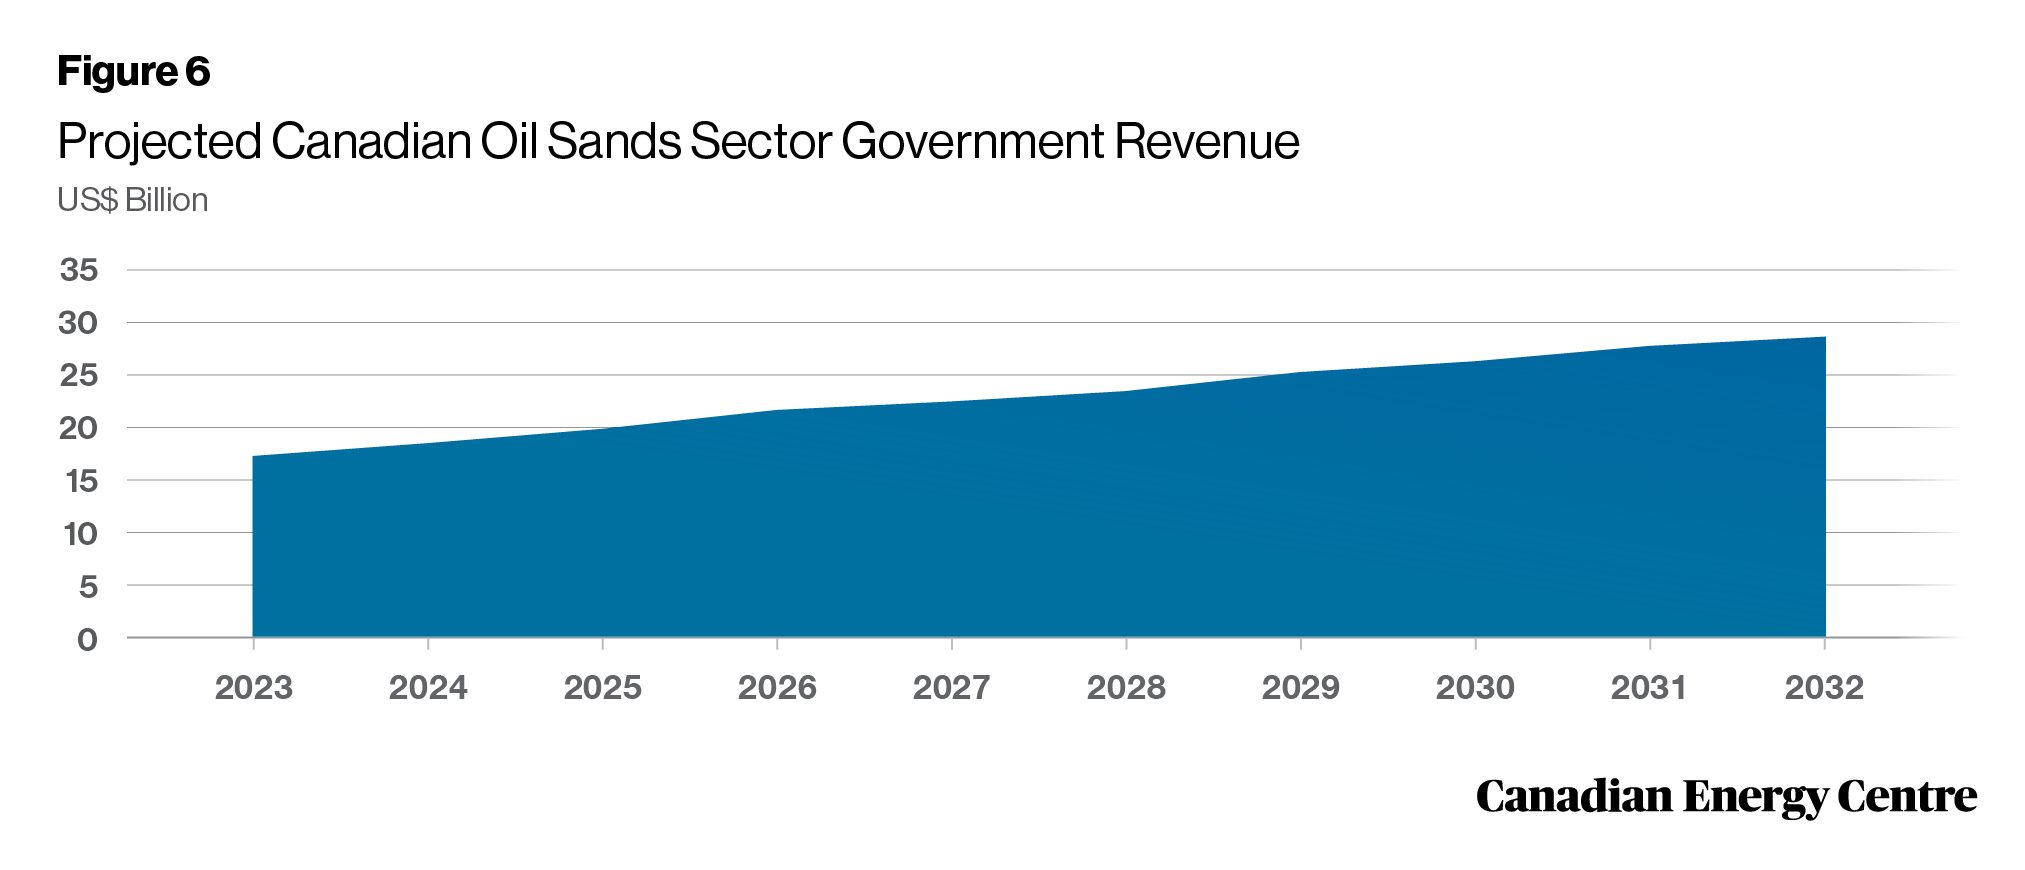
Source: Derived from Rystad Energy
9.
Projected capex from Canadian oil sands sector: nearly US$113 billion over the next decade
Capex from the Canadian oil sands sector is projected to reach US$112.7 billion over the next decade. Assuming a flat US$80 per barrel for the price of oil, oil sands sector capex is expected to rise from US$10.1 billion in 2023 to US$14.2 billion in 2032. Those projections would be about 20 per cent more in Canadian dollars at the current exchange rate.
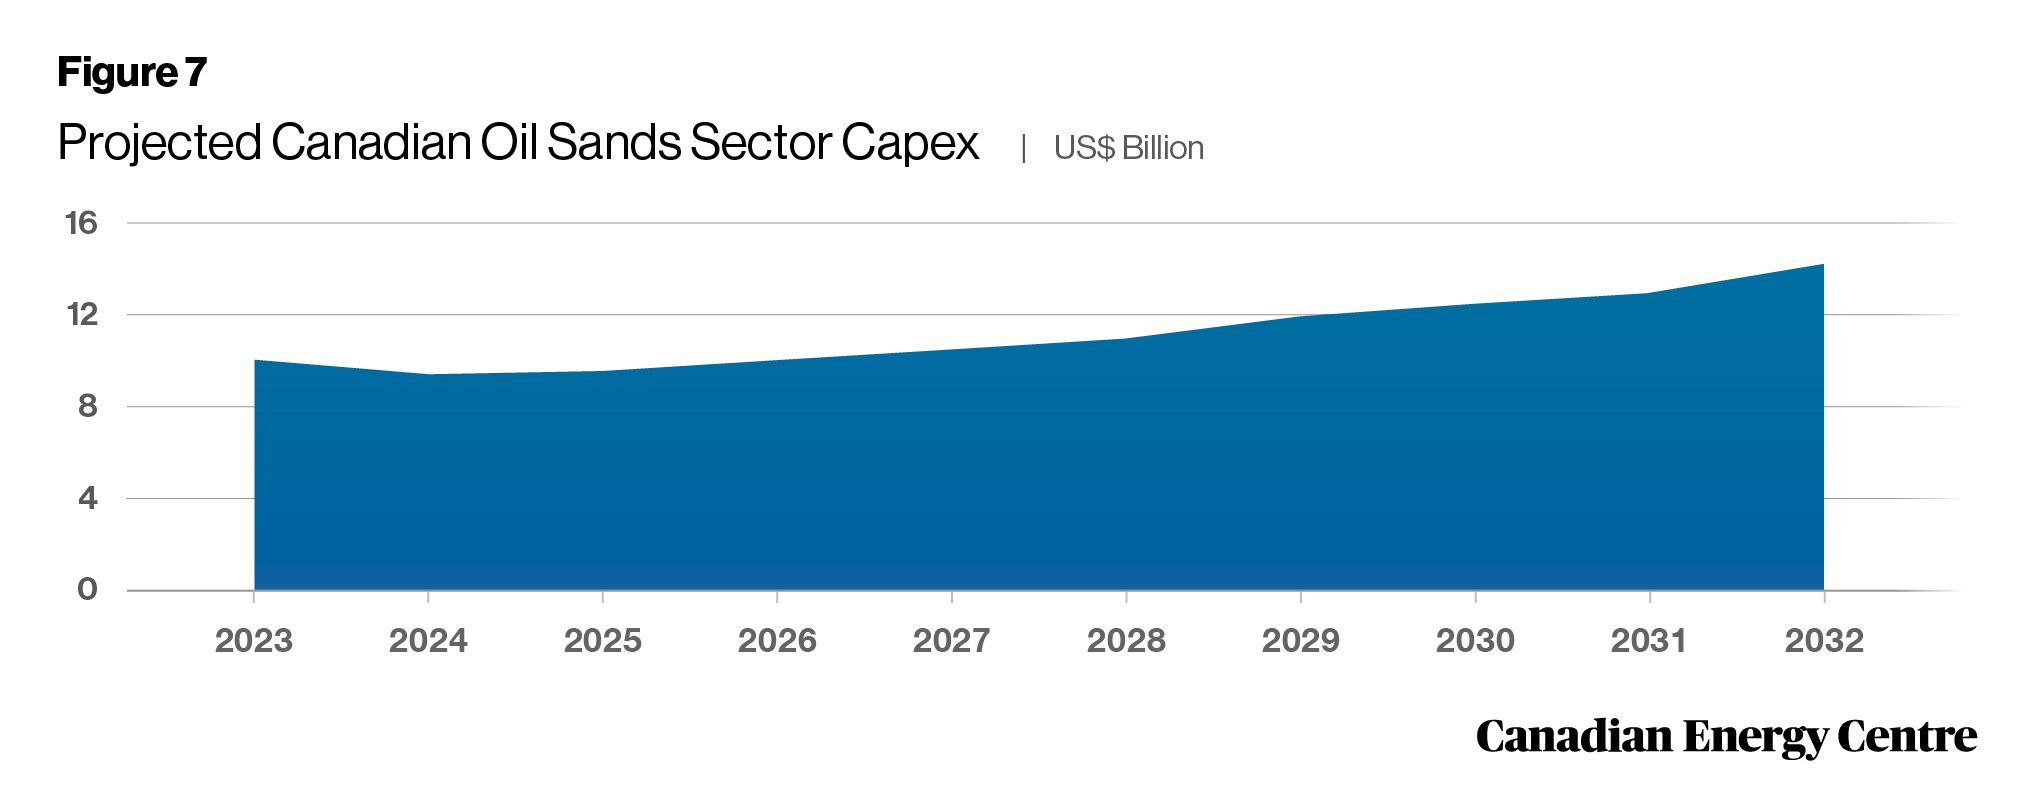
Source: Derived from Rystad Energy
10.
Canadian overall upstream oil sector supply costs have declined over 35% since 2015
The cost of supply for the Canadian upstream oil sector is the minimum constant dollar price needed to recover all capital expenditures, operating costs, royalties, taxes, and earn a specified return on investment. Supply costs indicate whether the upstream oil sector is economically viable.
Supply costs within Canada’s upstream oil sector declined significantly between 2015 and 2022. At the end of 2015, the Canadian upstream oil sector’s weighted average breakeven price was nearly US$76.00 per barrel of Brent. By the end of 2022, that weighted average breakeven price was US$49.09 per barrel of Brent, a decline of US$26.91 per barrel, or over 35 per cent since 2015. This number incorporates different phases of oil production including producing, under development, and discovery.

Source: Derived from Rystad Energy
11.
Breakeven costs in Canadian natural gas sector fifth lowest in the world
The Canadian natural gas sector had a weighted average breakeven gas price of US$2.31 per thousand cubic feet (mcf) in 2022, fifth lowest among major natural gas producing countries. Only in Saudi Arabia (US$1.09 per mcf), Iran (US$1.39 per mcf), Qatar (US$1.93 per mcf), and the United States (US$2.22 per mcf) was the breakeven gas price lower. The weighted average breakeven costs for Canada‘s natural gas sector in 2022 were lower than in Russia, Norway, Algeria, China, and Australia.
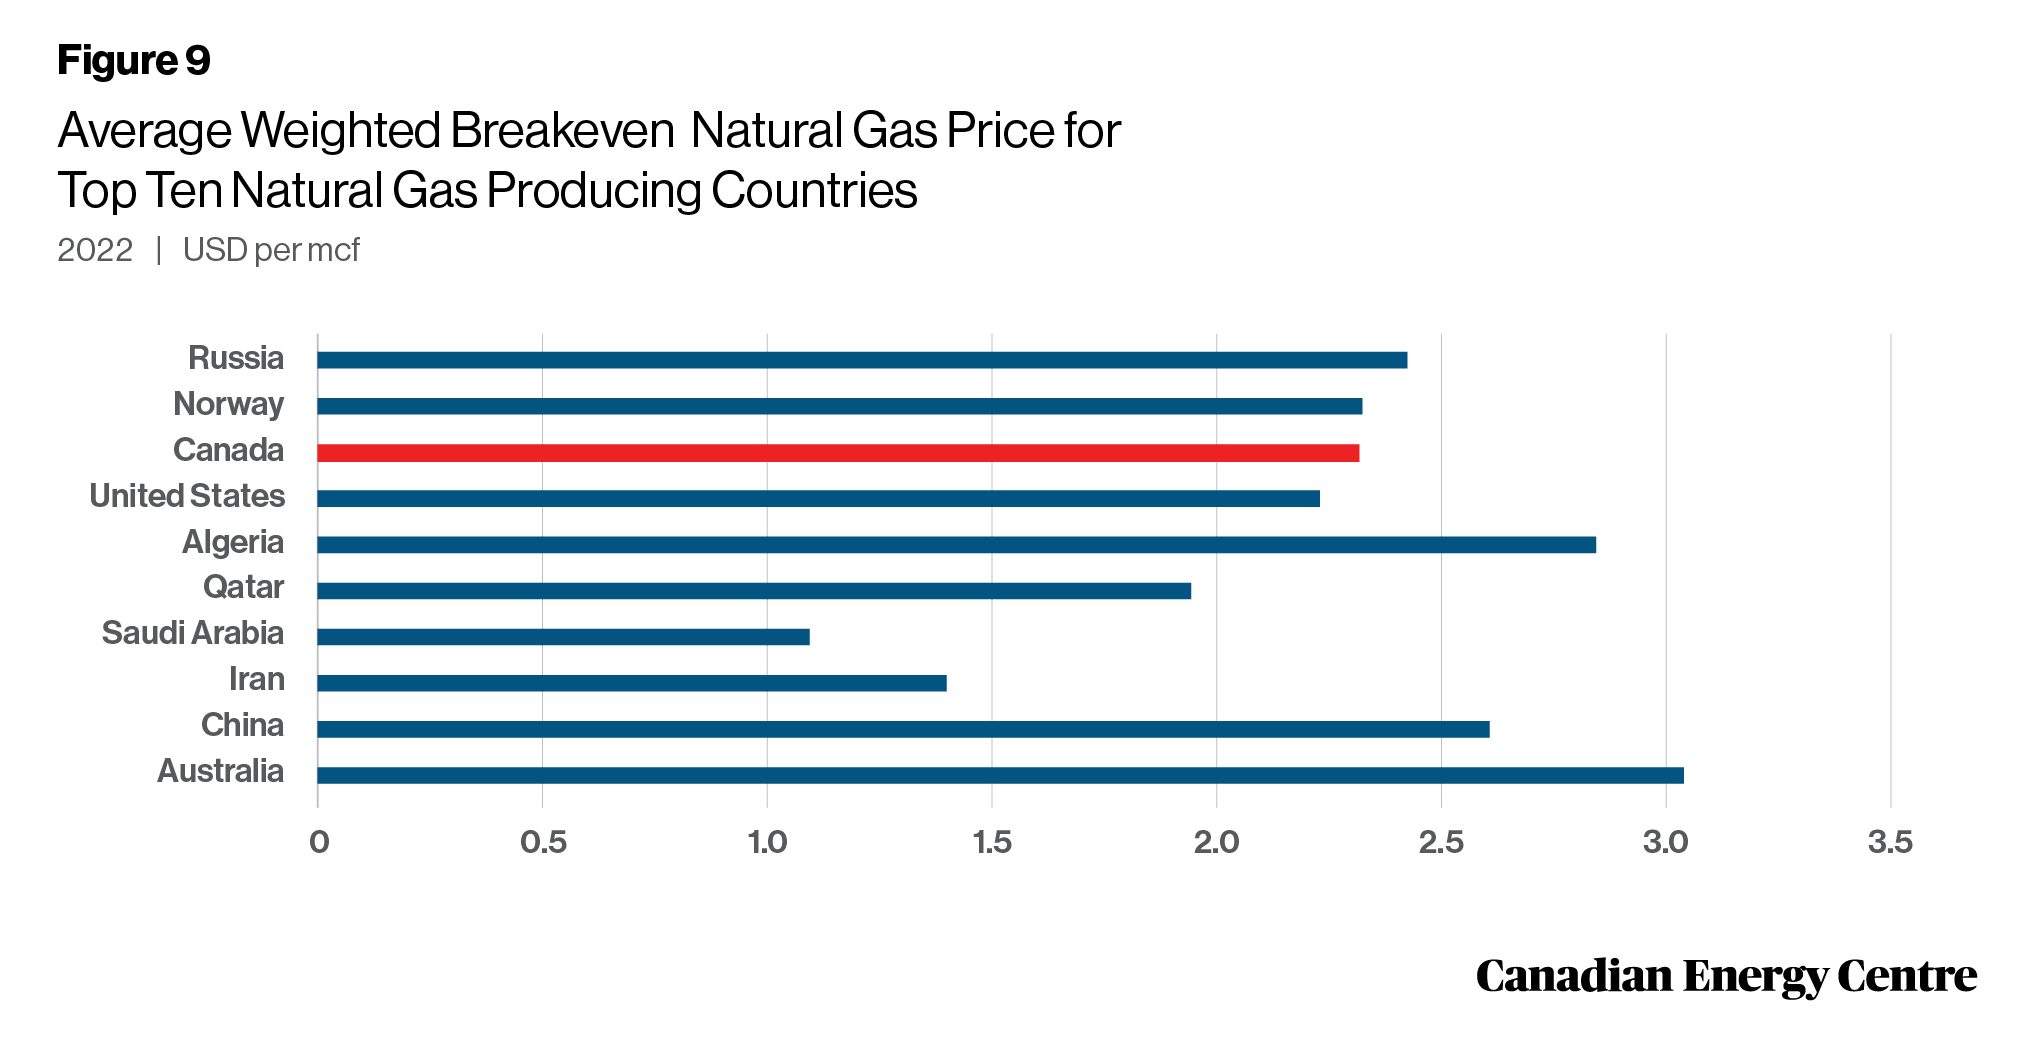
Source: Derived from Rystad Energy
12.
Natural gas prices have skyrocketed
Natural gas prices have skyrocketed around the world in the last two years. In 2021, the price of natural gas in Asia was US$18.60 per million British thermal units (mmbtu) compared to US$4.40 per mmbtu in 2020—an increase of 323 per cent in just one year. By comparison, in 2021 natural gas sold for US$2.80 per mmbtu on Alberta’s AECO-C trading hub; in Asia it was US$15.88 per mmbtu more (or 564 per cent higher). Between 2019 and 2021, the price gap between Henry Hub in the US and AECO-C natural gas fluctuated from a high of 98 per cent in 2019 to a low of 26 per cent in 2020. In 2021, U.S. natural gas sold for US$3.84 per mmbtu, 40 per cent higher than the US$2.75 per mmbtu average price for AECO-C natural gas that year.

Sources: BP Statistical Review of World Energy and International Monetary Fund
13.
Projected government revenues from the Canadian natural gas sector: over US$227 billion through 2050
Government revenues from the Canadian natural gas sector are projected to reach over US$227 billion through 2050. Under a Henry Hub price for natural gas of US$3.00 per thousand cubic feet (kcf), government revenues from the country’s natural gas sector are expected to rise from US$1.4 billion in 2023 to US$3.4 billion in 2050. Should the Henry Hub price reach US$4.00 per kcf, government revenues from the country’s natural gas sector would be projected to rise from US$2.0 billion in 2023 to US$10.0 billion in 2050.

Source: Derived from Rystad Energy
14.
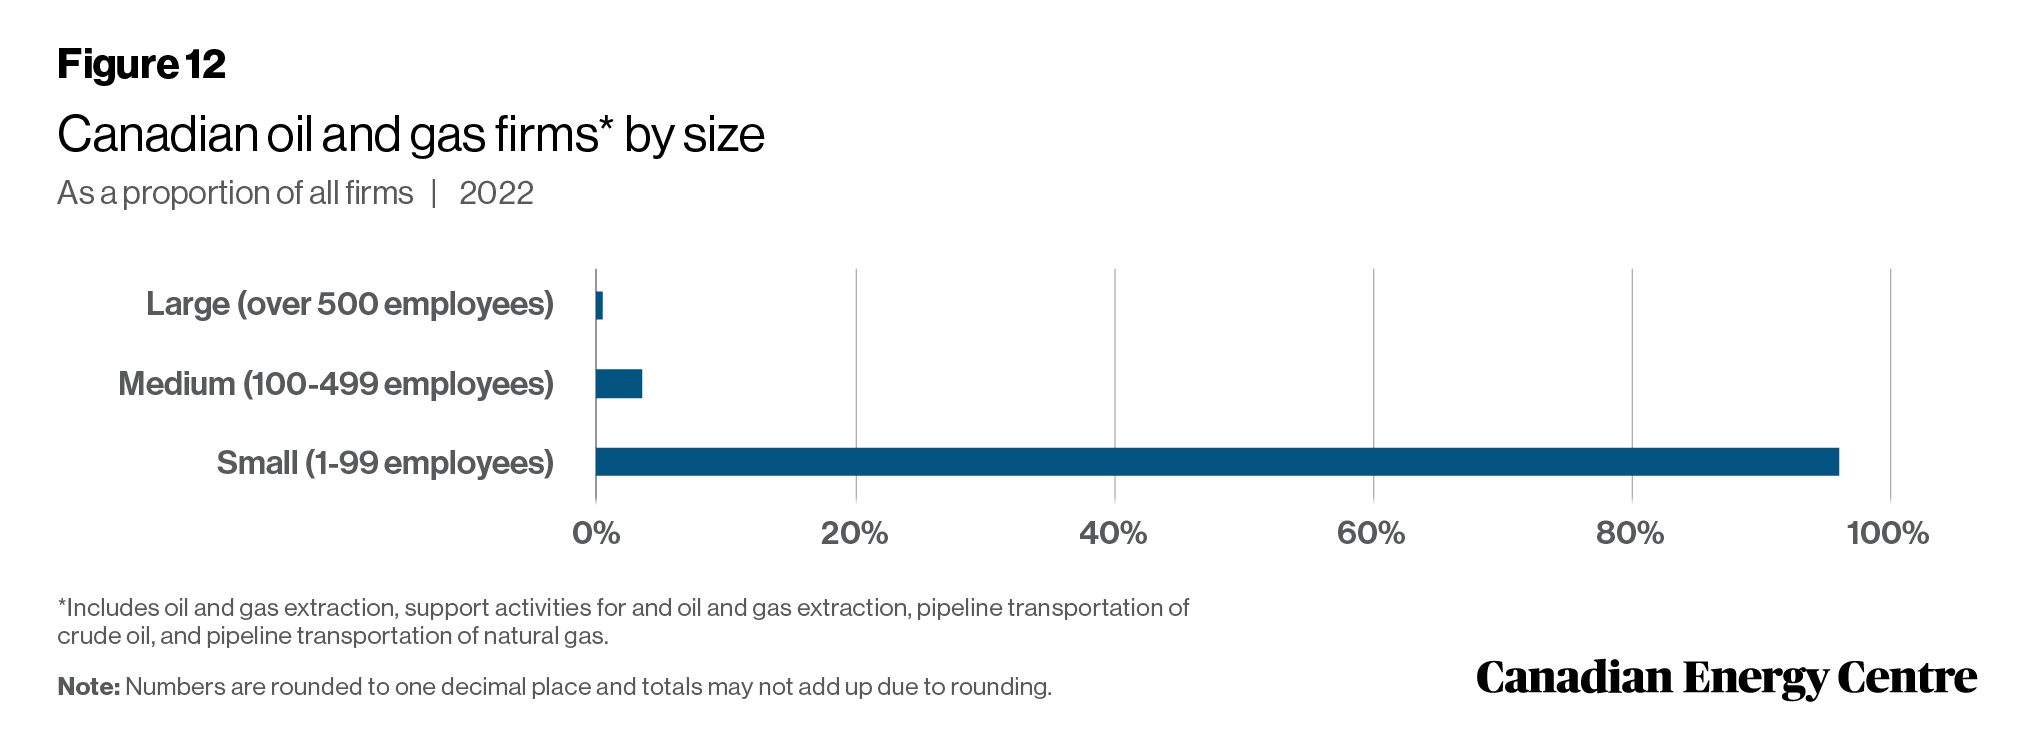
Small business plays a key role in the oil and gas sector
Small business plays a key job creation role in Canada’s economy. Statistics Canada defines small businesses as those with between one and 99 paid employees. Medium-size enterprises are those with 100 to 499 employees, while large enterprises have 500 or more employees. In 2022, of the oil and gas firms in Canada, 96.0 per cent were small, 3.5 per cent were medium-sized, and 0.6 per cent were large companies.
With the exception of construction, the oil and gas sector in Canada has a higher proportion of small businesses than other major industries. As of 2022, 96.0 per cent of all oil and gas energy firms had between 1 and 99 employees compared with 93.2 per cent in manufacturing, 89.6 per cent in utilities, and 99.0 per cent in the construction sector. The all-industry average is 98.0 per cent.
Source: Authors’ calculation based on Statistics Canada Table 33-10-0661-01
15.
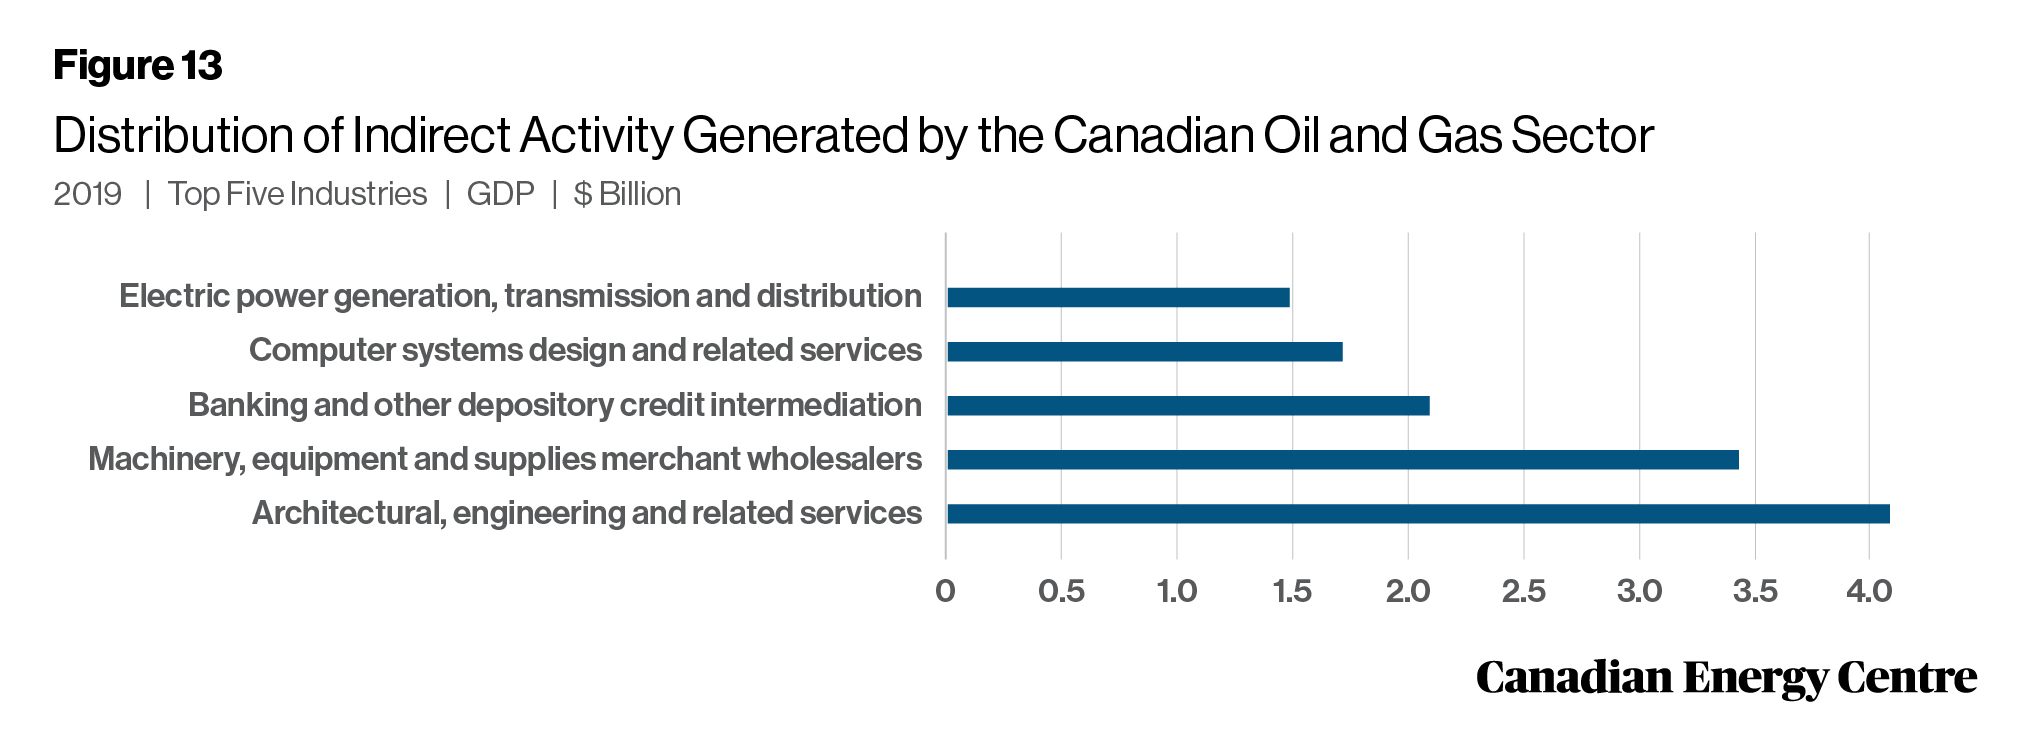
Canada’s oil and gas sector has an impact on key industries across the Canadian economy
In 2019, the activities of the Canadian oil and gas sector were indirectly responsible for significant portions of the GDP created by other key industries across Canada. The sector’s activities generated $100.9 million in GDP in the food and beverage merchant wholesalers industry that year and nearly $4.1 billion in GDP in architectural, engineering, and related services. In 2019, the top five industries whose GDP was most affected by their association with Canada’s oil and gas sector included:
- Architectural, engineering, and related services: $4.1 billion
- Machinery, equipment, and supplies merchant wholesalers: $3.4 billion
- Banking and other depository credit intermediation: $2.1 billion
- Computer systems design and related services: $1.7 billion
- Electrical power generation, transmission, and distribution: $1.5 billion
Source: Statistics Canada
16.
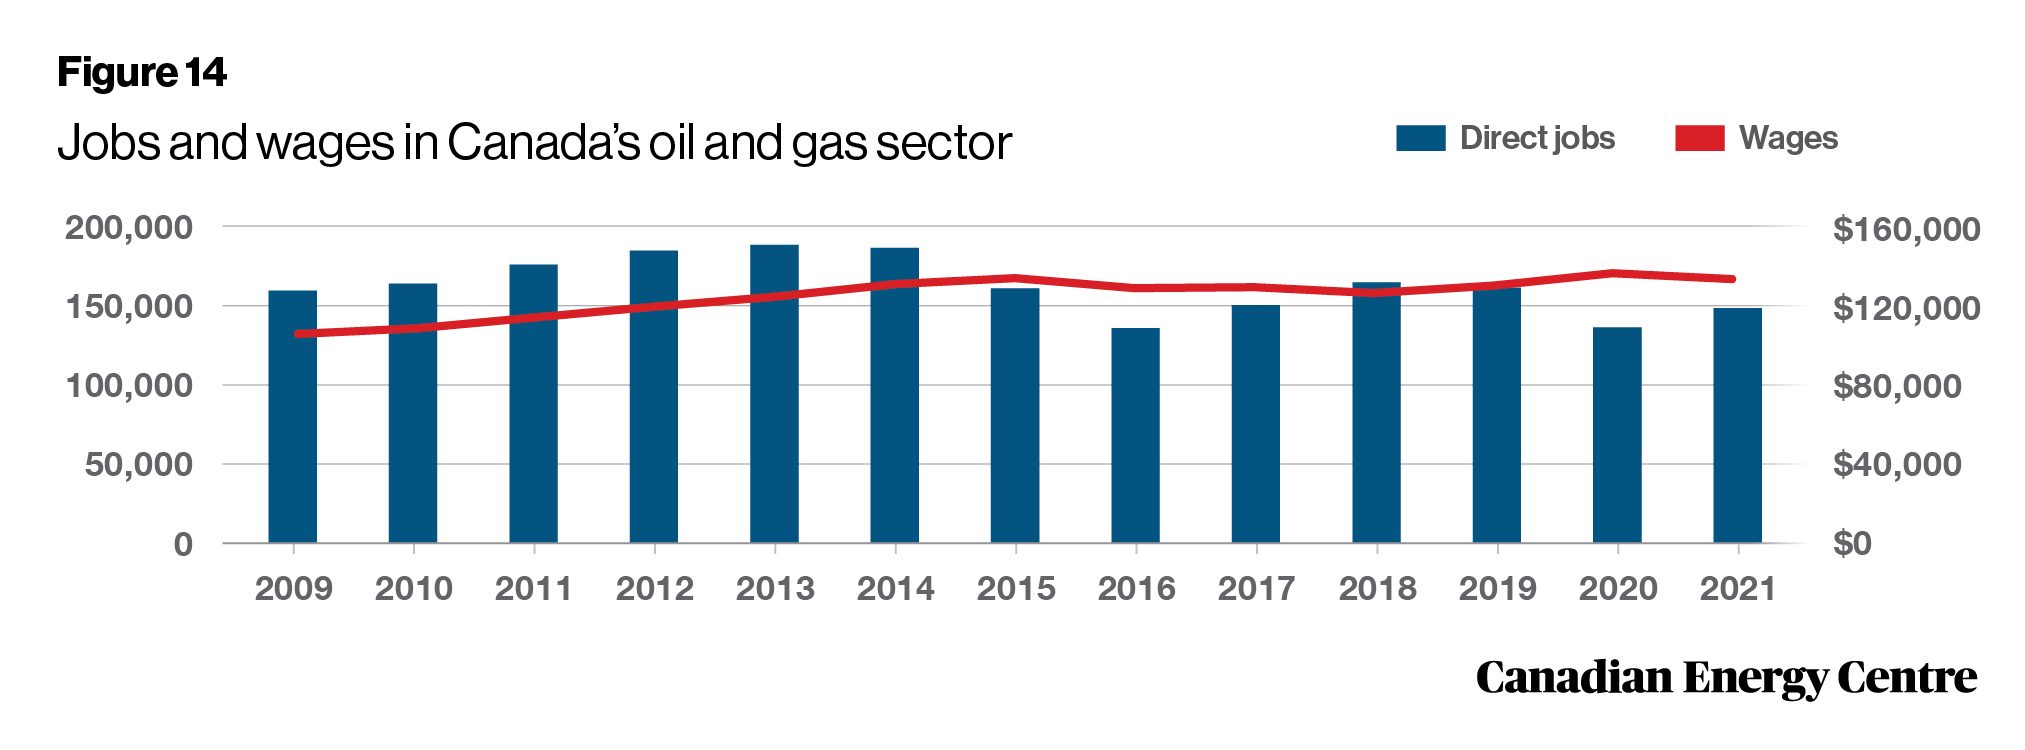
Employment and wages in the oil and gas sector remain high
In 2021, the oil and gas sector directly employed 147,371 Canadians. The number of direct jobs in the sector rose from 158,483 in 2009 to 185,393 in 2014, then fell to 134,939 in 2016, the result of the sharp decline in energy prices, before rising to 160,379 in 2019 as energy prices gradually recovered. The onslaught of COVID-19 in 2020 saw oil and gas sector jobs fall back to 135,475, before recovering to 147,371 in 2021. The average salary of a worker in the Canadian oil and gas sector in 2021 was $133,293. The average salary for a worker in the sector had risen from $103,448 in 2009 to $133,776 in 2015, before leveling off to $129,716 in 2019 due to the energy price slump. However, between 2009 and 2021, the average annual wage of a worker in the Canadian oil and gas sector increased by nearly 29 per cent.
Source: Statistics Canada
Social and Governance
17.
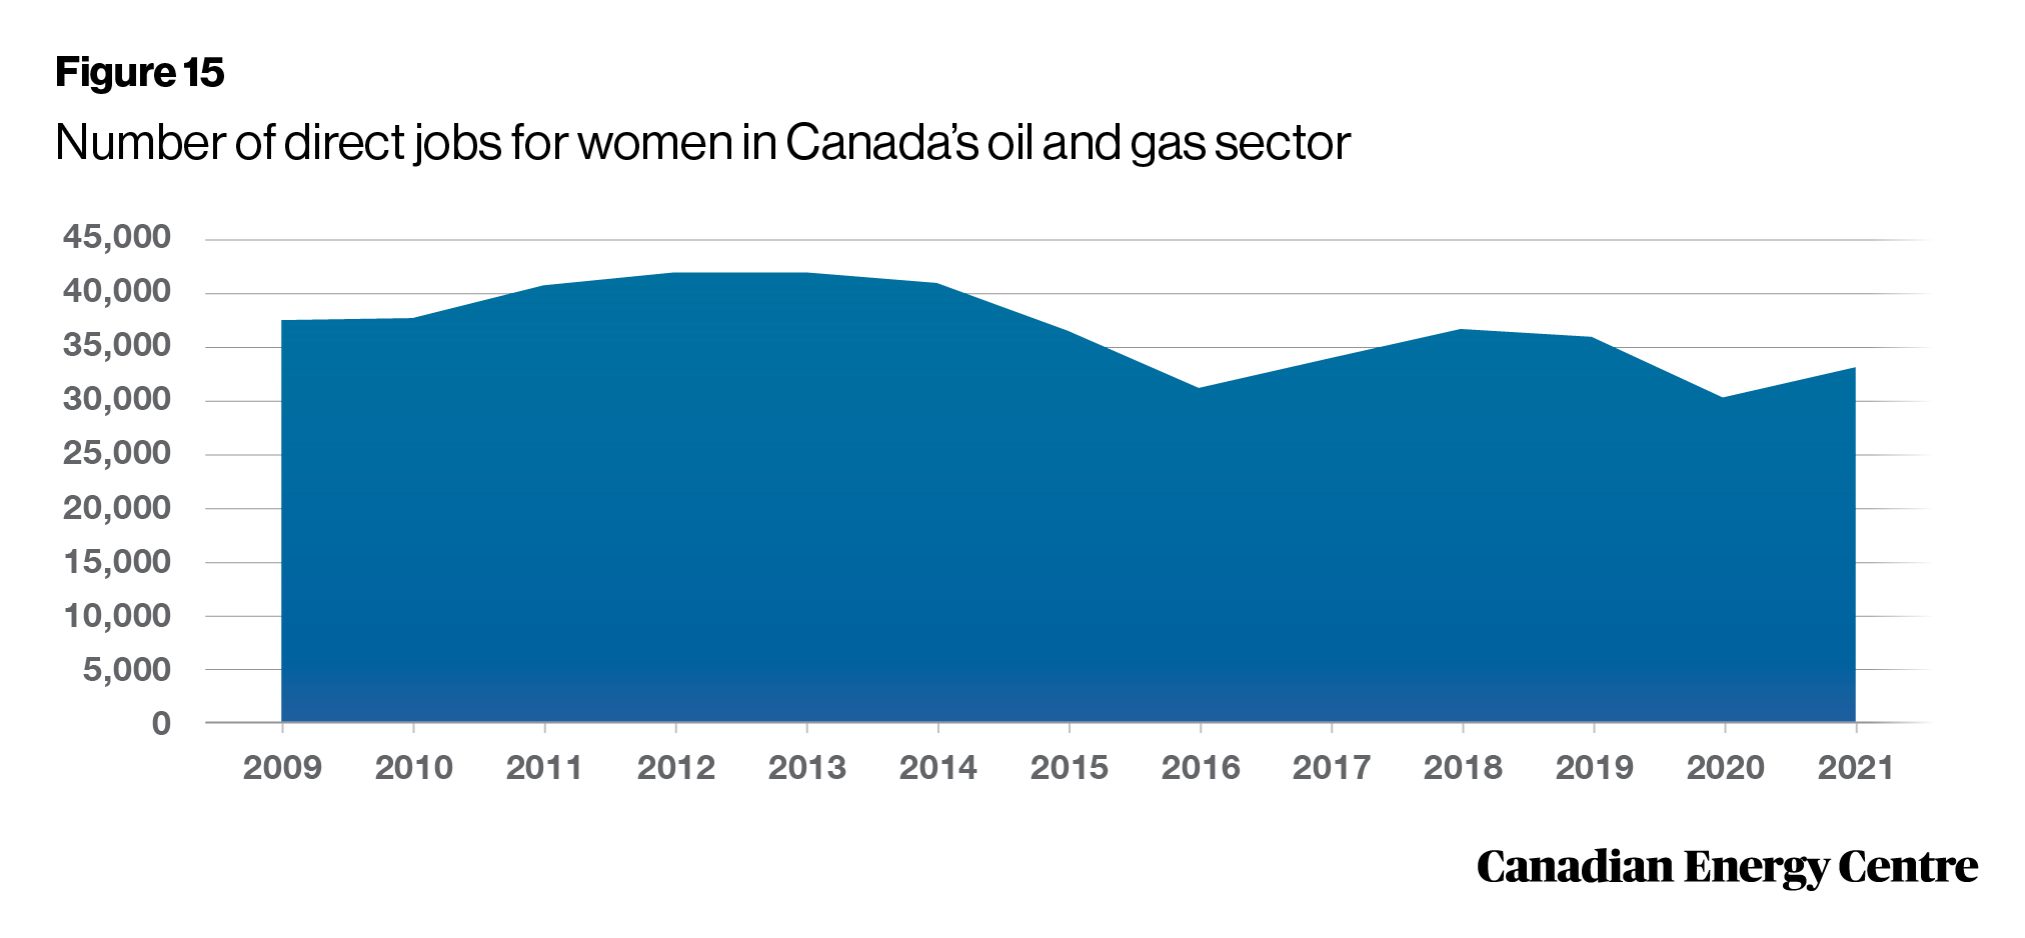
Women’s employment in Canada’s oil and gas sector is recovering
The number of females employed in the oil and gas sector reached a high of 42,440 in 2013, dipping to 30,285 in 2020 due to COVID-19, and then recovering somewhat to 33,068 in 2021. Between 2009 and 2021, the average wage for a female worker in the Canadian oil and gas industry increased by over 53 per cent.
Source: Statistics Canada
18.
Diversity increasing in the oil and gas sector
Between 2009 and 2021, workers in the Canada’s oil and gas sector who identified as Indigenous increased by nearly 17 per cent. Between 2009 and 2021, the average salary of an Indigenous person employed in Canada’s oil and gas sector increased by over 39 per cent.

Source: Statistics Canada
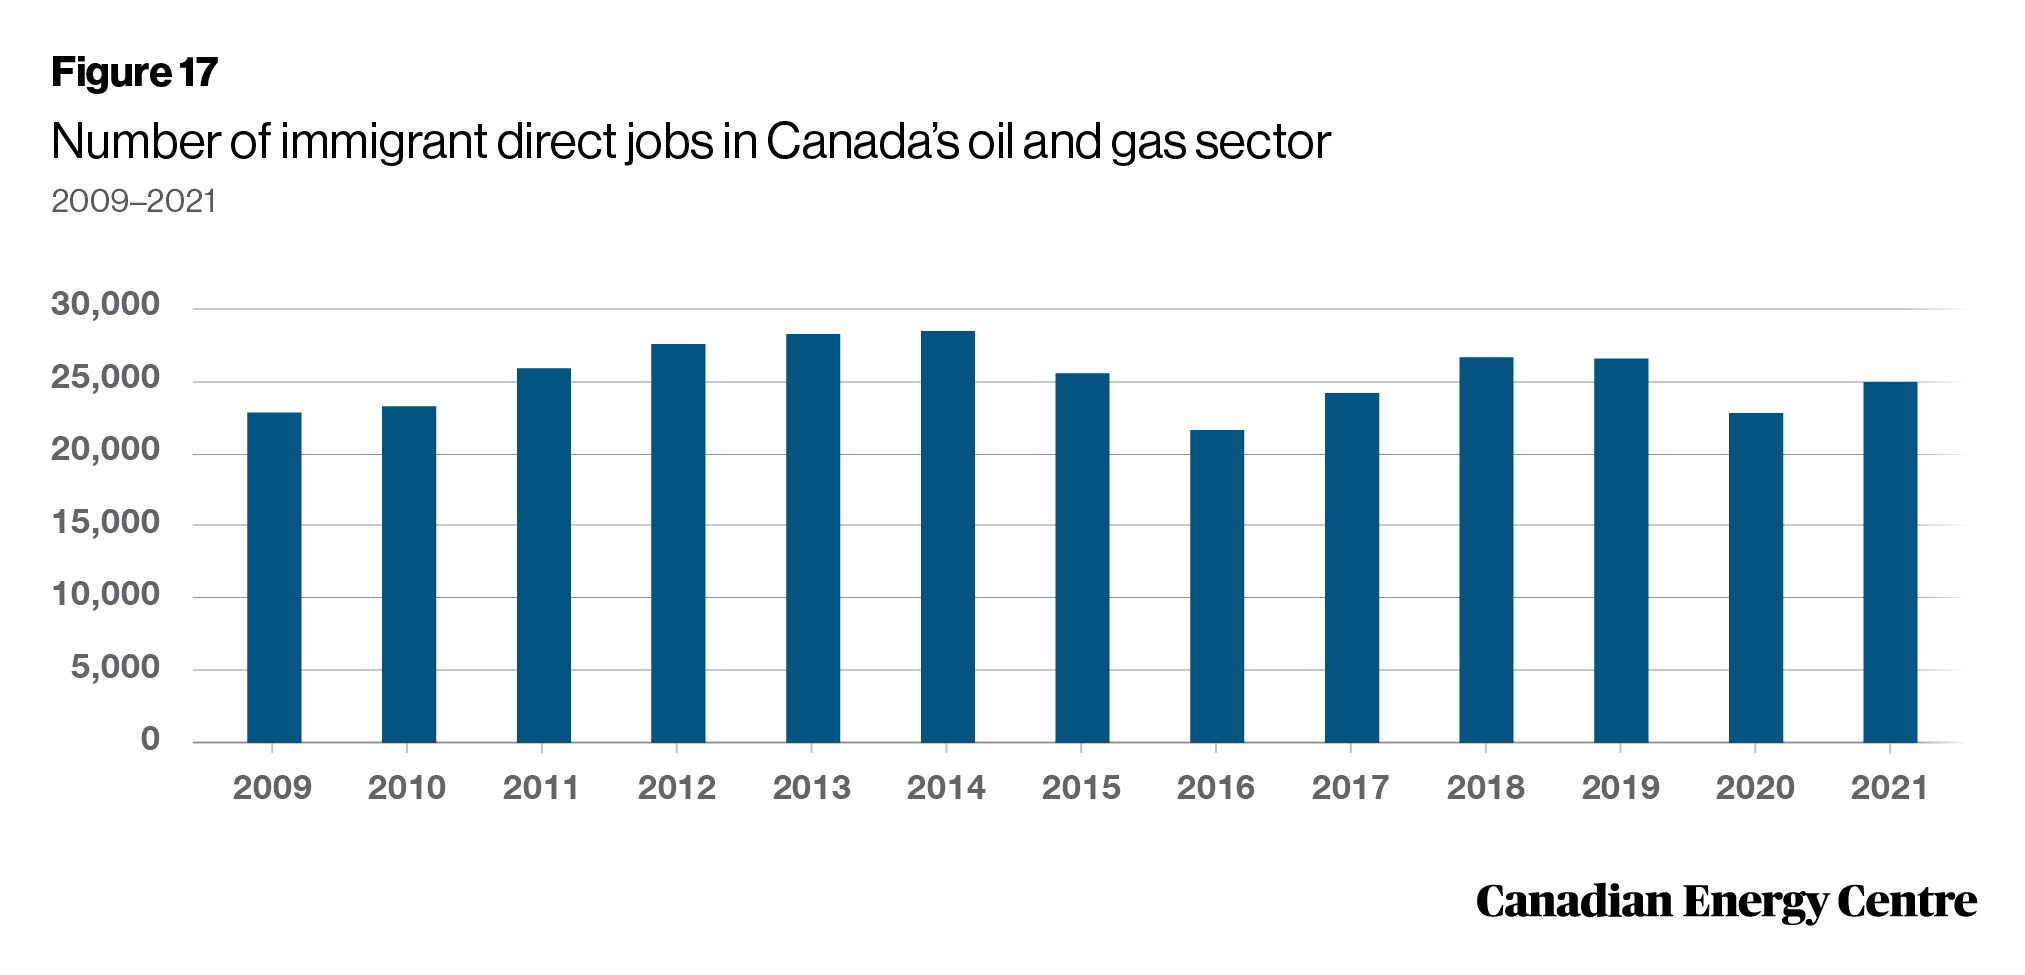
19.
More new Canadians working in the oil and gas sector over the long term
In 2021, 24,931 immigrants were directly employed in the Canadian oil and gas sector. The number of immigrants employed in the oil and gas industry reached 28,469 by 2014, declining to 21,622 in 2016 before recovering to 26,569 in 2019. Between 2009 and 2021, immigrant employment in the Canadian oil and gas sector increased by over 9 per cent. Between 2009 and 2021, the average wage and salary of an immigrant employed in the Canadian oil and gas sector increased by nearly 25 per cent.
Source: Statistics Canada
Carbon Capture, Utilization and Storage (CCUS)
20.
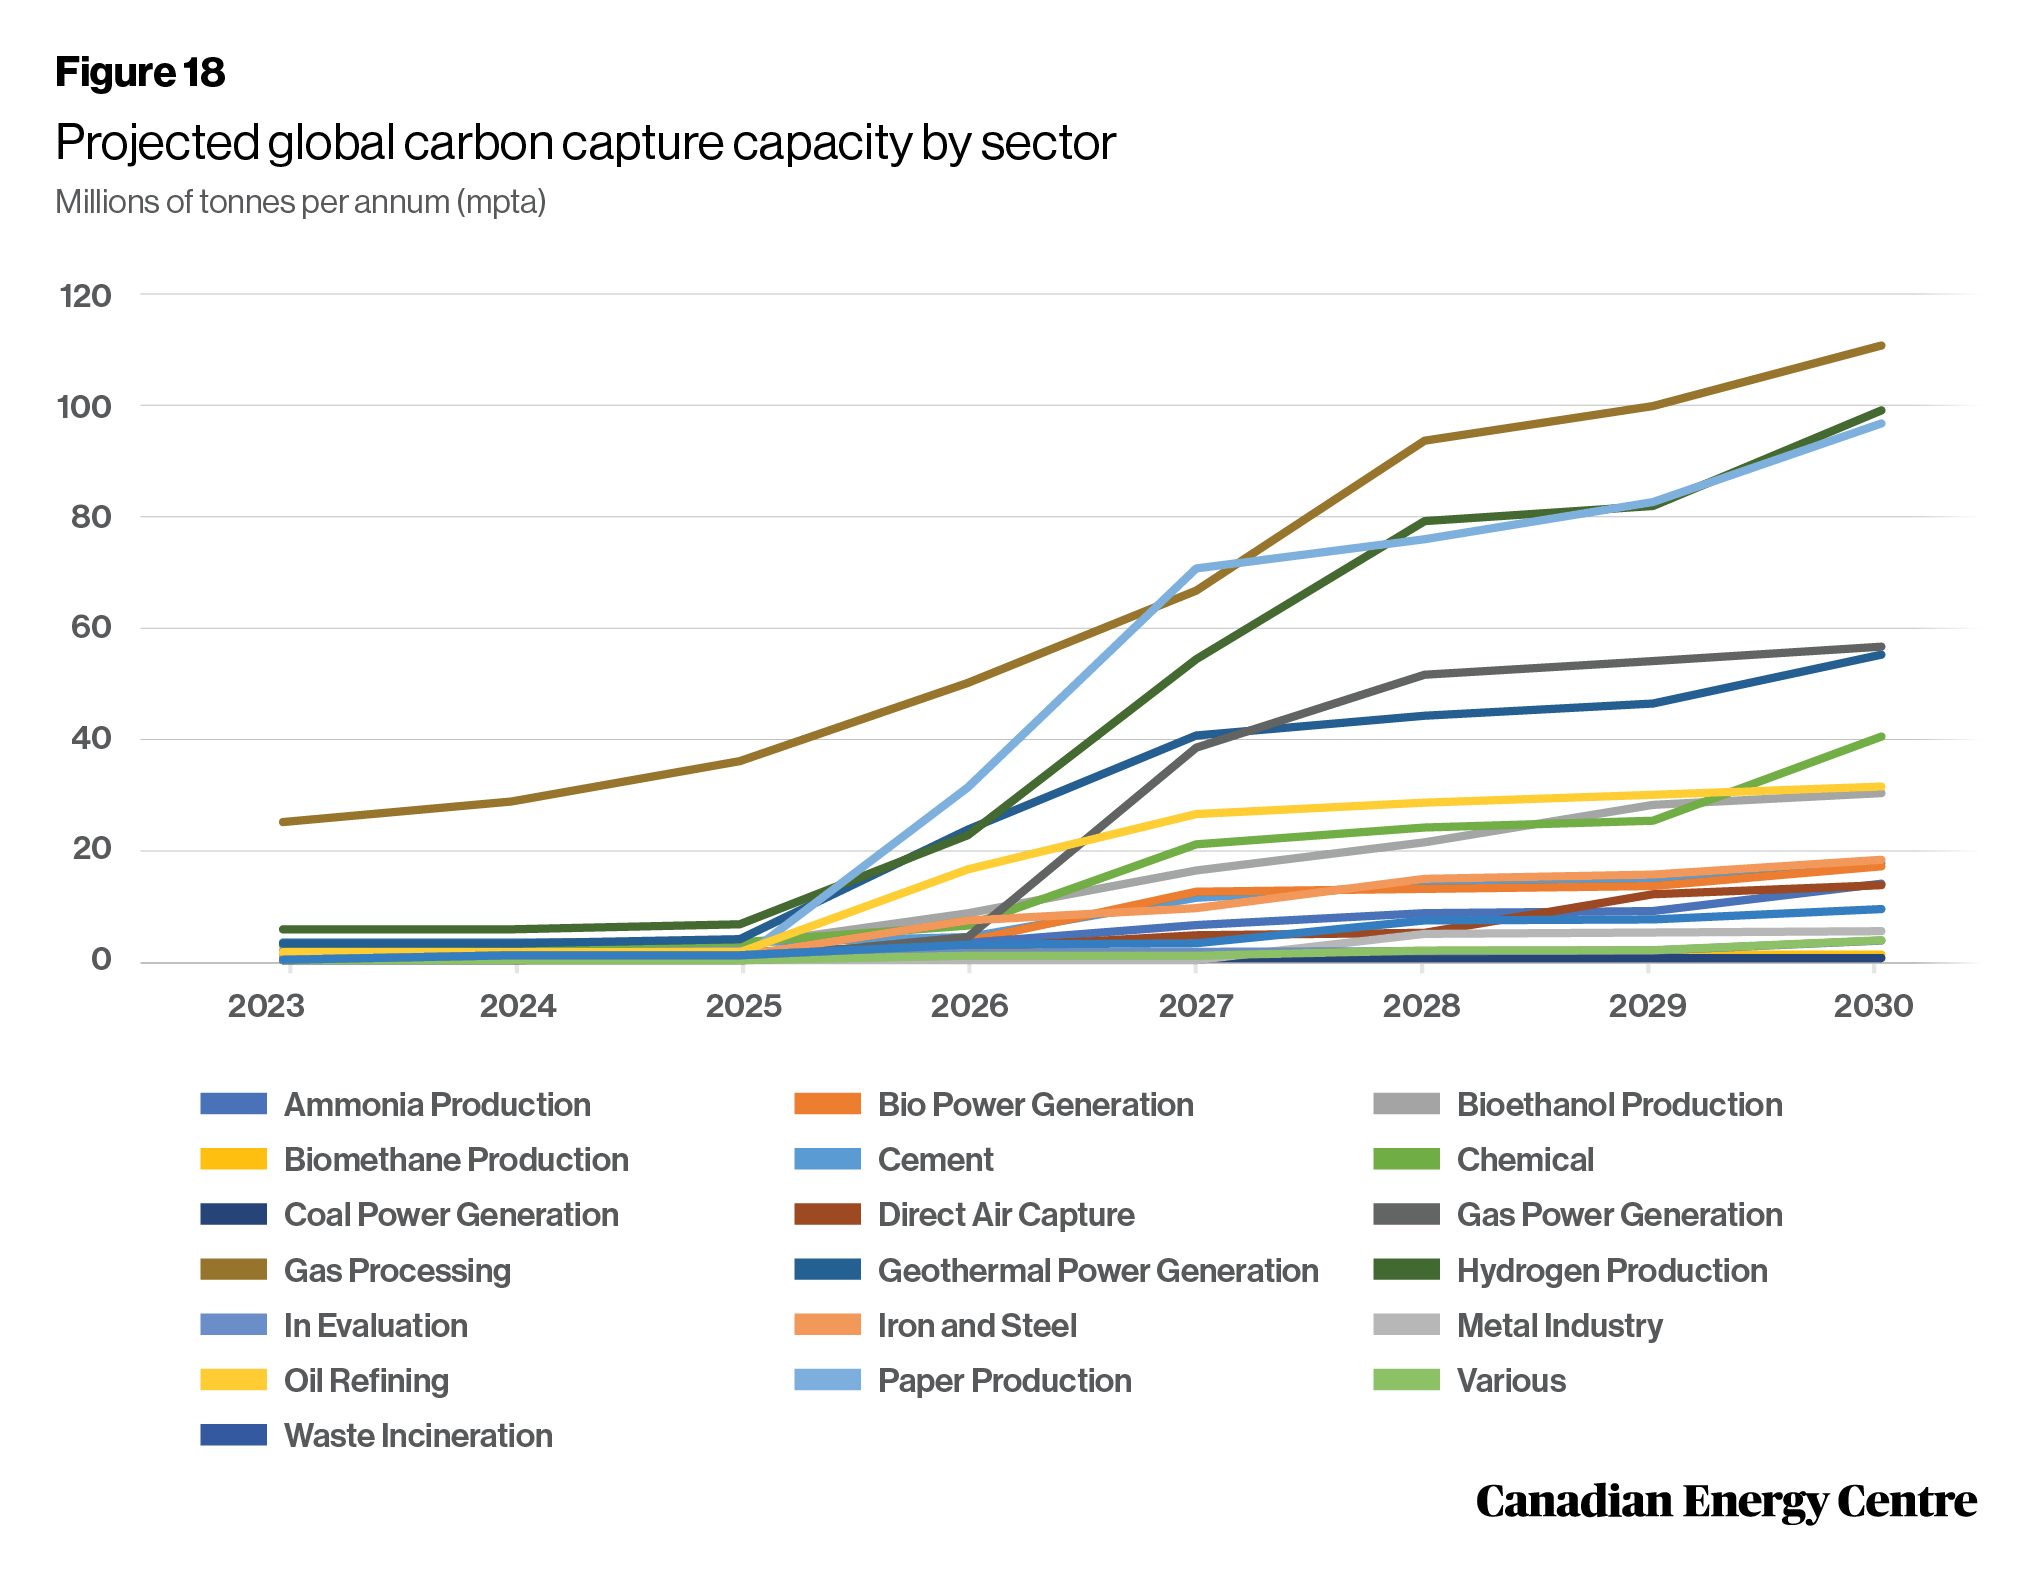
Carbon Capture, Utilization and Storage (CCUS) growing across the world
At the end of 2022, there were 65 commercial carbon capture, utilization and storage (CCUS) projects in operation globally capable of capturing nearly 41 million tonnes per annum (mtpa) of CO2 across various industries, including the oil and gas sector. There are another 478 projects in various stages of development around the world that will be capable of capturing roughly another 559 mtpa of CO2. These projects are in various stages of development: some are at the feasibility stage while others are in the concept and construction phases. If all projects move ahead as scheduled, by 2030 it is estimated that nearly 500 CCUS projects could be operating worldwide, having the ability to capture 623.0 mtpa of CO2. In fact, between 2023 and 2030, global carbon capture capacity could grow from 43.5 mtpa to 623.0 mtpa, an increase of over 1,332 per cent.
Source: Derived from Rystad Energy
21.
Projected Carbon Capture, Utilization and Storage (CCUS) in Canada has a bright future
Global carbon capture capacity and worldwide spending trends to date underline the fact that the future is bright for Canadian investments in CCUS. Assuming that appropriate government policies and regulations are put in place, Canada can expect to see further project announcements and increased investment in the technology. Canada will likely emerge as a CCUS heavyweight given the prevailing policy environment and the existential need for oil sands players to decarbonize. Rystad Energy estimates that Canada alone could account for around 20 per cent of cumulative carbon capture demand between 2023 and 2030.

Source: Derived from Rystad Energy
Nuclear and Renewables
22.
Nuclear energy a stable source of electricity production in Canada
Nuclear power plants have been producing electricity in Canada since the 1960s. As of 2022, four nuclear power plants operate in Canada: three in Ontario and one in New Brunswick. Canada’s share of nuclear electricity production has remained relatively stable over the past few decades. In 1990, nuclear energy accounted for about 14.8 per cent of Canada’s electricity production; by 2021, this share had decreased only slightly to about 14.3 per cent.

Source: International Atomic Energy Agency
23.
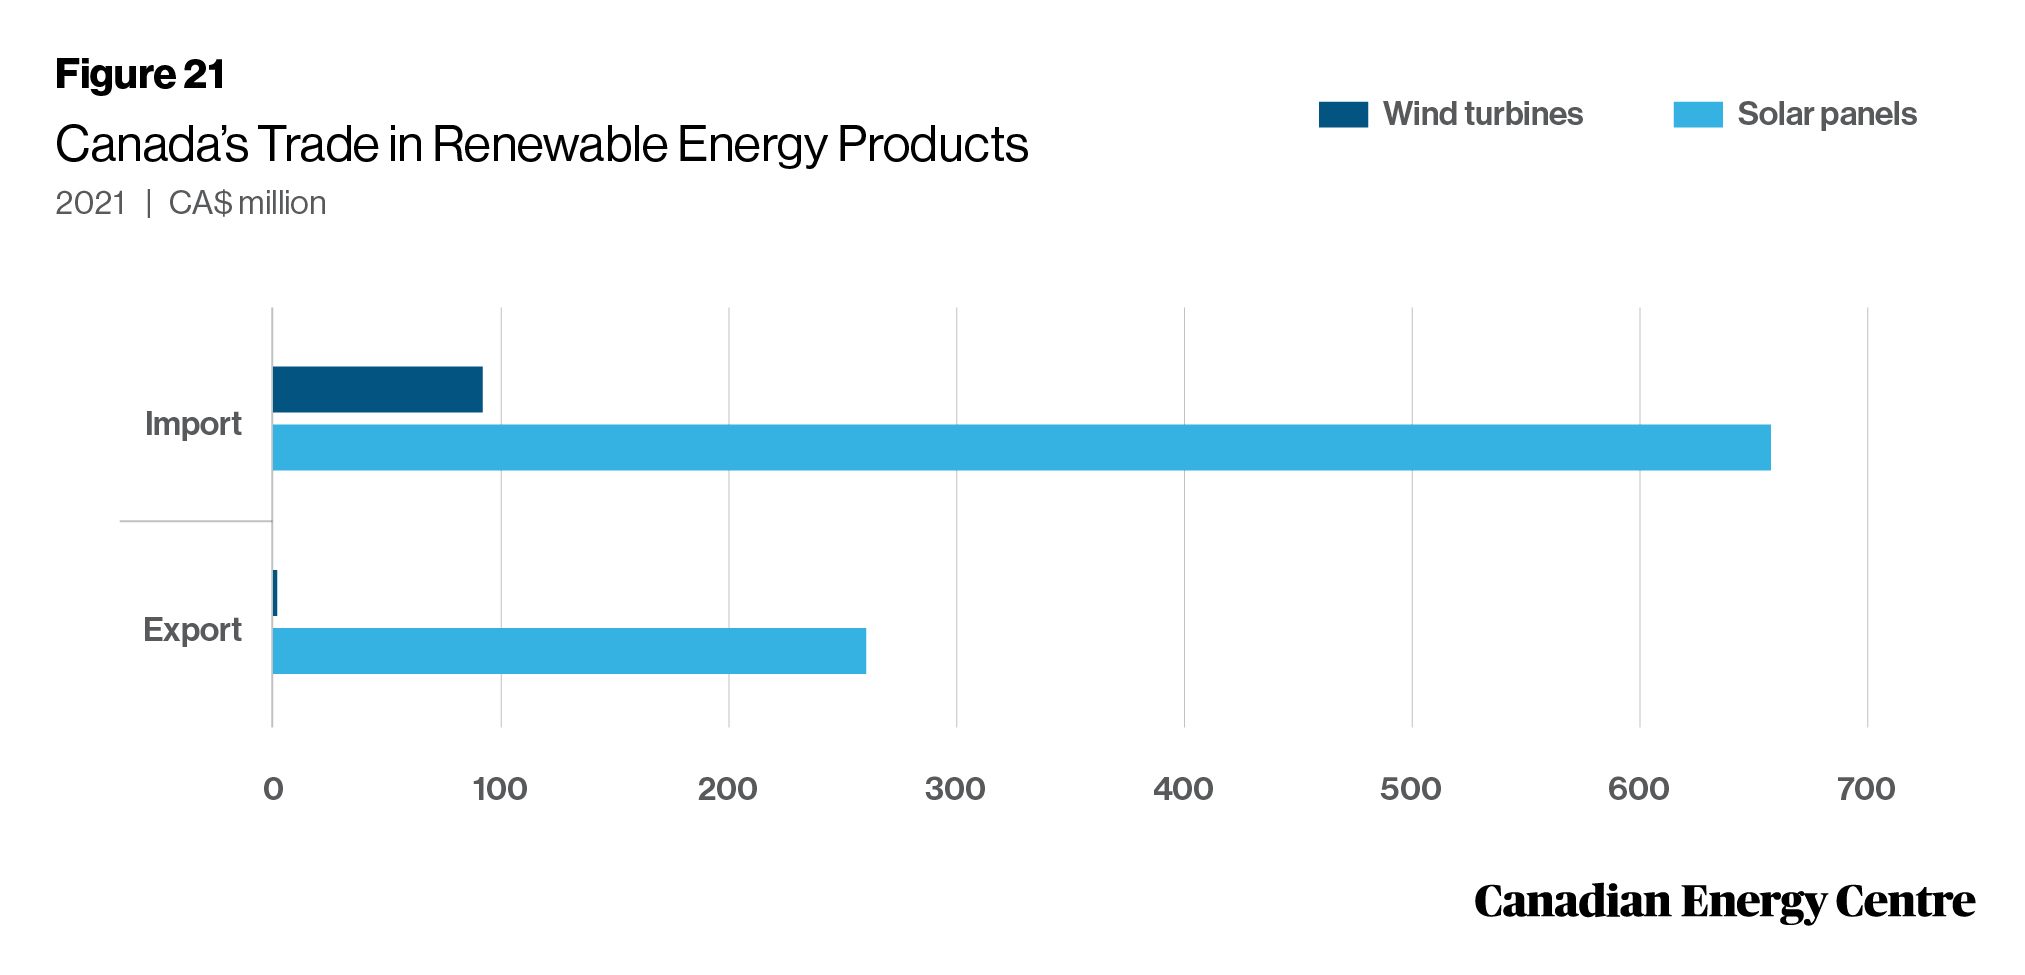
Canada’s trade in renewable products is modest
Trade is an essential component of Canada’s economic activity, accounting for about two-thirds of the economy and employing 3.3 million people. In 2021, Canada imported solar panel products with a value of CAN$653 million and wind turbine products with a value of CAN$91 million. The value of the solar panels and wind turbines Canada imported was much higher than the CAN$260 million export value for both products.
Source: Government of Canada, Trade Data Online
Liquefied Natural Gas (LNG)
24.
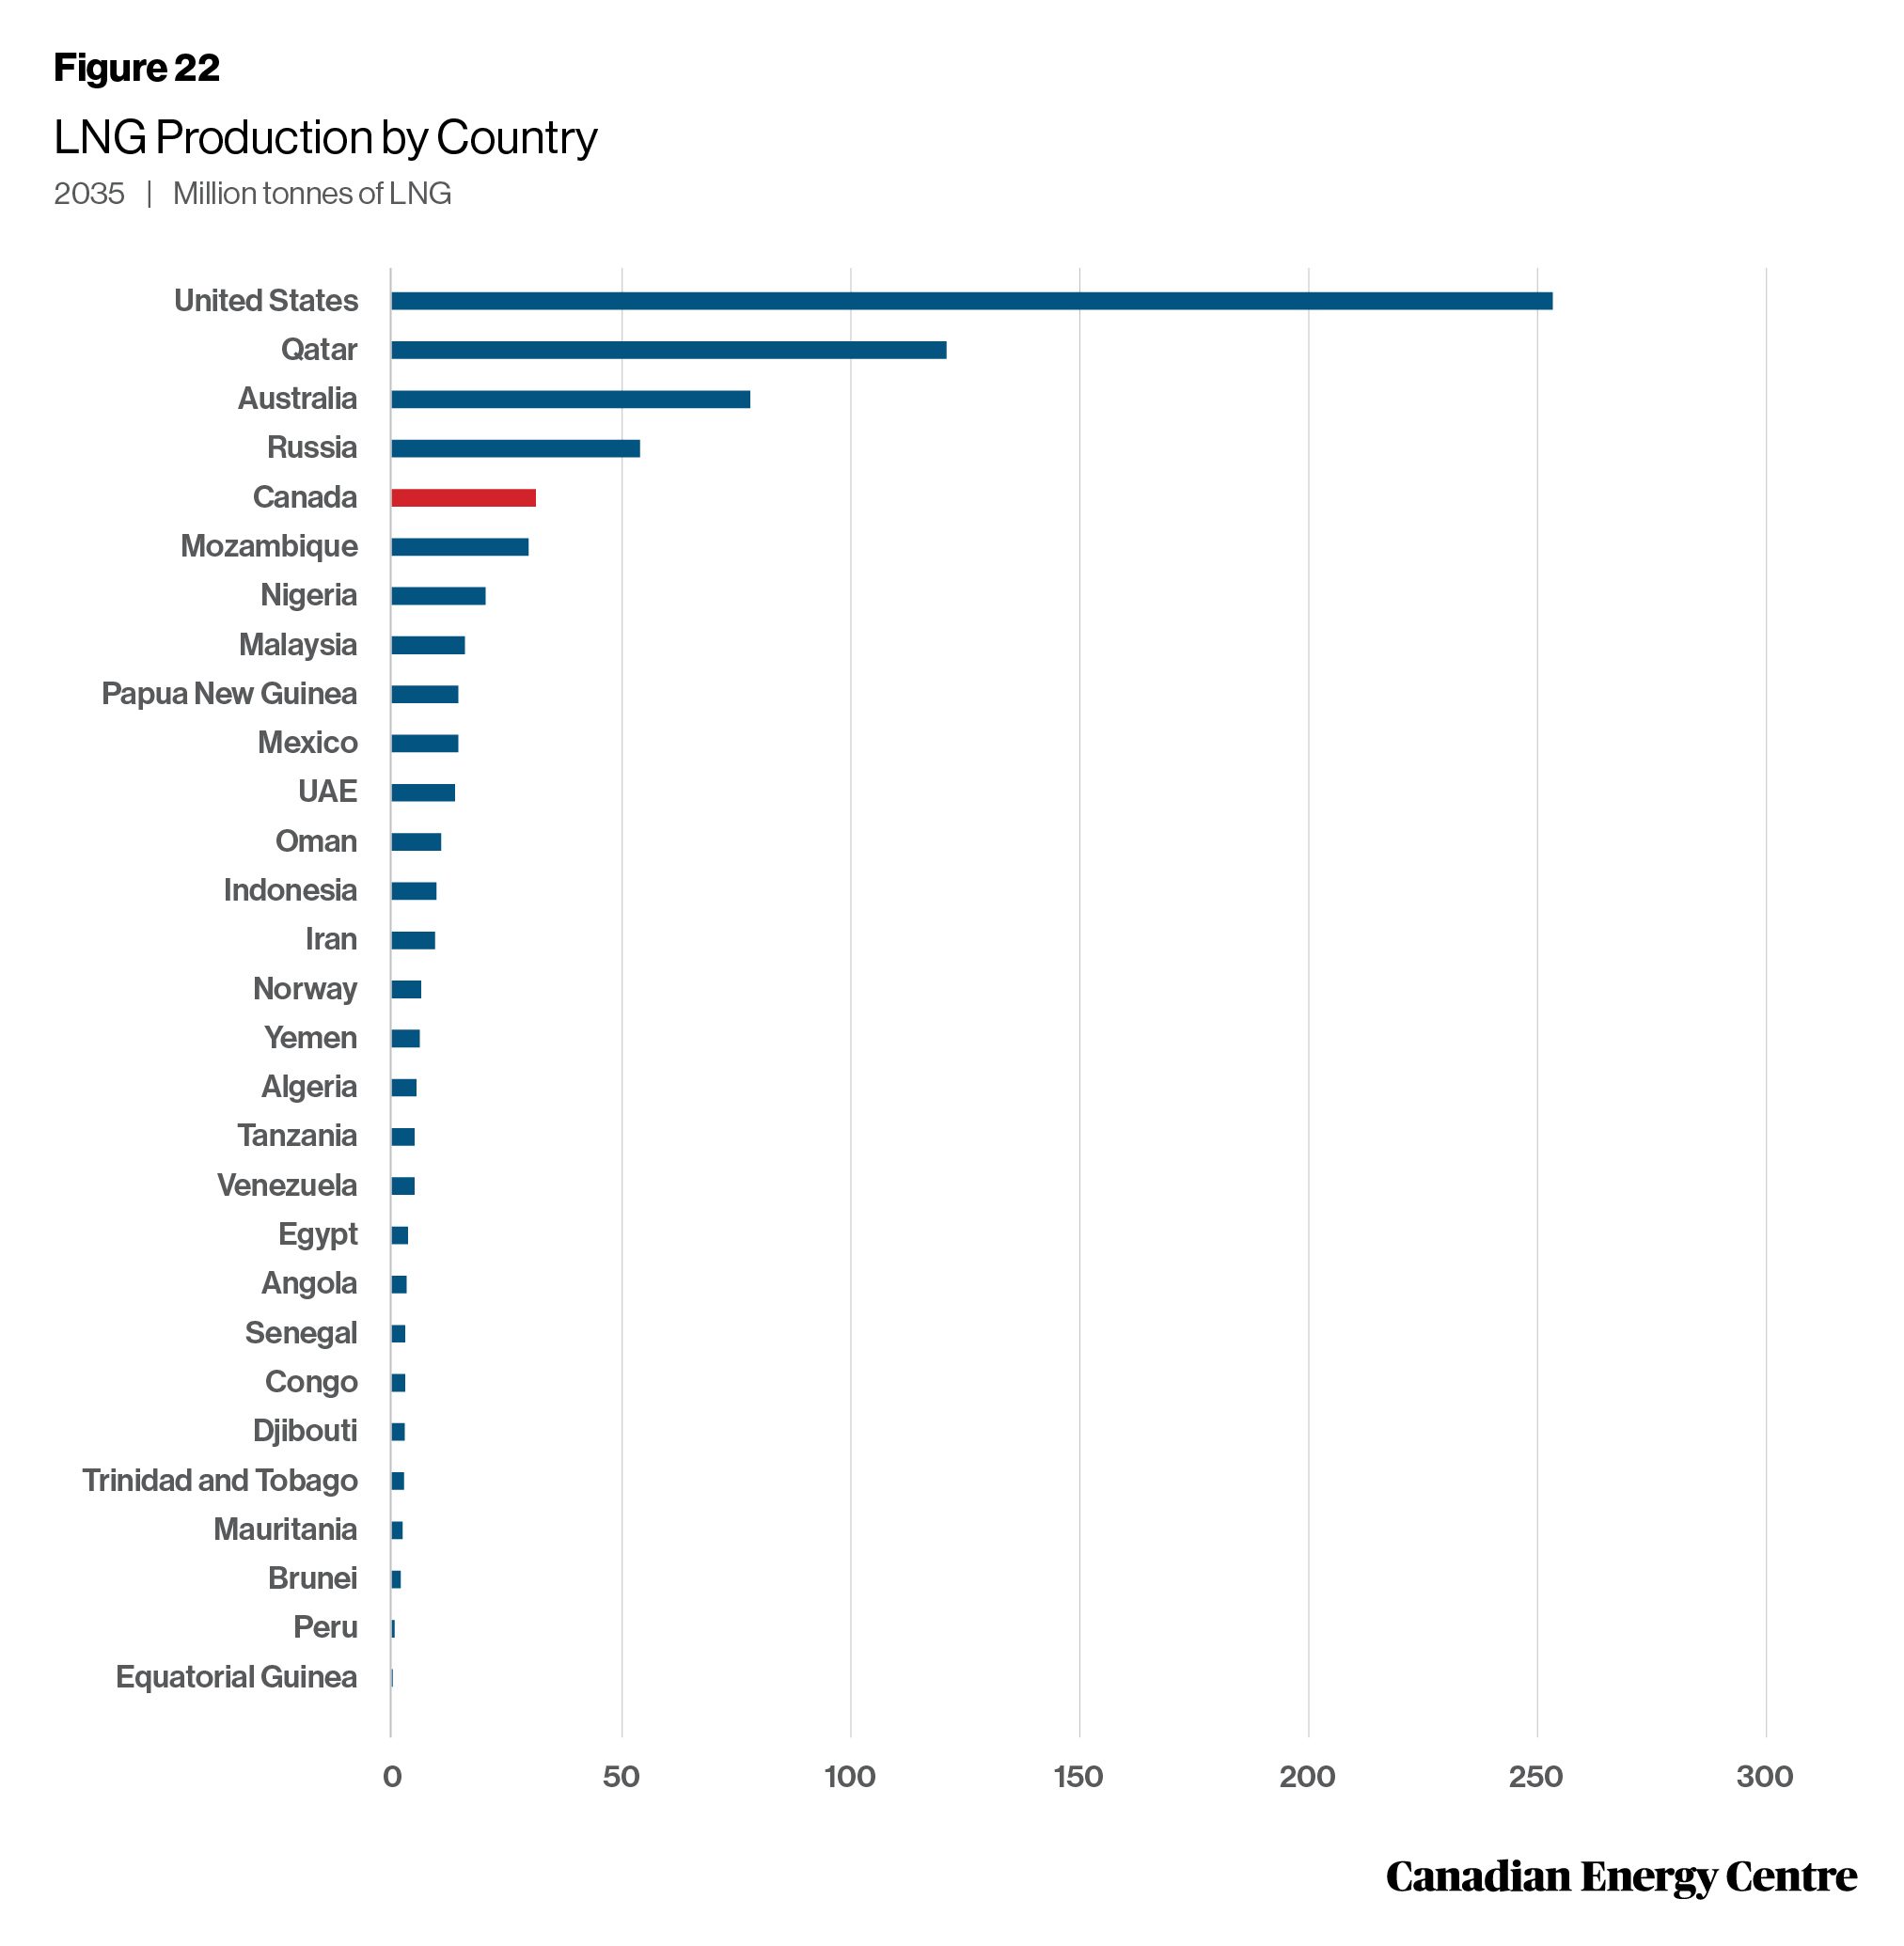
Global LNG production projected to rise
Global liquefied natural gas (LNG) production is expected to reach nearly 720 million tonnes by 2035. That year the United States is projected to be the world’s leading LNG producer at 259 million tonnes, followed by Qatar at 121 million tonnes, and Australia at 78 million tonnes. Russian LNG supply was expected to grow to 54 million tonnes by 2035, but this is now in question, leaving opportunities for countries such as Canada to fill the void. In fact, by 2035, Canada could be the fifth largest LNG producer at nearly 33 million tonnes of LNG.
Source: Derived from Rystad Energy
25.
Canadian LNG exports could help reduce global emissions
Asia is a significant source of CO2 emissions. Canadian LNG exports can help in reducing emissions from the Asian energy mix. If Canada increases its LNG export capacity to Asia, by 2050 net global emissions could decline by 188 million tonnes of CO2 equivalent per year. That would have the annual impact of taking 41 million cars off the road.

CEC Research Briefs
Canadian Energy Centre (CEC) Research Briefs are contextual explanations of data as they relate to Canadian energy. They are statistical analyses released periodically to provide context on energy issues for investors, policymakers, and the public. The source of profiled data depends on the specific issue. This research brief is a compilation of previous Fact Sheets and Research Briefs released by the centre in 2023. Sources can be accessed in the previously released reports. All percentages in this report are calculated from the original data, which can run to multiple decimal points. They are not calculated using the rounded figures that may appear in charts and in the text, which are more reader friendly. Thus, calculations made from the rounded figures (and not the more precise source data) will differ from the more statistically precise percentages we arrive at using the original data sources.
About the author
This CEC Research Brief was compiled by Ven Venkatachalam, Director of Research at the Canadian Energy Centre.
Acknowledgements
The author and the Canadian Energy Centre would like to thank and acknowledge the assistance of an anonymous reviewer for the review of this paper.
Creative Commons Copyright
Research and data from the Canadian Energy Centre (CEC) is available for public usage under creative commons copyright terms with attribution to the CEC. Attribution and specific restrictions on usage including non-commercial use only and no changes to material should follow guidelines enunciated by Creative Commons here: Attribution-NonCommercial-NoDerivs CC BY-NC-ND.