To sign up to receive the latest Canadian Energy Centre research to your inbox email: [email protected]
Download the PDF here
Download the charts here
Overview
Since the energy price downturn in late 2014, and the imposition of increased regulatory burdens and delays by the federal government, beginning in 2015, upstream oil and gas capital expenditures (capex) in Canada has lagged.
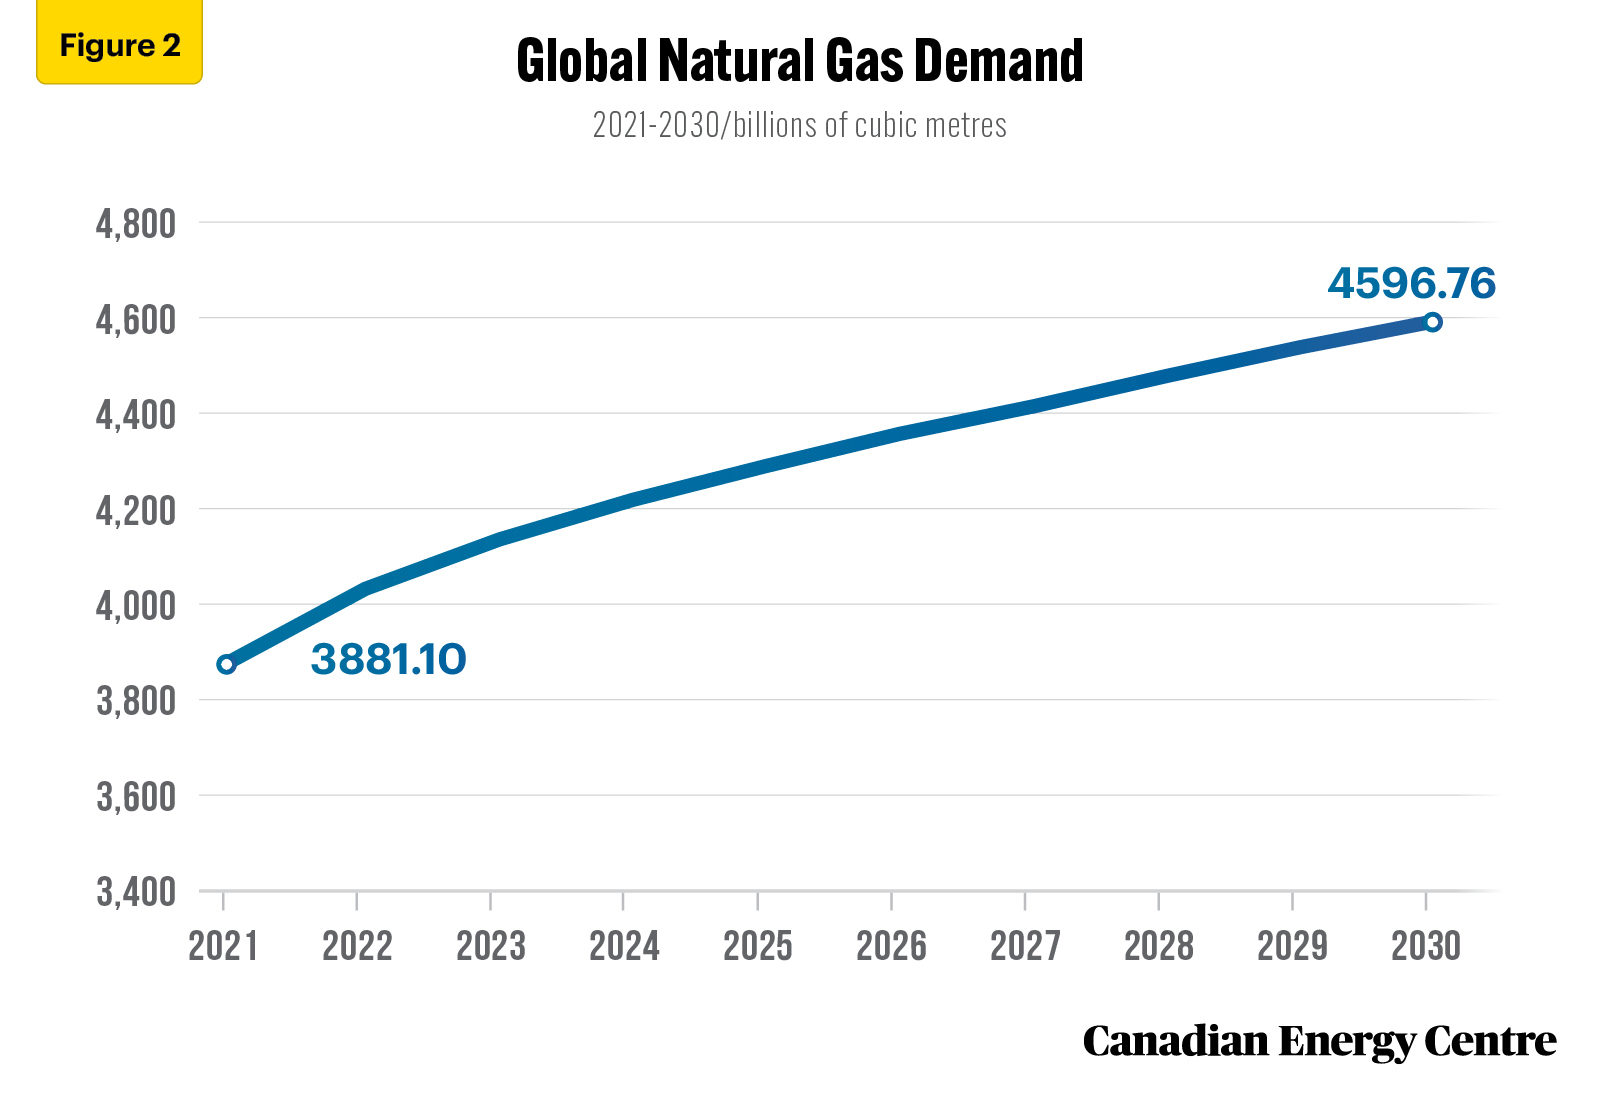
However, there are now signs that Canadian upstream oil and gas capex will recover and expand due to a higher price environment; combined with rising global energy demand (see Figures 1 and 2); increased attention being paid to energy security; and an emphasis on maintaining high environmental standards.

Source: Derived from the Rystad Energy Upstream Energy Transition Risk Dashboard
Using data drawn from the Rystad Energy UCube and the Upstream Energy Transition Risk Dashboard, this Fact Sheet examines projected Canadian upstream capex over the next decade under a higher energy price environment (the Rystad Energy mid-case). The upstream capex numbers are expressed in nominal dollars and assume a 2.5 per cent inflation rate and a 10 per cent discount rate.
The written content in this report was prepared by the Canadian Energy Centre (CEC) and does not represent the views of Rystad Energy.
Source: Derived from the Rystad Energy Upstream Energy Transition Risk Dashboard
Background on Rystad Energy UCube, the Upstream Energy Transition Risk Dashboard, and energy price assumptions
Rystad Energy is an independent energy research company providing data, analytics and consultancy services to clients around the globe.
UCube is Rystad Energy’s global upstream database, including production and economics (costs, revenues, and valuations) for more than 80,000 assets, covering the portfolios of more than 3,500 companies.
The UCube data set is used to study all parts of the global exploration and production (E&P) activity value chain, including operational costs, investment (capex and opex), fiscal terms, and net cash flows for projects and companies, both globally and by country.
Through the Upstream Energy Transition Risk Dashboard, Rystad Energy has developed methods to quantify energy transition risk across energy producers and energy service companies, utilizing a bottom-up approach to decompose transition risk down to single asset, products and services lines. The focus is on value at risk, utilizing an asset-based valuation framework to run alternative future scenarios on energy demand, energy prices and emission costs (Rystad Energy, 2022b).
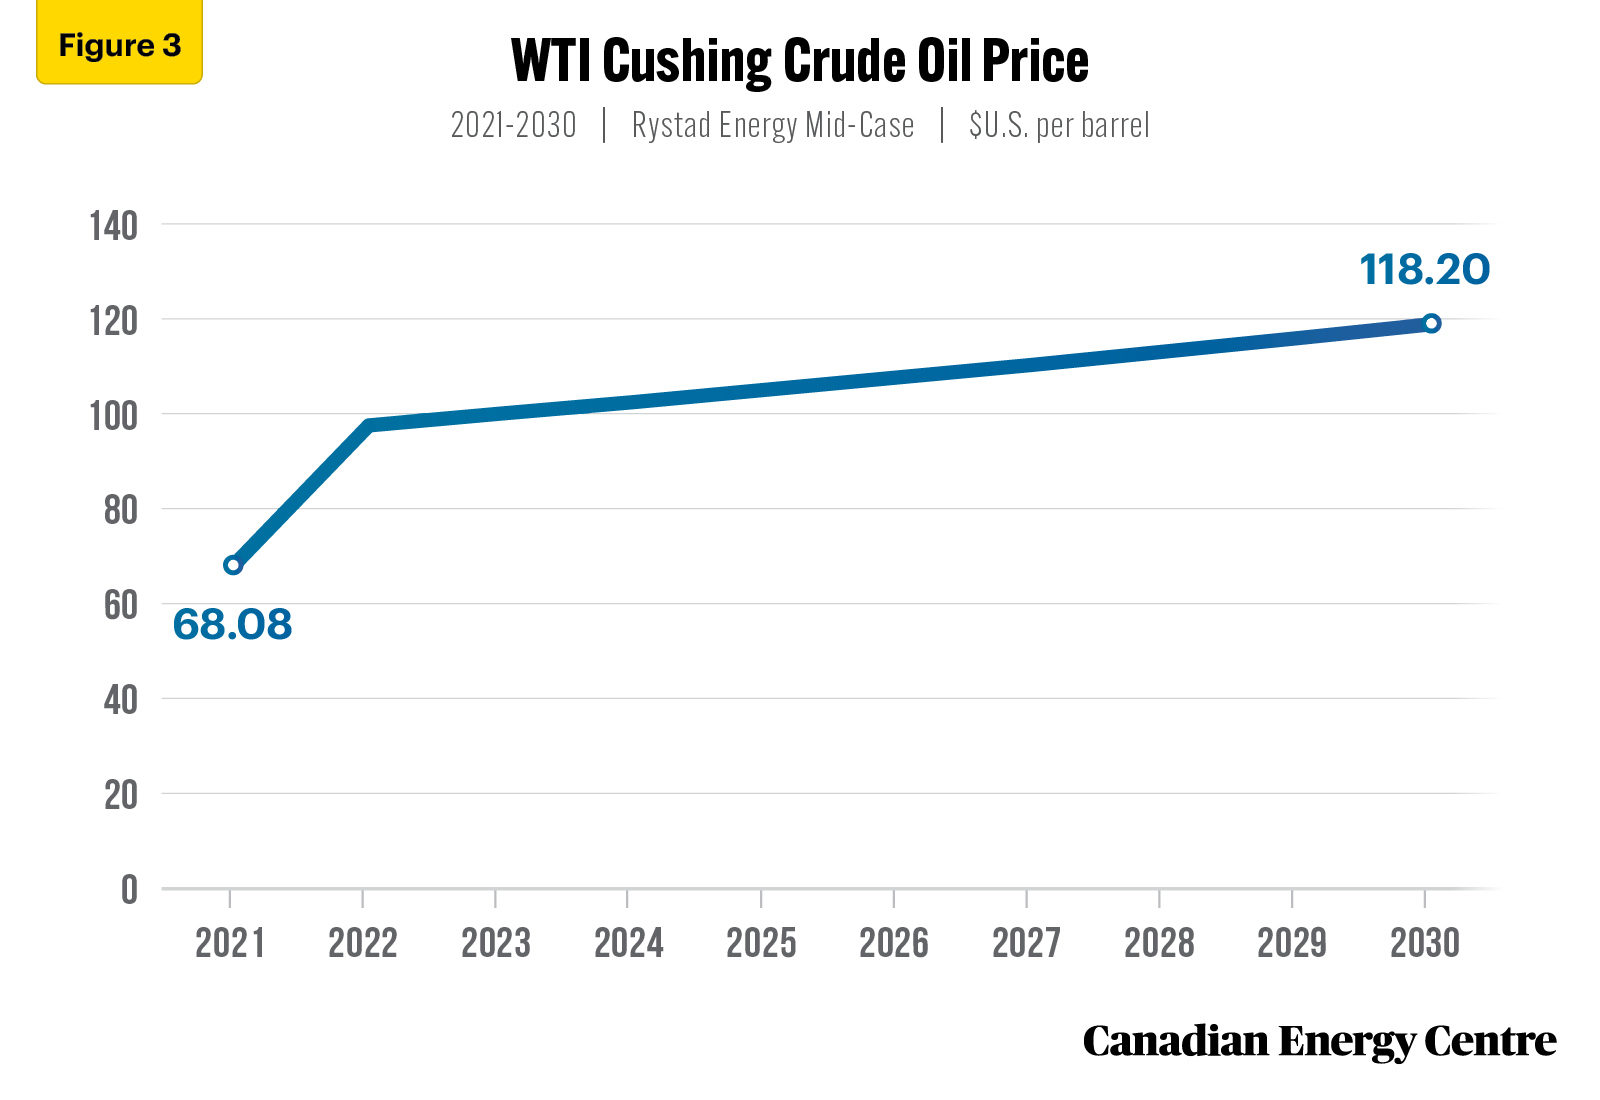
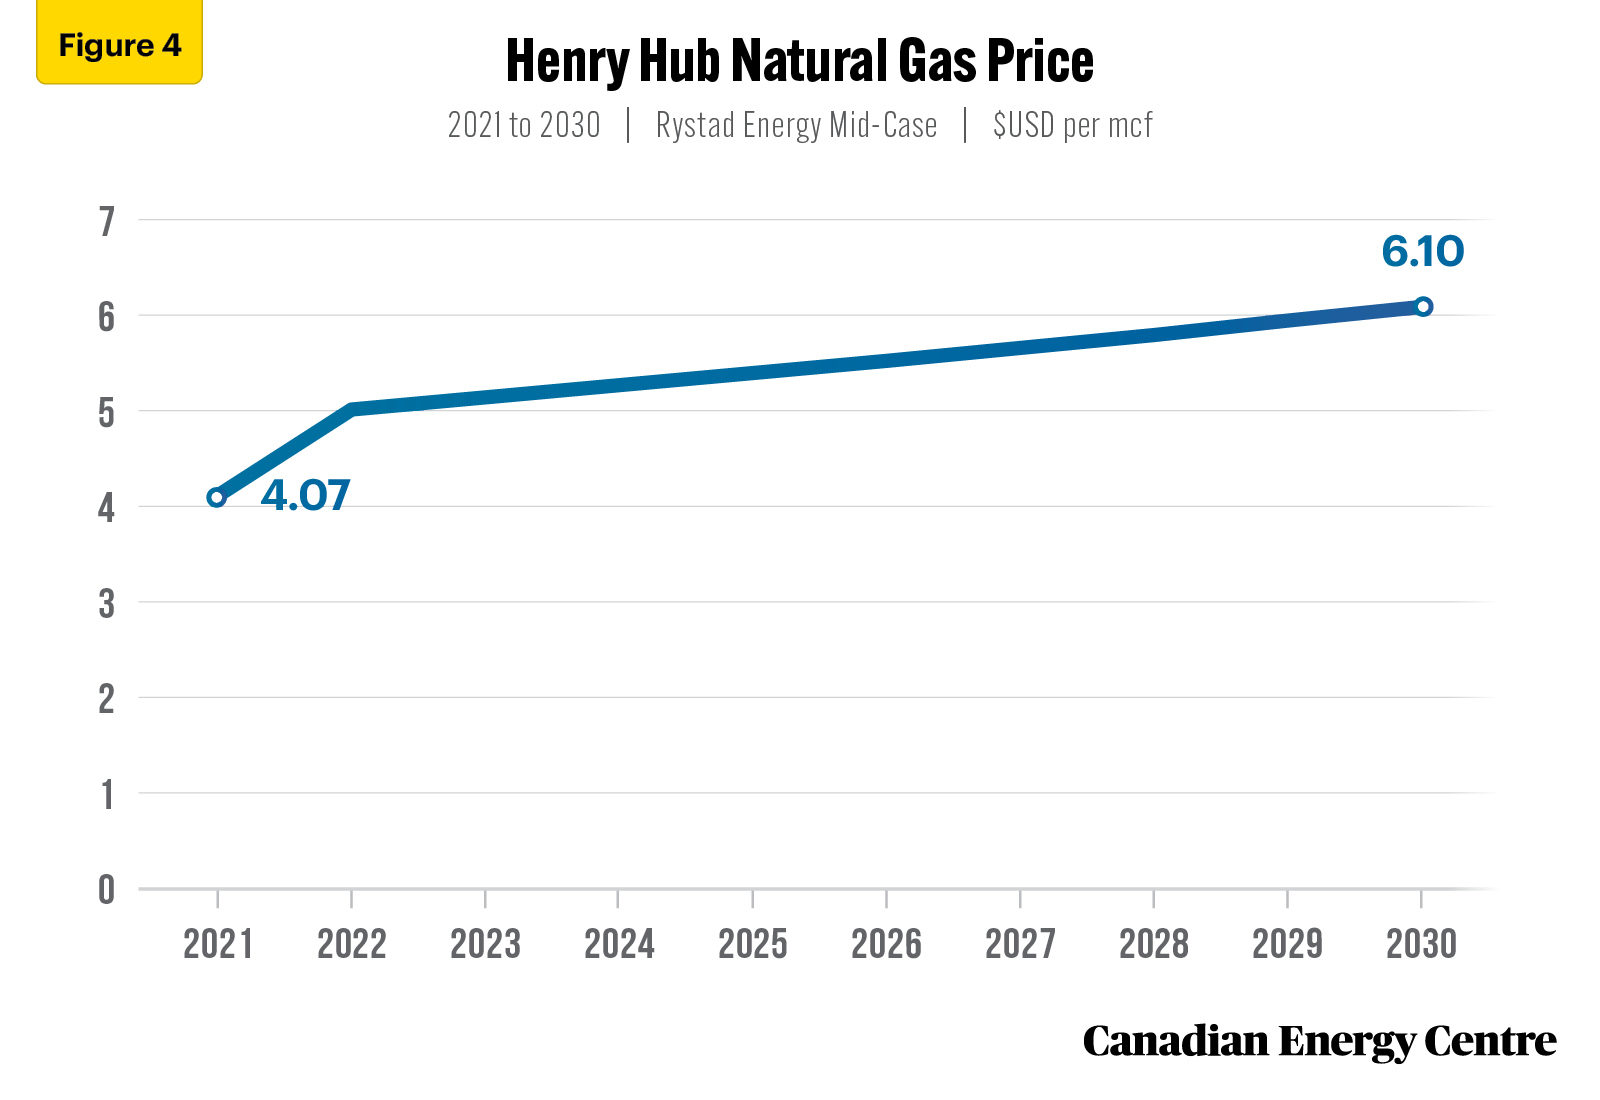
Under the Rystad Energy mid-case, WTI crude oil prices are projected to average $103.38 U.S. per barrel between 2021 and 2030. Natural gas prices are projected to average $5.39 U.S. per thousand cubic feet (mcf) between 2021 and 2030 (see Figures 3 and 4).
Source: Derived from the Rystad Energy UCube
Source: Derived from the Rystad Energy UCube
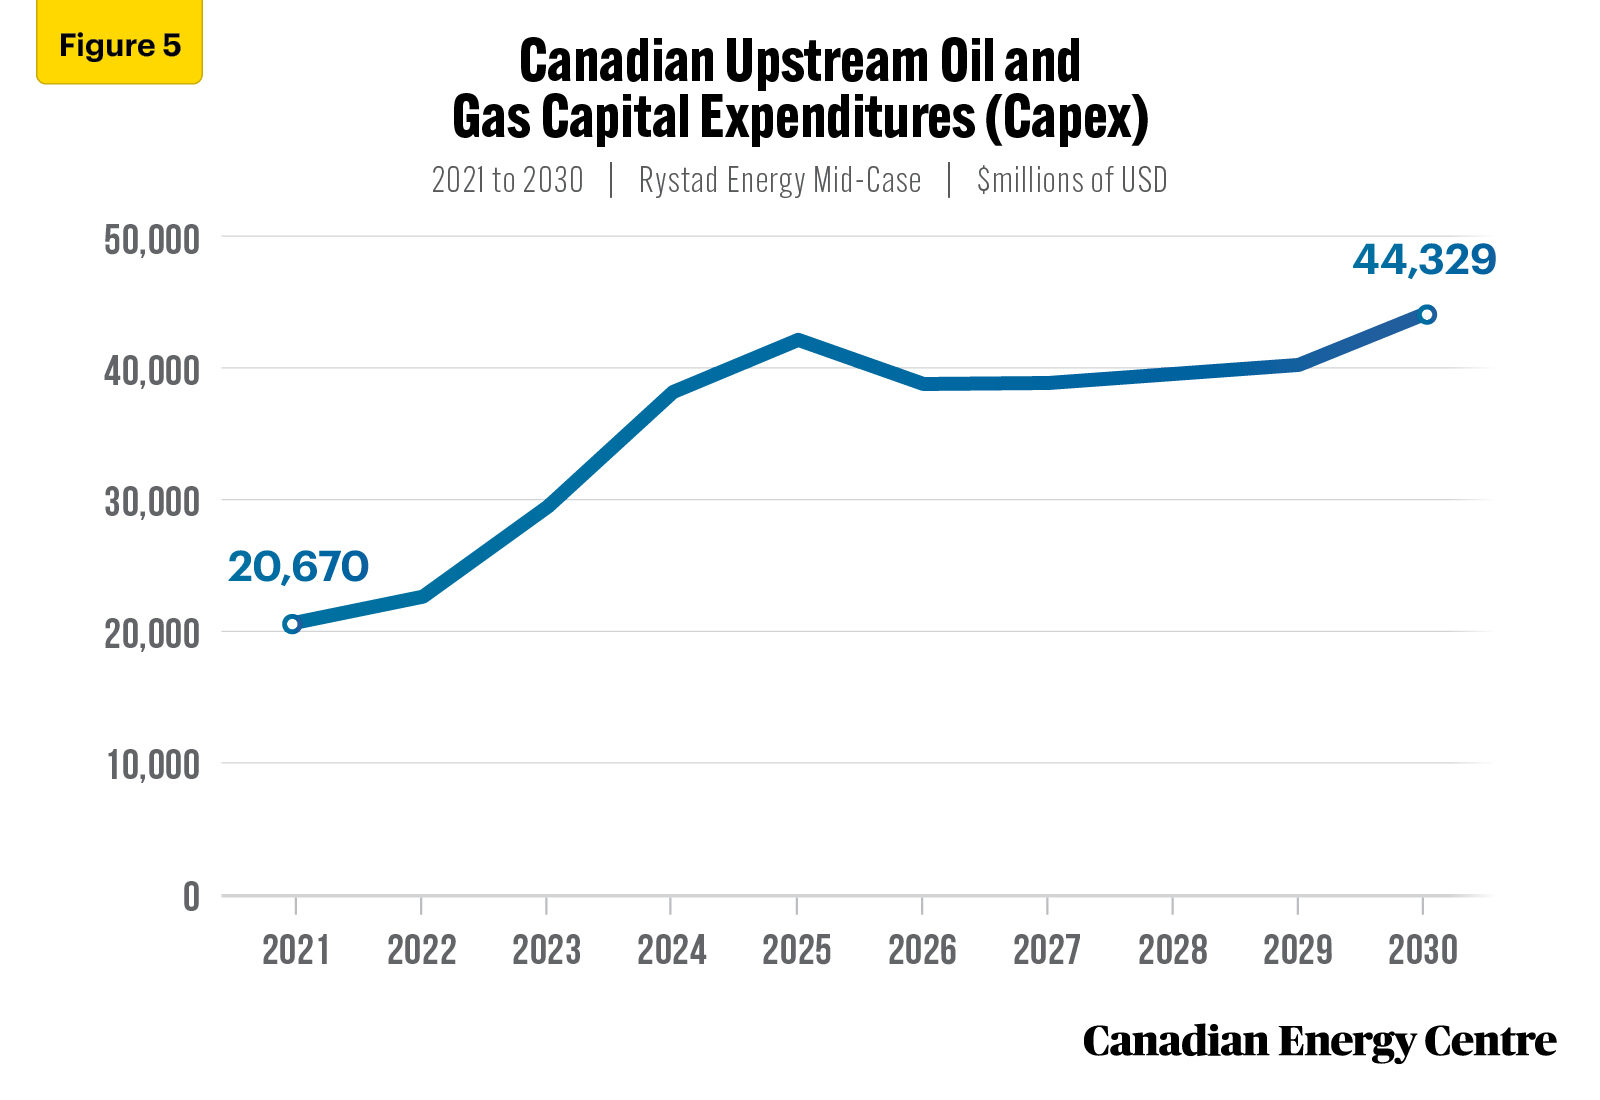
Overall Canadian upstream oil and gas capital expenditures (capex) exceeds U.S. $356 billion over the next decade
Under the mid-case, upstream oil and gas capex in Canada is expected to rise from U.S. $20.7 billion in 2021 to U.S. $22.7 billion in 2022, an increase of nearly 10 per cent. Post-2022, Canadian upstream oil and gas capex is expected to rise even further, reaching over $44.3 billion by 2030 (see Figure 5).
On a cumulative basis, between 2021 and 2030, Canadian upstream oil and gas capex is U.S. $356.3 billion under the mid-case (see Figure 5).
Source: Derived from the Rystad Energy UCube
Oil and gas capex by supply segment
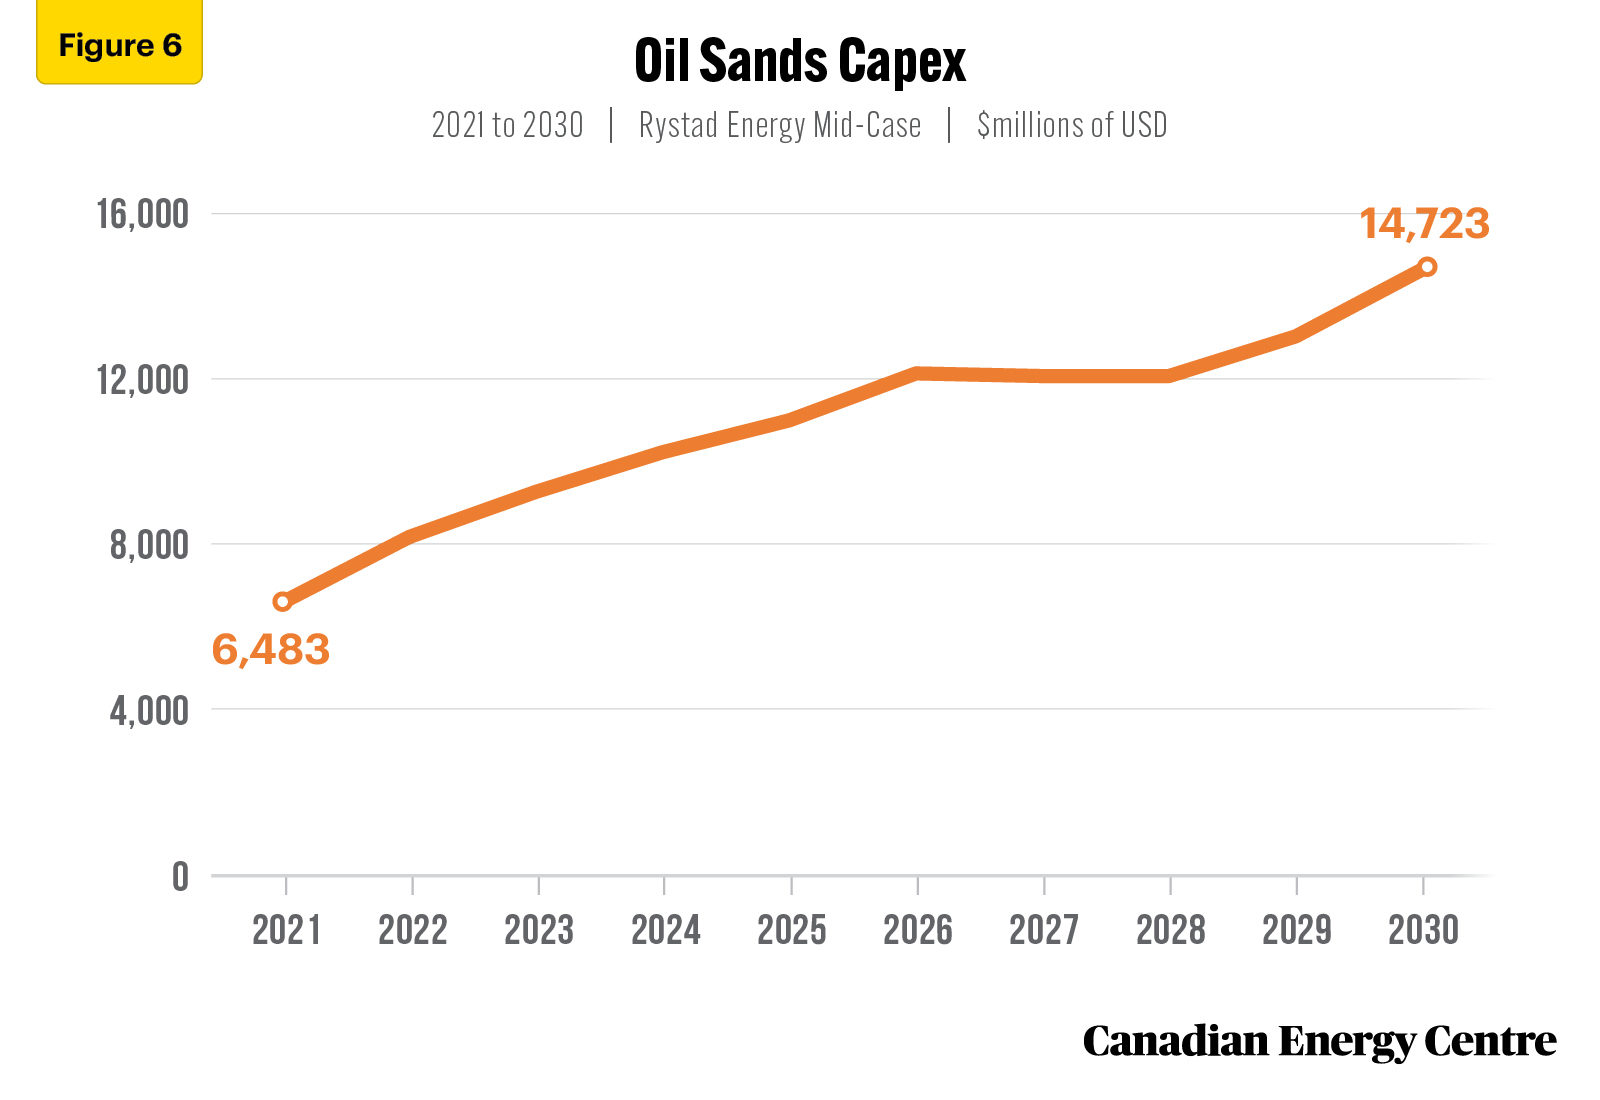
Oil sands spending exceeds $109 billion over the next decade
Under the mid-case, oil sands capex is expected to rise from U.S. $6.5 billion in 2021 to U.S. $8.1 billion in 2022, an increase of nearly 25 per cent. Post-2022, oil sands capex is expected to rise even further, reaching U.S. $14.7 billion by 2030 (see Figure 6).
On a cumulative basis, between 2021 and 2030, oil sands capex under the mid-case is U.S. $109.1 billion (see Figure 6).
Source: Derived from the Rystad Energy UCube
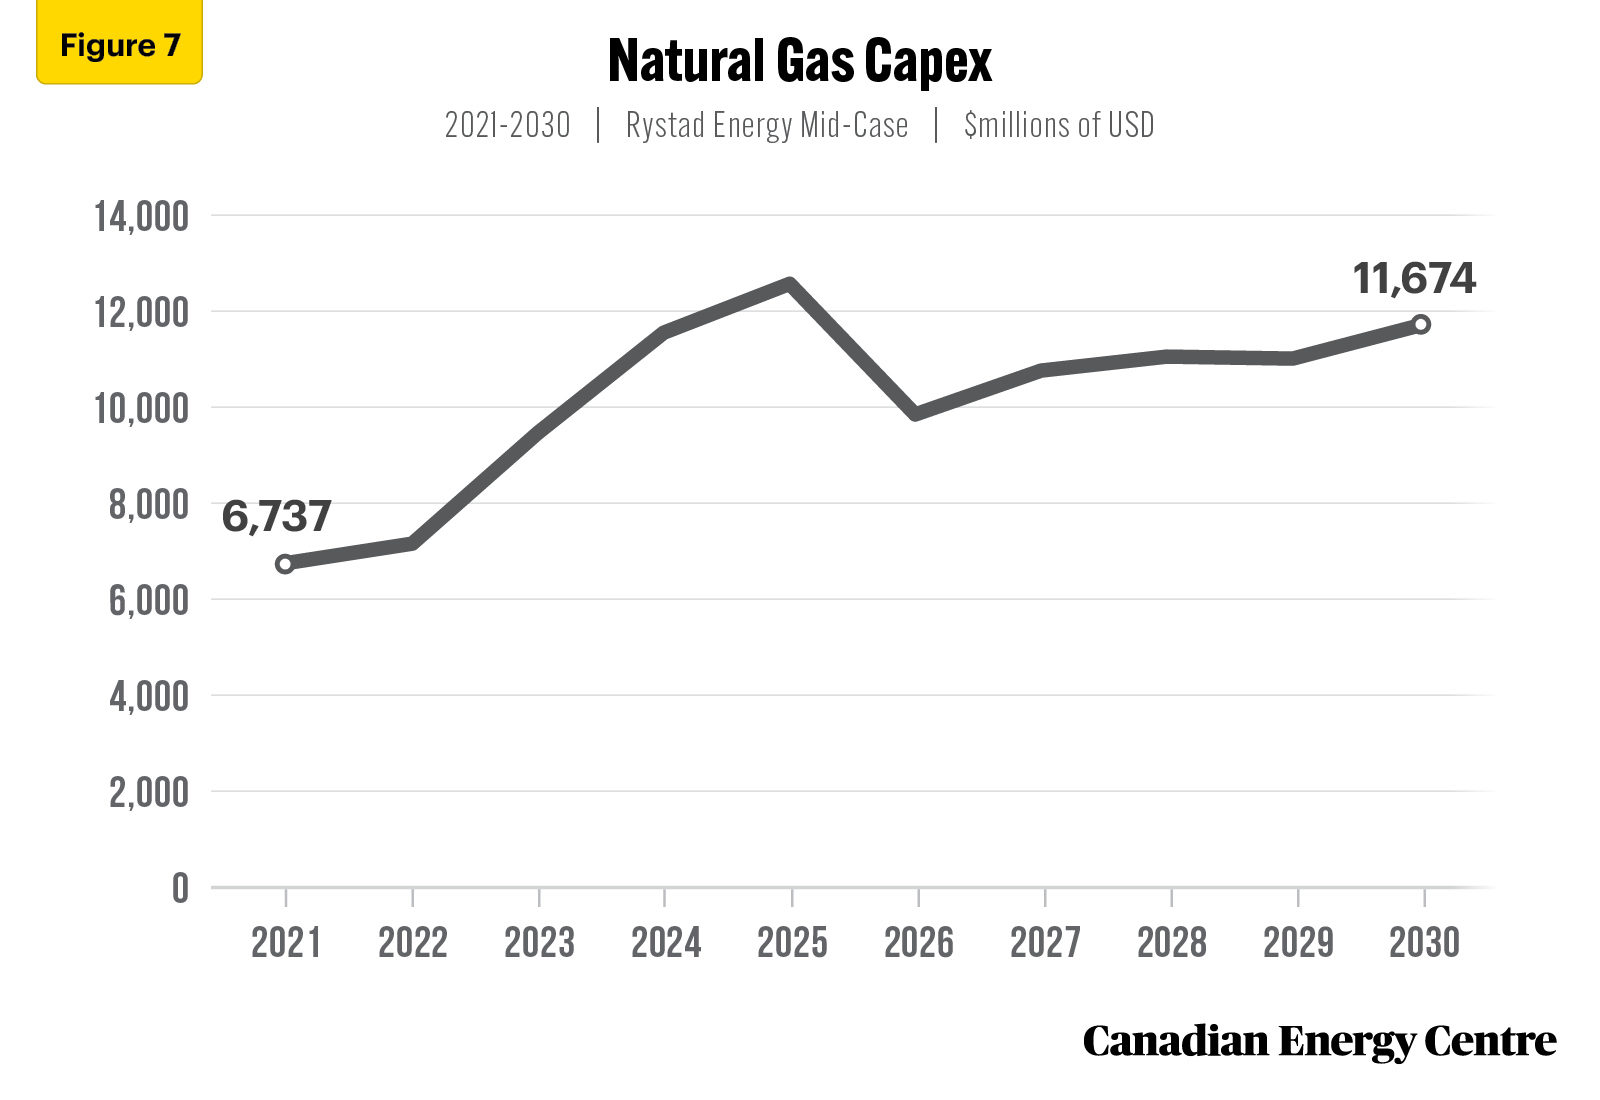
Natural gas spending nearly $102 billion over the next decade
Under the mid-case case, natural gas capex is expected to increase from U.S. $6.7 billion in 2021 to U.S. $7.1 billion in 2022. However, post-2022, natural gas capex is expected to rise significantly, reaching nearly $11.7 billion by 2030, an increase of 73 per cent from 2021 (see Figure 7).
On a cumulative basis, between 2021 and 2030, natural gas capex is nearly U.S. $101.7 billion under the mid-case (see Figure 7).
Source: Derived from the Rystad Energy UCube
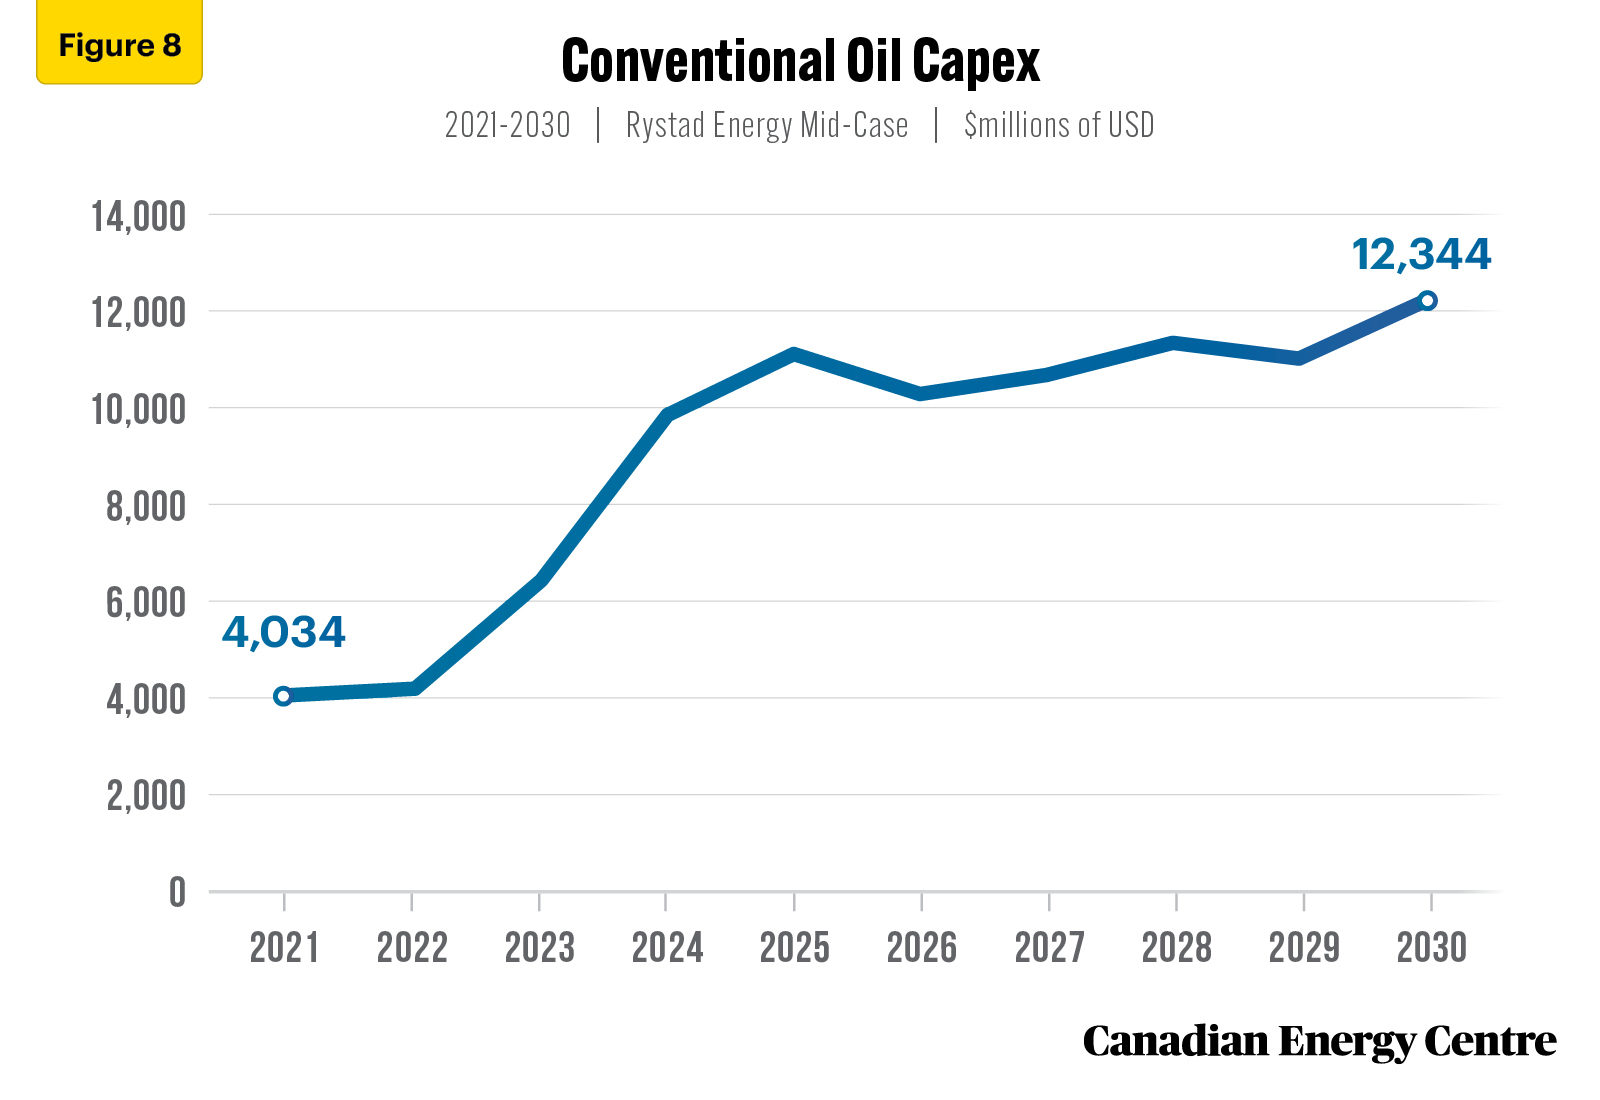
Conventional (regular and light) oil spending nearly $92 billion over the next decade
Under the mid-case, conventional oil capex is expected to increase from over U.S. $4 billion in 2021 to nearly U.S. $4.2 billion in 2022. However, post-2022, conventional oil capex is expected to rise significantly, reaching over U.S. $12.3 billion by 2030, an increase of 207 per cent from 2021 (see Figure 8).
On a cumulative basis, between 2021 and 2030, natural gas capex is nearly U.S. $91.9 billion under the mid-case (see Figure 8).
Source: Derived from the Rystad Energy UCube
Conclusion
If a higher energy price environment prevails over the next decade, Canadian upstream oil and gas investment could reach over U.S. $356 billion, an average of over U.S. $35 billion per year.
With this projected level of investment over the next decade, the Canadian oil and gas industry has an opportunity to play a key role as a safe, secure, reliable and clean supplier of oil and gas to a world that is facing potential energy disruptions arising from geopolitical conflict.
Notes
This CEC Fact Sheet was compiled by Lennie Kaplan at the Canadian Energy Centre (www.canadianenergycentre.ca). The author and the Canadian Energy Centre would like to thank and acknowledge the assistance of two anonymous reviewers in reviewing the data and research for this Fact Sheet. Image credits: Trans Mountain Corporation
The written content in this report was prepared by the Canadian Energy Centre (CEC) and does not represent the views of Rystad Energy
References (all links live as of May 19, 2022)
Rystad Energy. (2022a). Energy Transition Risk. <https://bit.ly/3LEk6eE>; Rystad Energy. (2022b). Global energy spending set to reach record high of over $2 trillion in 2022, led by oil and gas. <https://bit.ly/3rLJKGH>; Rystad Energy. (2022c). Global oil and gas investments to hit $628 billion in 2022, led by upstream gas and LNG. <https://bit.ly/3xXJdW9>; Rystad Energy UCube. (2022d). <https://bit.ly/3veaMIV>; Rystad Energy. (2022e). Upstream Energy Transition Risk Dashboard; Canadian Association of Petroleum Producers (CAPP) (2022). CAPP projects investment in Canada’s natural gas and oil sector will rise to $32.8 billion in 2022. <https://bit.ly/3LlQwdz>; International Energy Agency (IEA). (2021a). World Energy Outlook. <https://bit.ly/3qsucb7>; International Energy Agency (IEA). (2021b). World Energy Outlook 2021: Extended Dataset. <https://bit.ly/3D0OdZv>.
Creative Commons Copyright
Research and data from the Canadian Energy Centre (CEC) is available for public usage under creative commons copyright terms with attribution to the CEC. Attribution and specific restrictions on usage including non-commercial use only and no changes to material should follow guidelines enunciated by Creative Commons here: Attribution-NonCommercial-NoDerivs CC BY-NC-ND.