To sign up to receive the latest Canadian Energy Centre research to your inbox email: [email protected]
Download the PDF here
Download the charts here
Executive Summary
The war in Ukraine has emphasized the need for secure and reliable oil and gas resources. At the same time, the world is focused on reducing carbon dioxide emissions from industrial activities. Carbon capture, utilization and storage (CCUS) enables oil and gas companies to continue to produce while simultaneously reducing their CO2 emissions.
Canada’s oil and gas sector has been an early innovator and adaptor of CCUS. The potential for using CCUS in emissions reduction is most significant in Western Canada, though there is also an opportunity to use it in Ontario and Quebec.
According to the IEA, 21 CCUS projects capture 40 Mt of CO2 globally each year (IEA, 2021a). Most CCUS projects operate in the U.S., Canada, and Europe. Over 140 CCS projects could be operational globally by 2025, capturing at least 145 million tonnes per annum (mtpa) of carbon dioxide emissions.
Several CCUS facilities are now operating in Canada. The Canadian energy sector accounts for a significant share of large-scale commercial CCUS projects. It is estimated that the energy sector could lift CO2 capture capacity to 88 mtpa in 2025 and 271 mtpa by 2030 if the proper regulatory fiscal and regulatory instruments are in place.
The global demand for oil and gas will increase in the coming decades. The Canadian oil and gas sector, with the third-largest proven oil reserves and fifth-largest natural gas reserves worldwide, has a vital role in responsibly supplying the world’s energy needs. CCUS will be the bridging mechanism enabling Canada’s oil and gas industry to enhance energy security while significantly lowering its carbon emissions.
Overview
The war in the Ukraine has emphasized the need for secure and reliable oil and gas resources even as the world is focused on reducing carbon dioxide emissions from industrial activities.¹
With the onset of the COVID-19 pandemic in 2020, global demand for liquid petroleum fuels fell to less than 90 million barrels per day (mb/d). Since then, however, demand has recovered and is now more than 100 mb/d. Global consumption of liquid petroleum fuels is forecast to reach over 101 mb/d and close to its record high by 2023 (see Figure 1).
As a significant exporter of oil and gas, how can Canada preserve its oil and gas industry while still achieving its CO2 emission reduction goals? Recent technological advances can help. Carbon capture, utilization and storage (CCUS), for example, enables oil and gas companies to continue to produce while at the same time reducing their CO2 emissions. In the past few years, there has been a greater emphasis on CCUS technology, and in 2021 plans for more than 100 projects were announced worldwide.
1. The written content in this report was prepared by the authors at the Canadian Energy Centre (CEC) and does not represent the views of Rystad Energy. Rystad Energy is an independent energy research company providing data to clients around the globe. Rystad Energy has developed a detailed CO2 capture demand tool (the CCUS Market Dashboard) that can forecast carbon capture, utilization and storage deployment rates by country and industry towards the end of the decade based on currently announced projects. The Rystad CCUS Market Dashboard provides a comprehensive overview of CCUS projects and CO2 infrastructure, the source of emissions, carbon pricing, policies, storage licenses, economics and project costs, geological potential assessment, suppliers and technologies, well demand, and long-term CCUS demand under different global decarbonization scenarios (Rystad, 2022b).
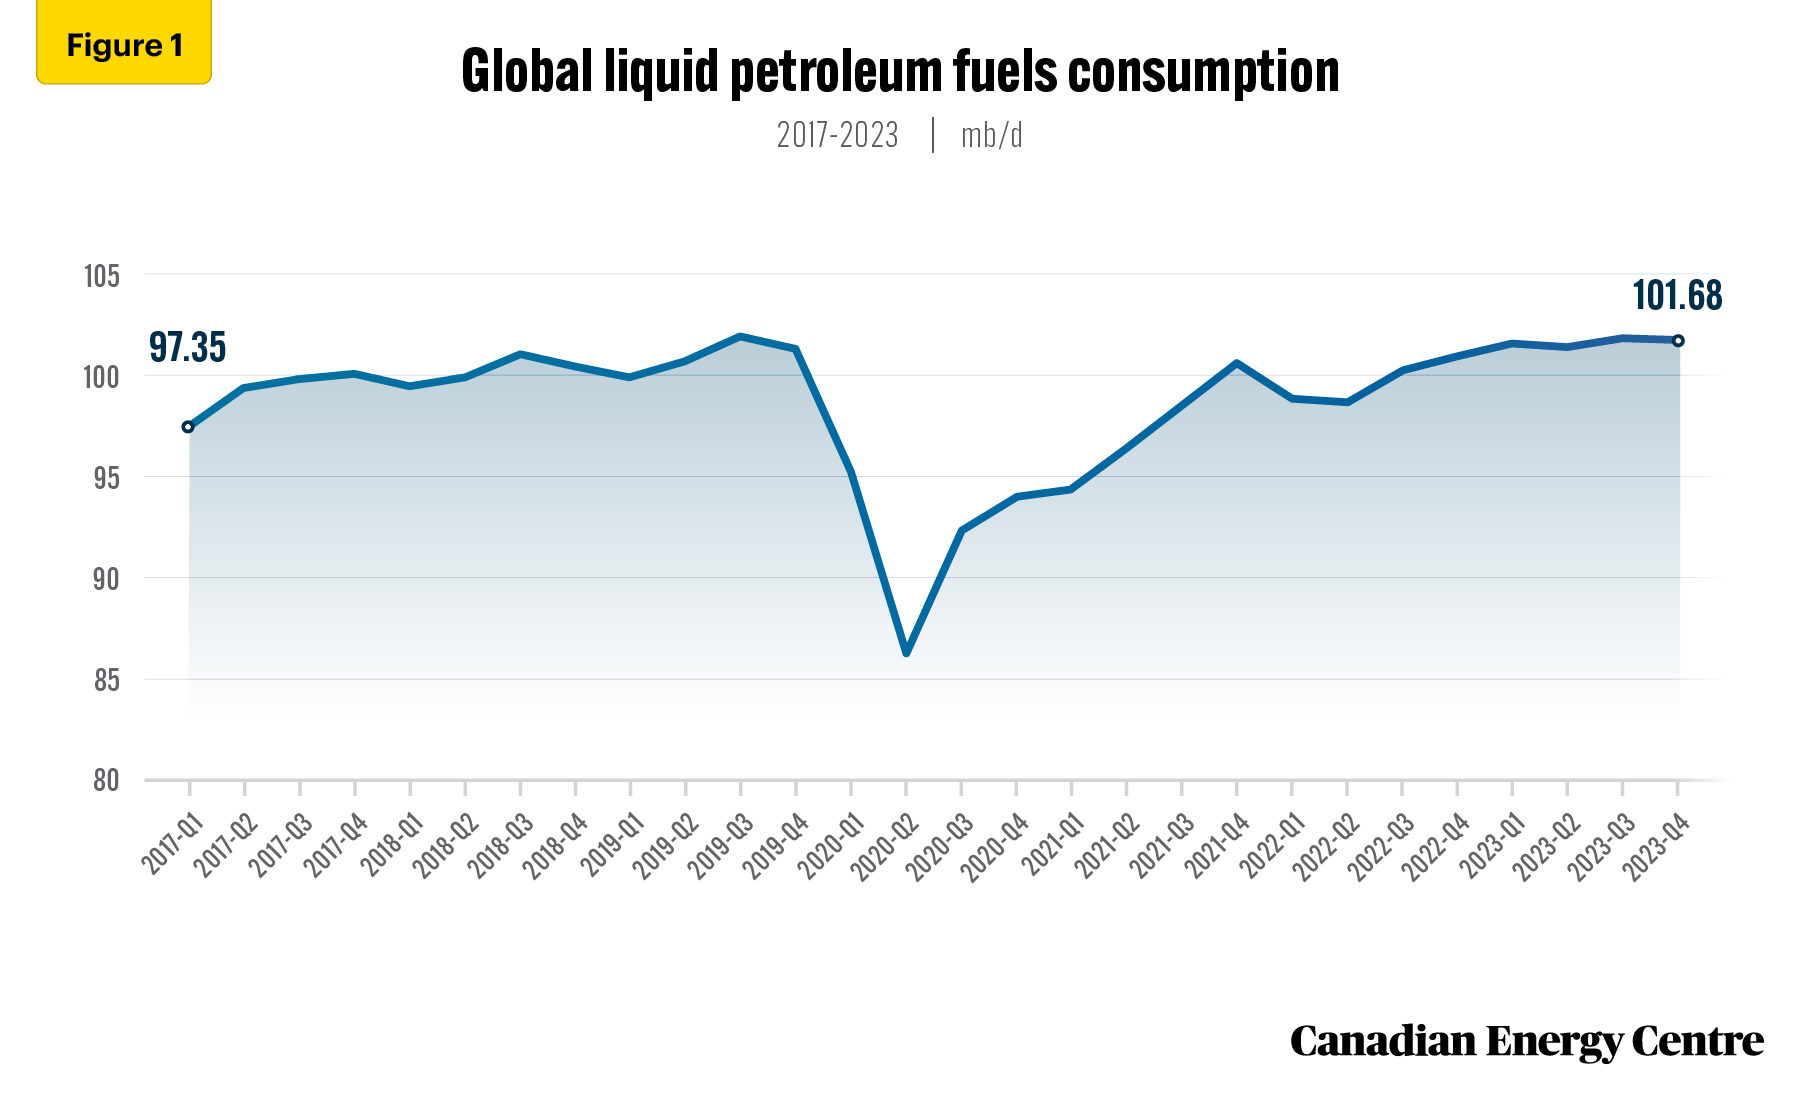
Source: EIA (2022).
Greenhouse gas (GHG) emissions in Canada were 730 million tonnes of carbon dioxide equivalent (Mt CO2e) in 2019. Under the federal government’s 2030 Emissions Reduction Plan (2030 ERP), the oil and gas sector is targeted for a reduction of 81 Mt CO2e, or 42 per cent, between 2019 and 2030 (from 191 Mt CO2e to 110 Mt CO2e (Canada, 2022). It will be critical for the Canadian oil and gas sector to use CCUS if it is to meet the 2030 emission reduction targets.
Canada’s oil and gas sector has been an early innovator and adaptor of CCUS. CCUS is now being used to capture and store over 3 Mt CO2e each year from Shell’s Quest Project, the Alberta Carbon Trunk Line (ACTL), and the SaskPower Boundary Dam Project. The potential for using CCUS in emissions reduction is most significant in Western Canada though there is also an opportunity to use it in Ontario and Quebec (see Figure 2).
In this CEC Research Brief, we examine some of the recent developments involving CCUS around the world. We also outline some of the main issues and challenges associated with CCUS in the Canadian oil and gas sector. Finally, we assess how the Canadian oil and gas sector is positioned to use CCUS to provide secure, reliable, and low-emitting oil and gas in a world where crude oil and natural gas demand is projected to rise and where supply disruptions are increasingly likely due to geopolitical conflict.
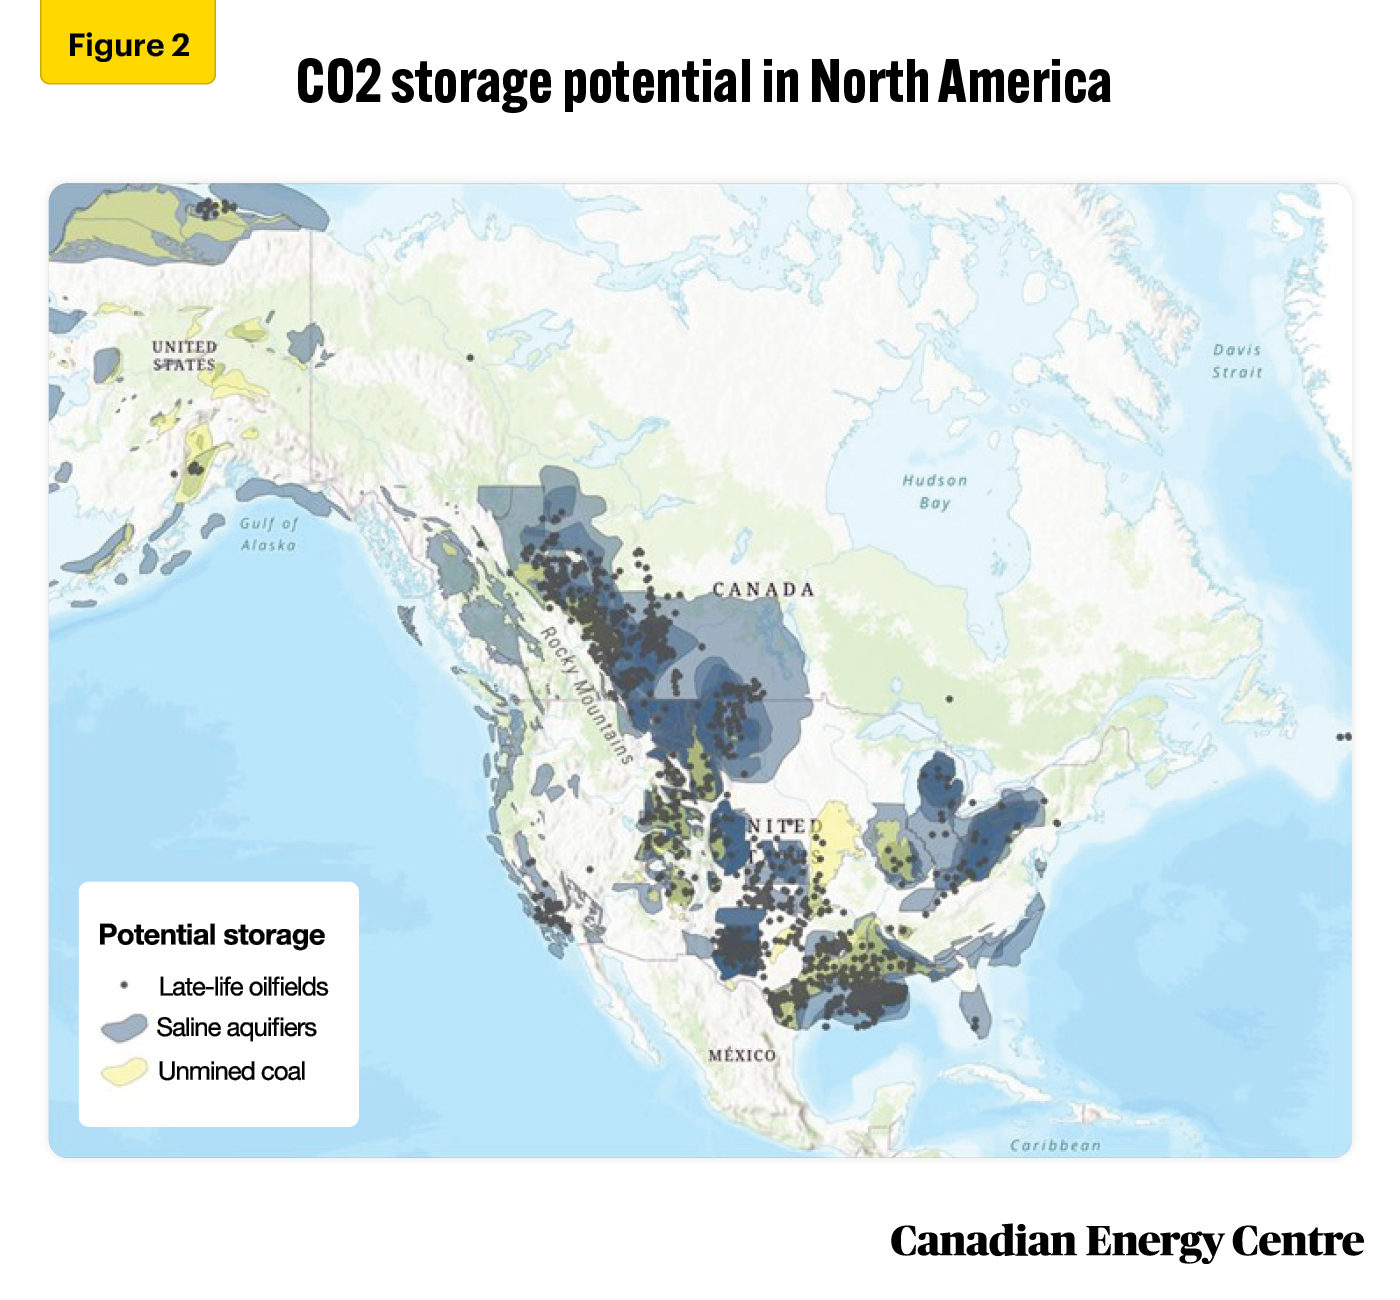
Source: Rystad Energy, North American CCS: A deep dive into driving forces and challenges.
Background on CCUS
All industrial and agricultural activities lead to emissions of carbon dioxide (CO2). CO2 emissions have been linked to increases in global temperatures, so there is a concerted effort among many countries to reduce their emissions in an effort to mitigate climate change.
Many new technologies have been proposed and implemented in an effort to reduce CO2 emissions. In recent years, two CO2 removal methods have gained traction.
- Point source capture and storage, more popularly known as carbon capture utilization and storage (or CCUS); and
- Direct air capture (DAC), which captures CO2 from the air and stores the carbon.
CCUS technologies capture and use the CO2 emitted during industrial activities. All industries that emit CO2 during their activities can use CCUS technologies.
CCUS consists of three processes. First, the CO2 emitted during the industrial activity is separated, captured, and compressed. Then the highly pressurized steam of CO2 is transported to a storage site. Finally, it is injected into a geological formation.
CCUS can take any one of the following forms:
- Carbon capture and storage (CCS), which includes technologies that capture CO2 and permanently store it;
- Carbon capture and utilization (CCU), where CO2 is used for other industrial activities such as the production of chemicals; and
- Carbon capture, utilization, and storage (CCUS), where CO2 is captured and then stored and later used for enhanced oil recovery (EOR). In the EOR process, CO2 is separated from natural gas in the gas wells (carbon sequestration) and the captured gas is then injected into the oil well to augment the process of oil extraction (see Figure 3).
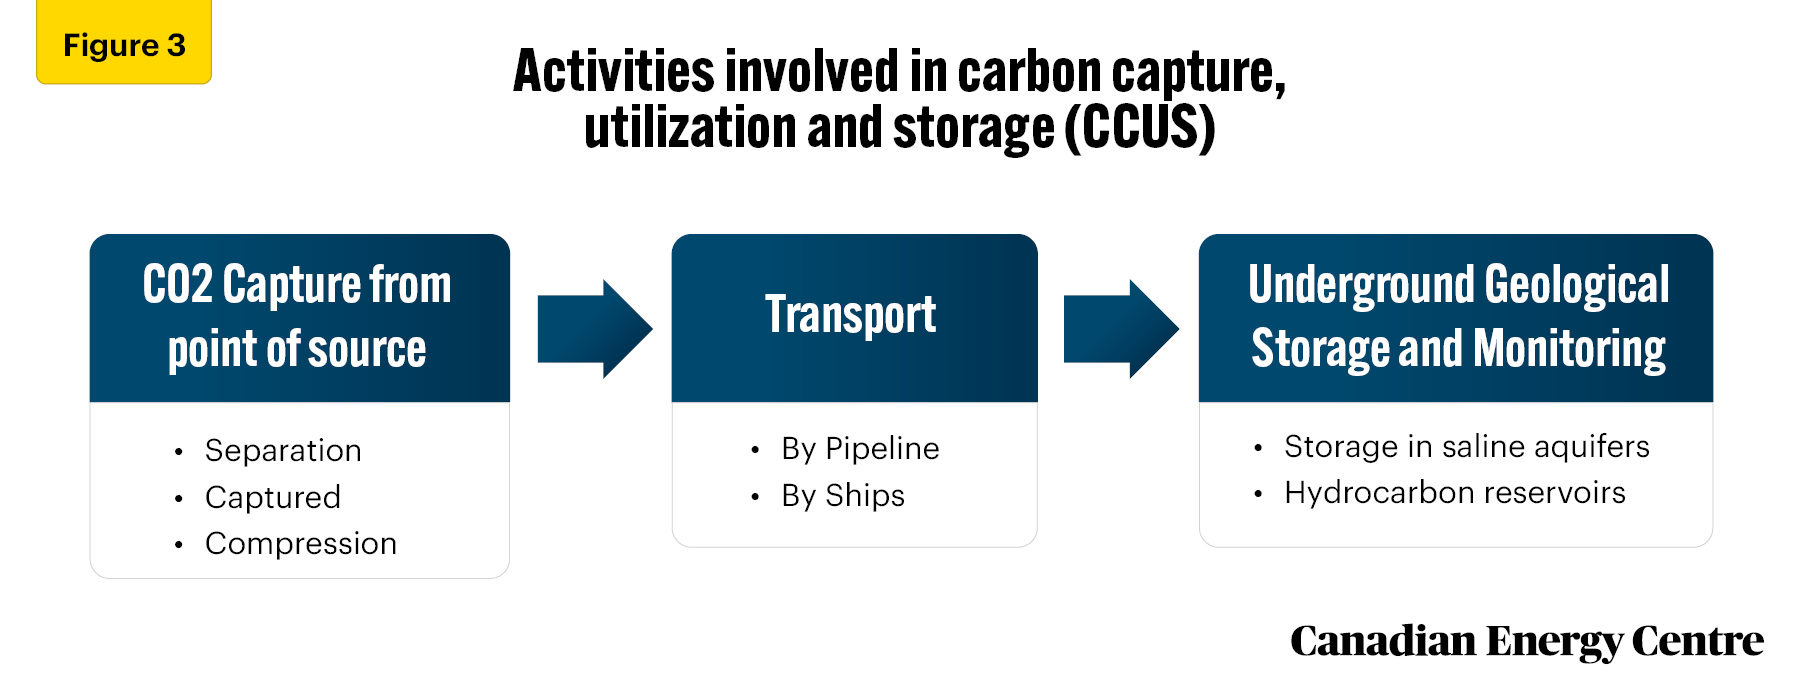
Source: IEA (2013).
CCUS expected to grow globally this decade
According to the IEA, 21 CCUS projects capture 40 Mt of CO2 globally each year (IEA, 2021a). Most of these CCUS projects operate in the U.S., Canada, and Europe. Most of the CCUS facilities are in natural gas processing plants. In the 1980s, natural gas processing plants captured 0.5 Mt of CO2, which increased to 28.5 Mt of CO2 in 2020 (see Figure 4).
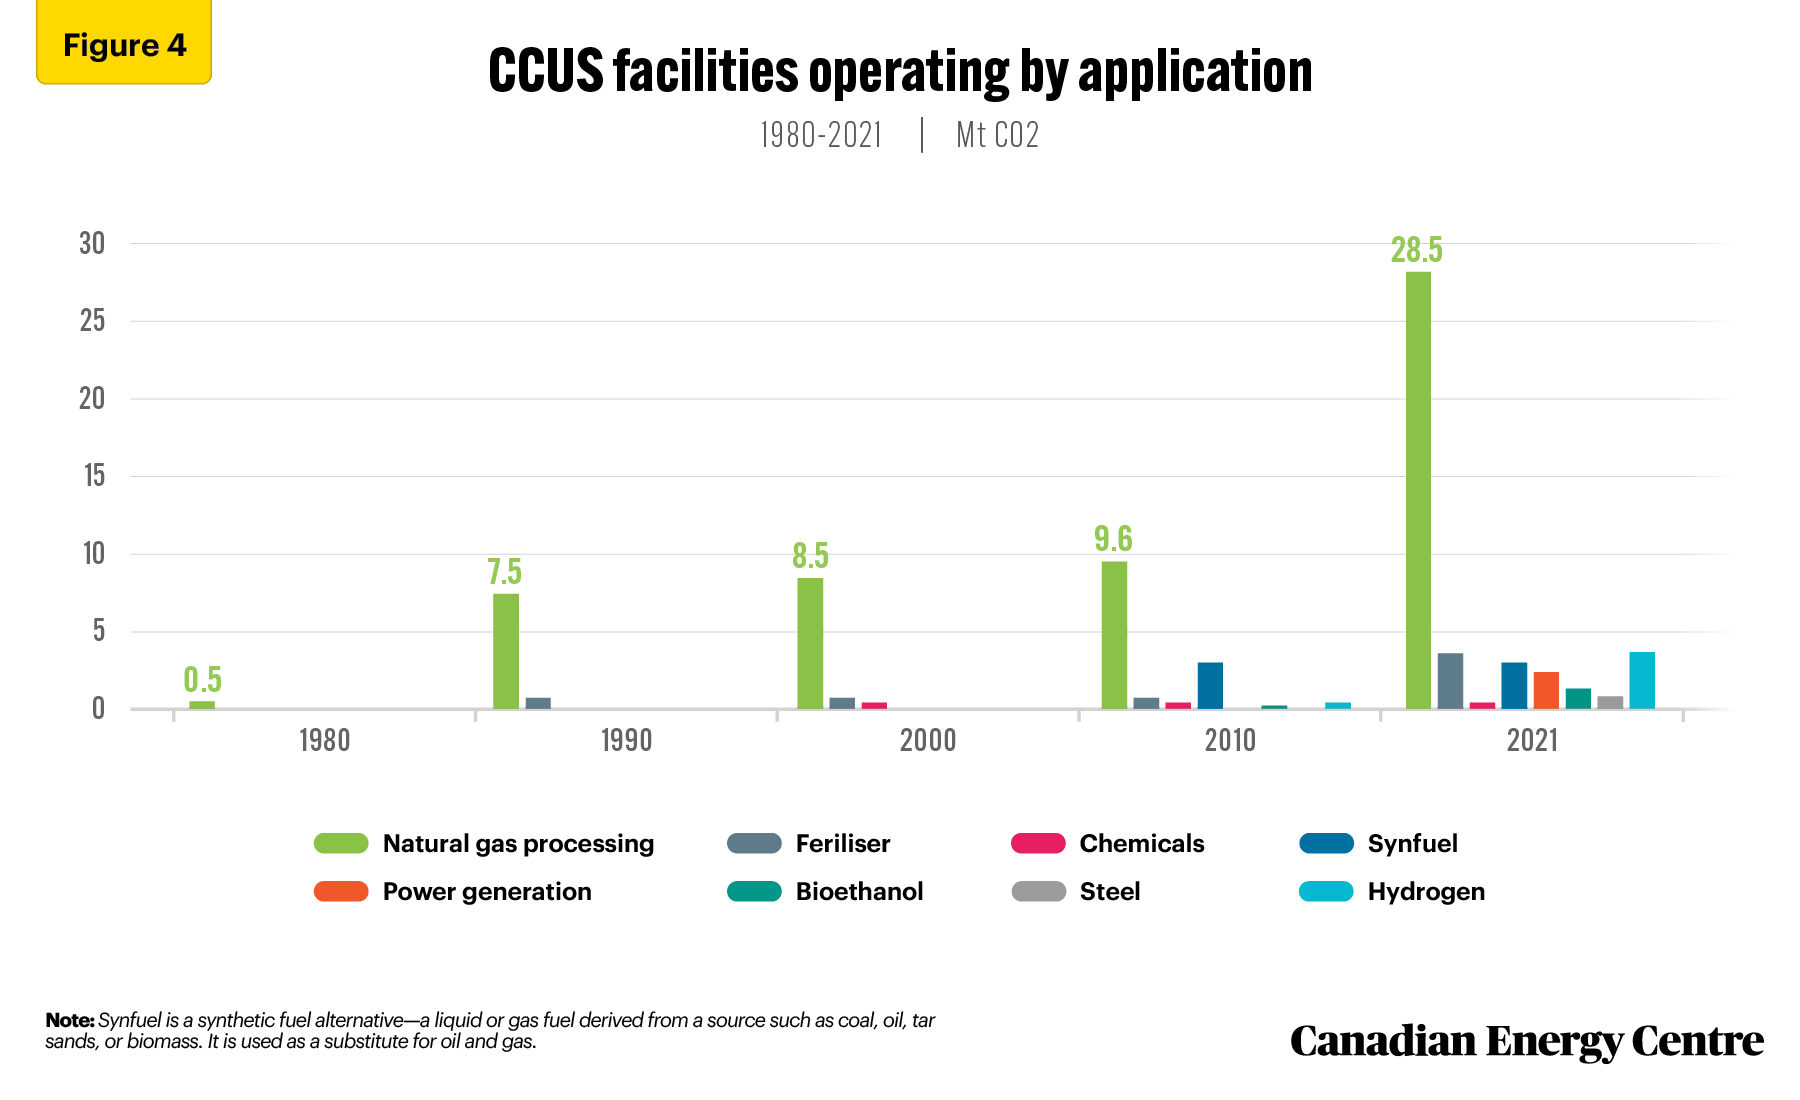
Source: IEA (2021b).
By 2021, there were 27 CCUS facilities operating and five under construction (see Figure 5). Over 45 per cent of CCUS projects are in North America.
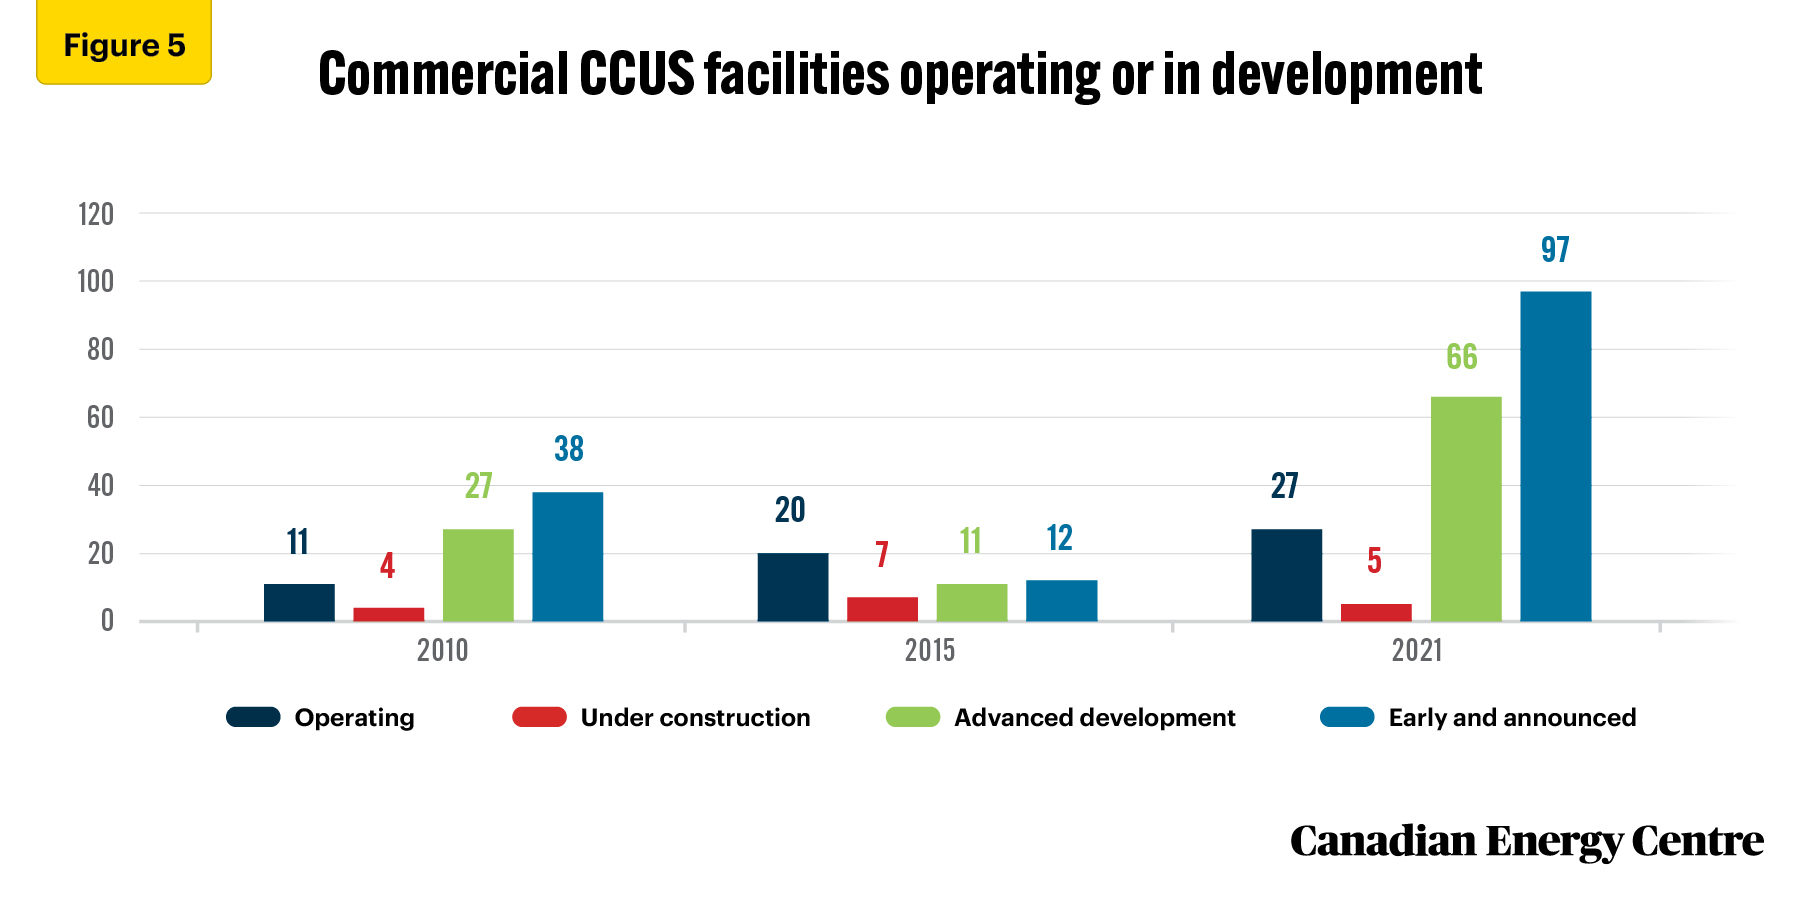
Source: IEA (2021c).
Over 140 CCS projects could be operational globally by 2025, capturing at least 145 million tonnes per annum (mtpa) of CO2. These projects are currently in various stages of development, including pre-feasibility, concept, and construction (Rystad Energy, 2022c). Gas processing, oil refining, and hydrogen production will be the sources for captured CO2 towards 2030 (see Figure 6).
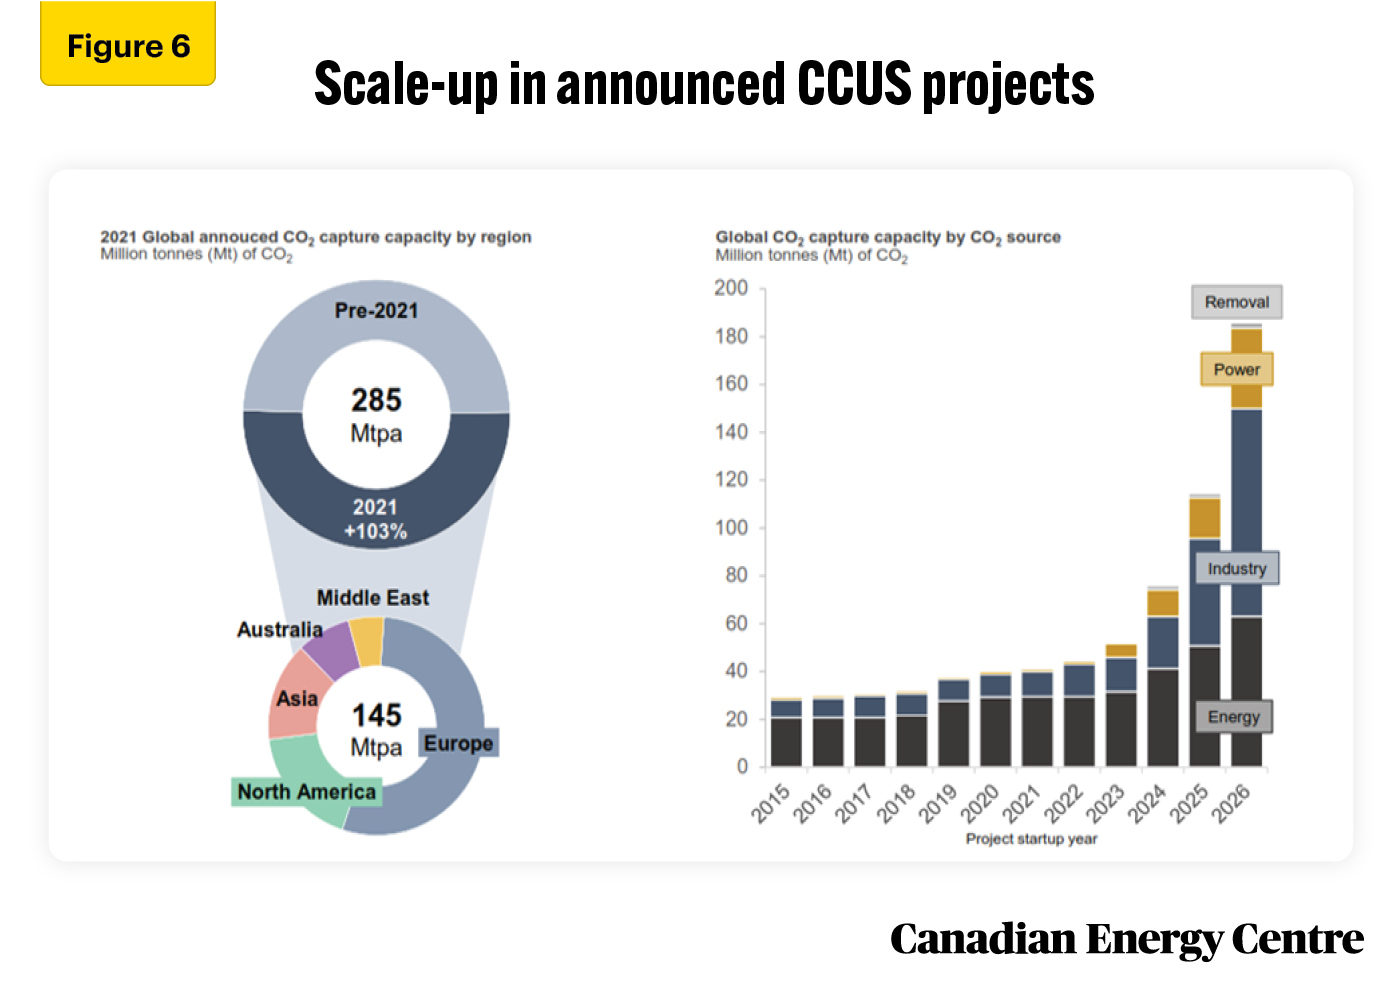
Source: Rystad Energy, North American CCS: A deep dive into driving forces and challenges.
According to Rystad Energy,
If all 140 projects move ahead as planned, the global CCUS industry is on track to support the service market with more than $50 billion in purchases between 2022 and 2025. Cash will be spent on a broad range of services related to installing the capture unit, transporting the CO2, and storing it. Almost two-thirds of the total spending will go on equipping the target facility with a CO2 capture part and operating it. (Rystad Energy, 2022d)
Rystad Energy estimates that by 2030, 193 projects could be in various stages of development, estimated to capture over 270 mtpa of CO2 when fully operational. The market value of CCUS could reach $55 billion per year by 2030, with the 2030 CCUS market alone being larger than the total CCUS market from 2022 to 2025 (Rystad Energy, 2022a).
Moving forward on CCUS in Canada
Several CCUS facilities are now operating in Canada. One of the earliest CCUS facilities, which opened its doors in 2014, is Boundary Dam Carbon Capture and Storage near Estevan, Saskatchewan. It can capture up to 1.0 million tonnes per annum (mtpa) of carbon. The Quest facility at Shell’s Scotford Upgrader, northwest of Edmonton, became operational in 2015, and through April 2021 has captured and stored 6.0 mtpa of carbon.
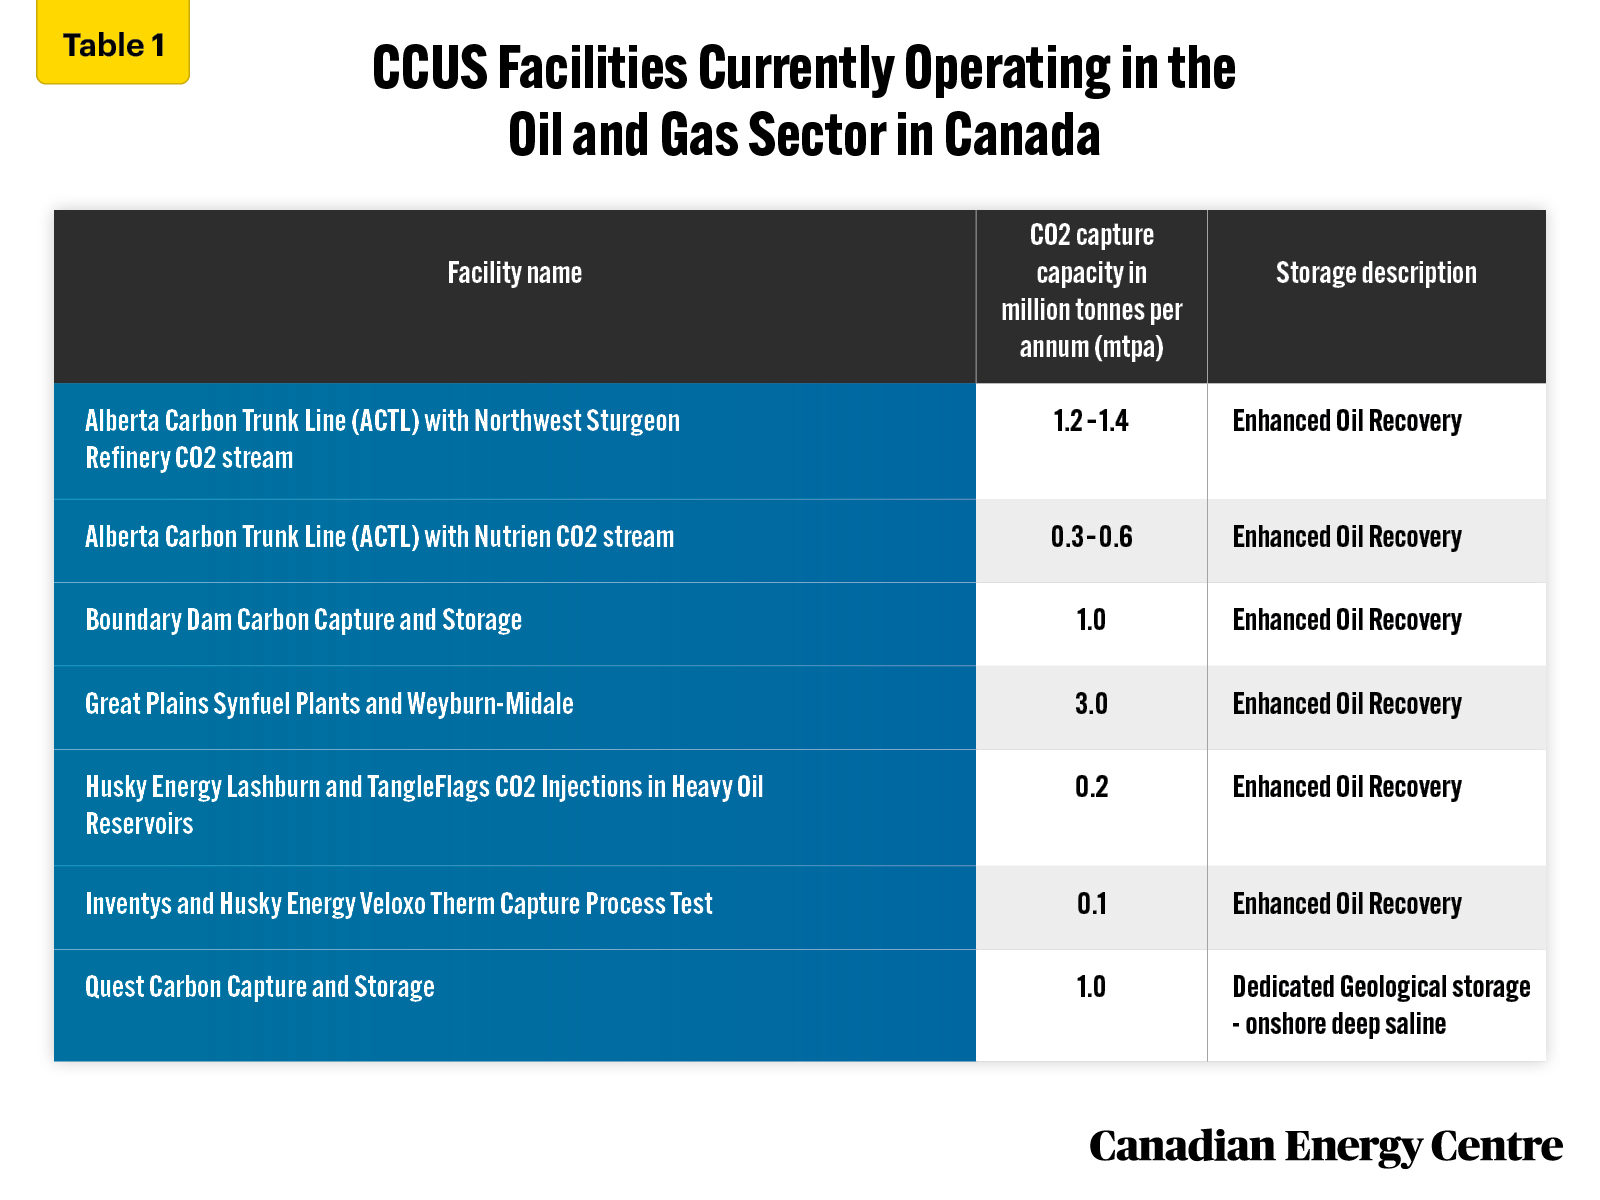
Source: Canada Energy Regulator (2019).
The federal government’s ERP has set a target of at least 15 Mt annually of CO2 reductions using CCUS technology through 2030. This includes capturing and storing CO2 emitted from oil sands facilities (8 Mt), refineries (3 Mt), and gas plants (4 Mt).
The most recent federal budget proposed a 50 per cent refundable investment tax credit for businesses with eligible CCUS expenses. To encourage the oil and gas industry to move quickly to lower emissions, this rate will be reduced to 25 per cent from 2031 through 2040.
The value of the CCUS tax credit is estimated at $2.6 billion (cumulative) between 2022/23 and 2026/27 (see Figure 7). Between 2027/28 and 2029/30, the value of the CCUS tax credit will average about $1.5 billion per year.
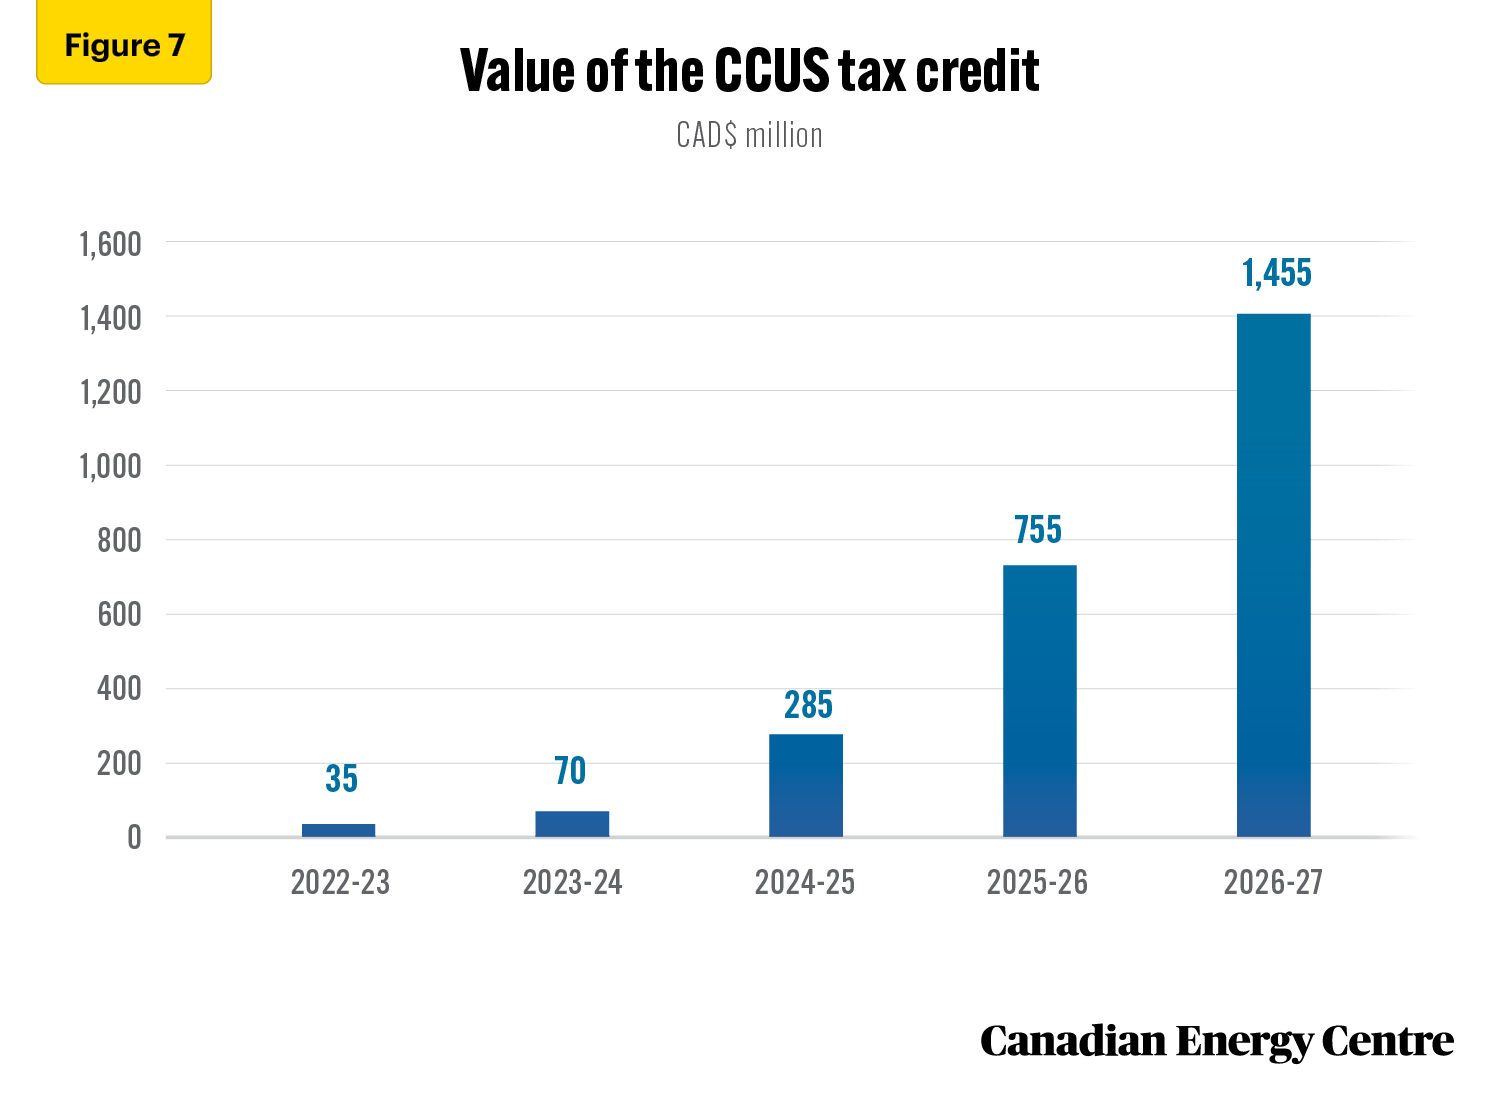
Source: Finance Canada (2022).
The value of the CCUS tax credit from 2022 through 2030 is thus estimated at over $7 billion. The federal government expects between 20 and 40 CCUS facilities will be up and running by the end of the decade.
In 2021, the Oil Sands Pathways to Net Zero (an alliance of six companies that account for 90 per cent of Canada’s oil sands production, including Canadian Natural Resources Ltd., ConocoPhillips, Cenovus, MEG Energy, Suncor, and Imperial) announced a plan for a carbon capture network in the oil sands-producing region of Northern Alberta.
At the heart of the network is a proposed carbon transportation line that will gather CO2 from more than 20 oil sands facilities from the Fort McMurray, Christina Lake, and Cold Lake regions and deliver it to a carbon storage hub near Cold Lake. The line will also be available to other industries in the region interested in capturing and storing CO2. The pipeline and storage hub is projected to remove about 10 Mt CO2e by 2030 (Oil Sands Pathways to Net Zero, 2022).
Potential Take-up of CCUS in Canada’s Energy Industry
The growth of the CCUS industry is critical over the next three decades if Canada is to achieve its emission reduction targets. Canada has a competitive advantage in CCUS due to its technological expertise, geological storage capacity, and a growing oil and gas industry.
The Canadian energy sector accounts for a significant share of large-scale commercial CCUS projects. It is estimated that the energy sector could lift CO2 capture capacity to 88 mtpa in 2025 and 271 mtpa by 2030, if the proper regulatory fiscal and regulatory instruments are in place (see Figure 8).
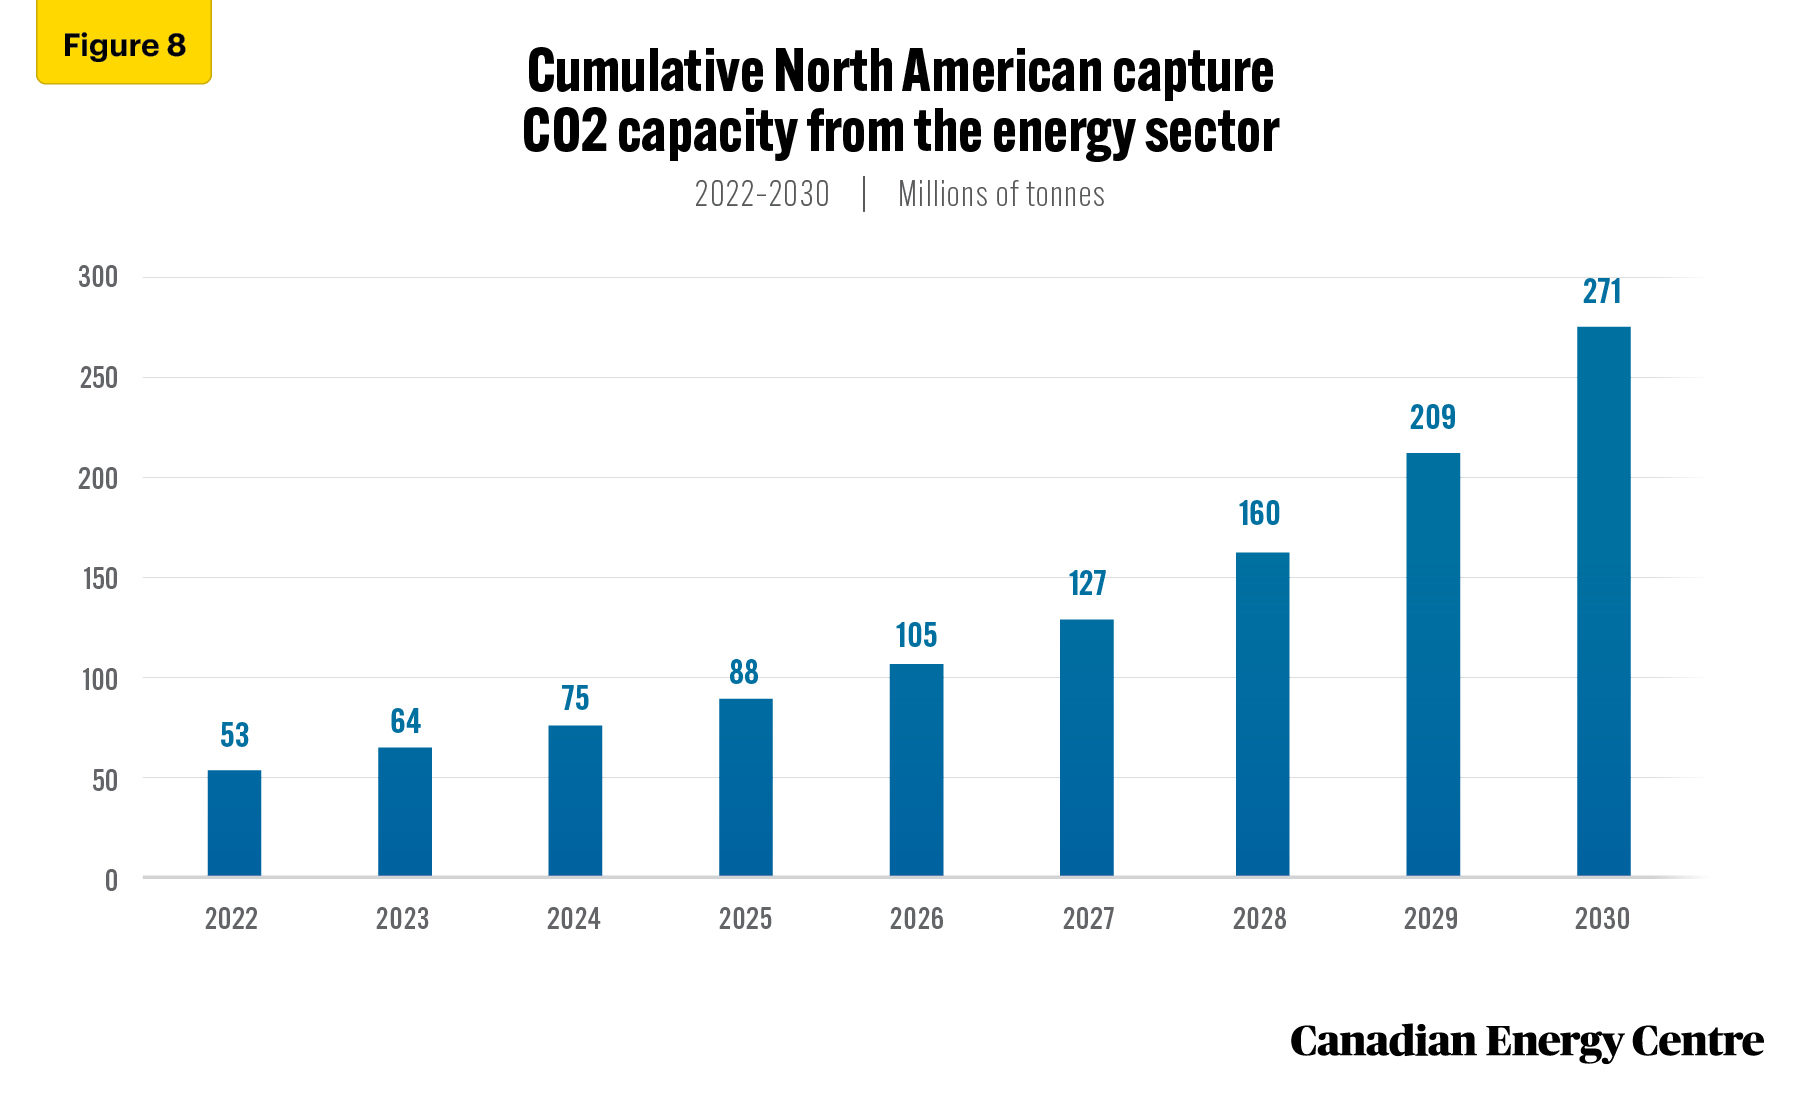
Source: Derived from the Rystad Energy CCUS Market Dashboard.
Based on a supply chain analysis of CCUS projects likely to proceed by 2025, the Canadian in CCUS projects is set to reach over $6.4 billion (cumulative) between 2022 and 2025, with nearly $5.8 billion invested in capture, $496 million in storage, and $133 million in transport (see Figure 9).
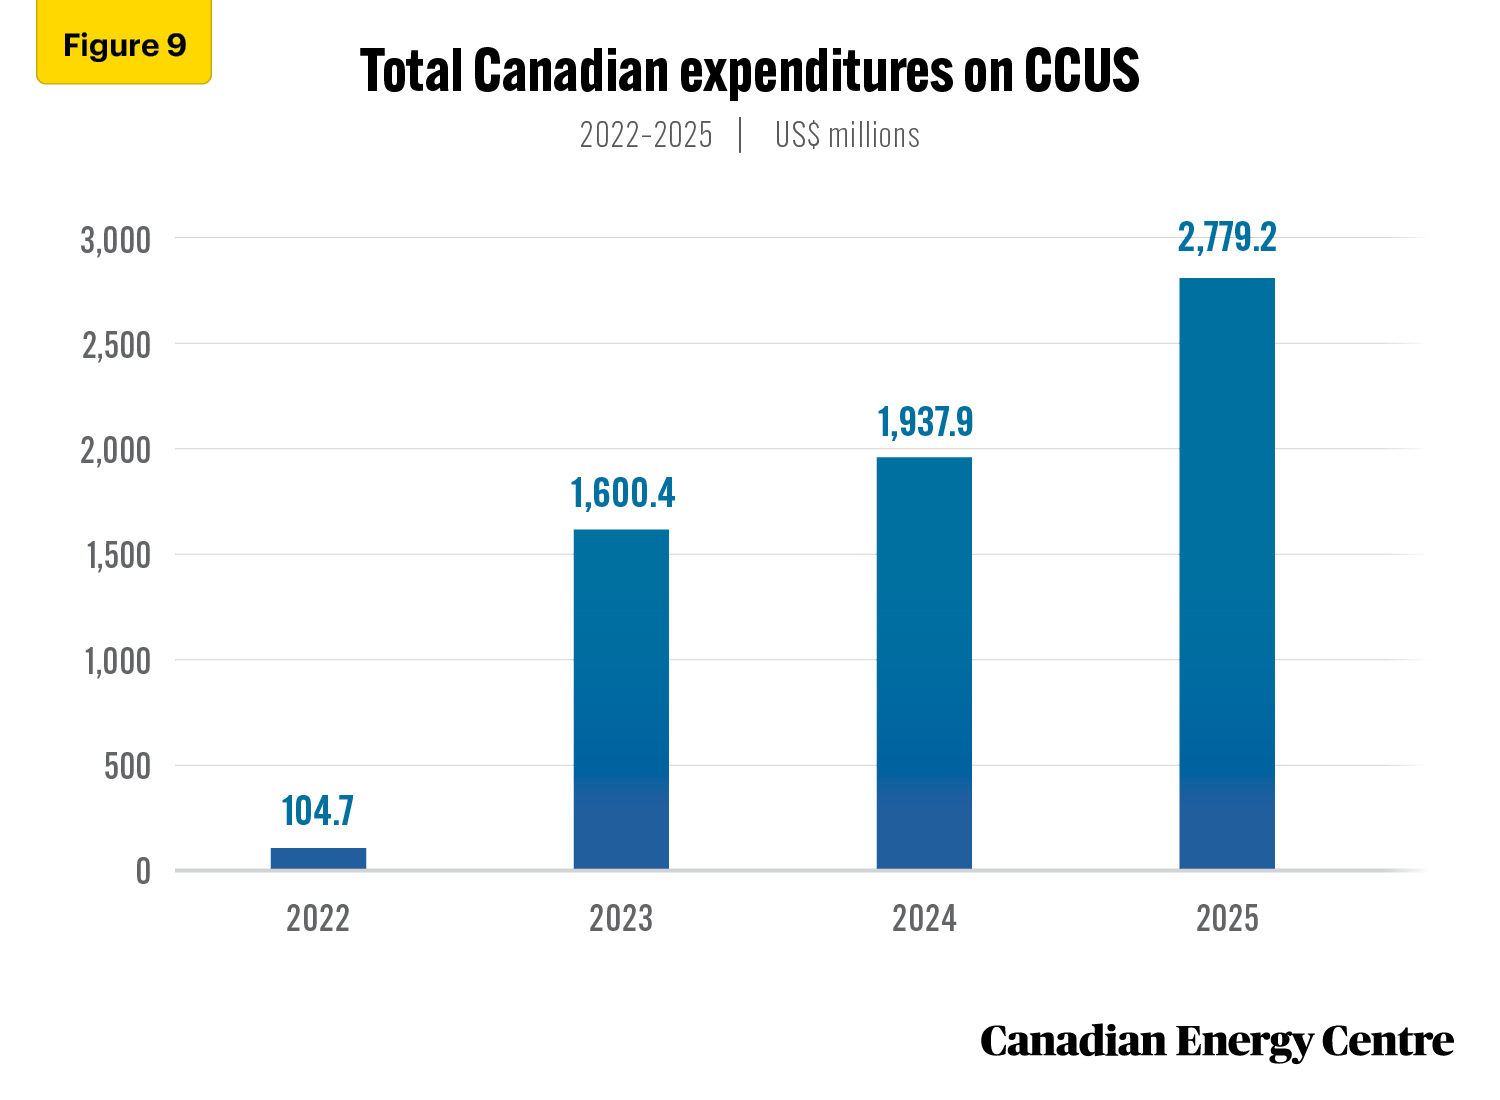
Source: Derived from the Rystad Energy CCUS Market Dashboard.
As CCUS technology advances and Canada’s energy sector adopts it widely, the levelized cost of capture (LCOC) will continue to fall. LCOC or life cycle costs of CCUS is the cost of production and cost per tonne of CO2 avoided. Levelized costs are an important comparative measure because they account for the scale and rate of production of the CCUS plant over its lifetime (Global CCS Institute, 2017).
The LCOC for oil refining is expected to fall from $74.71 U.S. per tonne in 2022 to $57.39 U.S. per tonne in 2030, and level off at $50.46 U.S. per tonne by 2050 (see Figure 10).
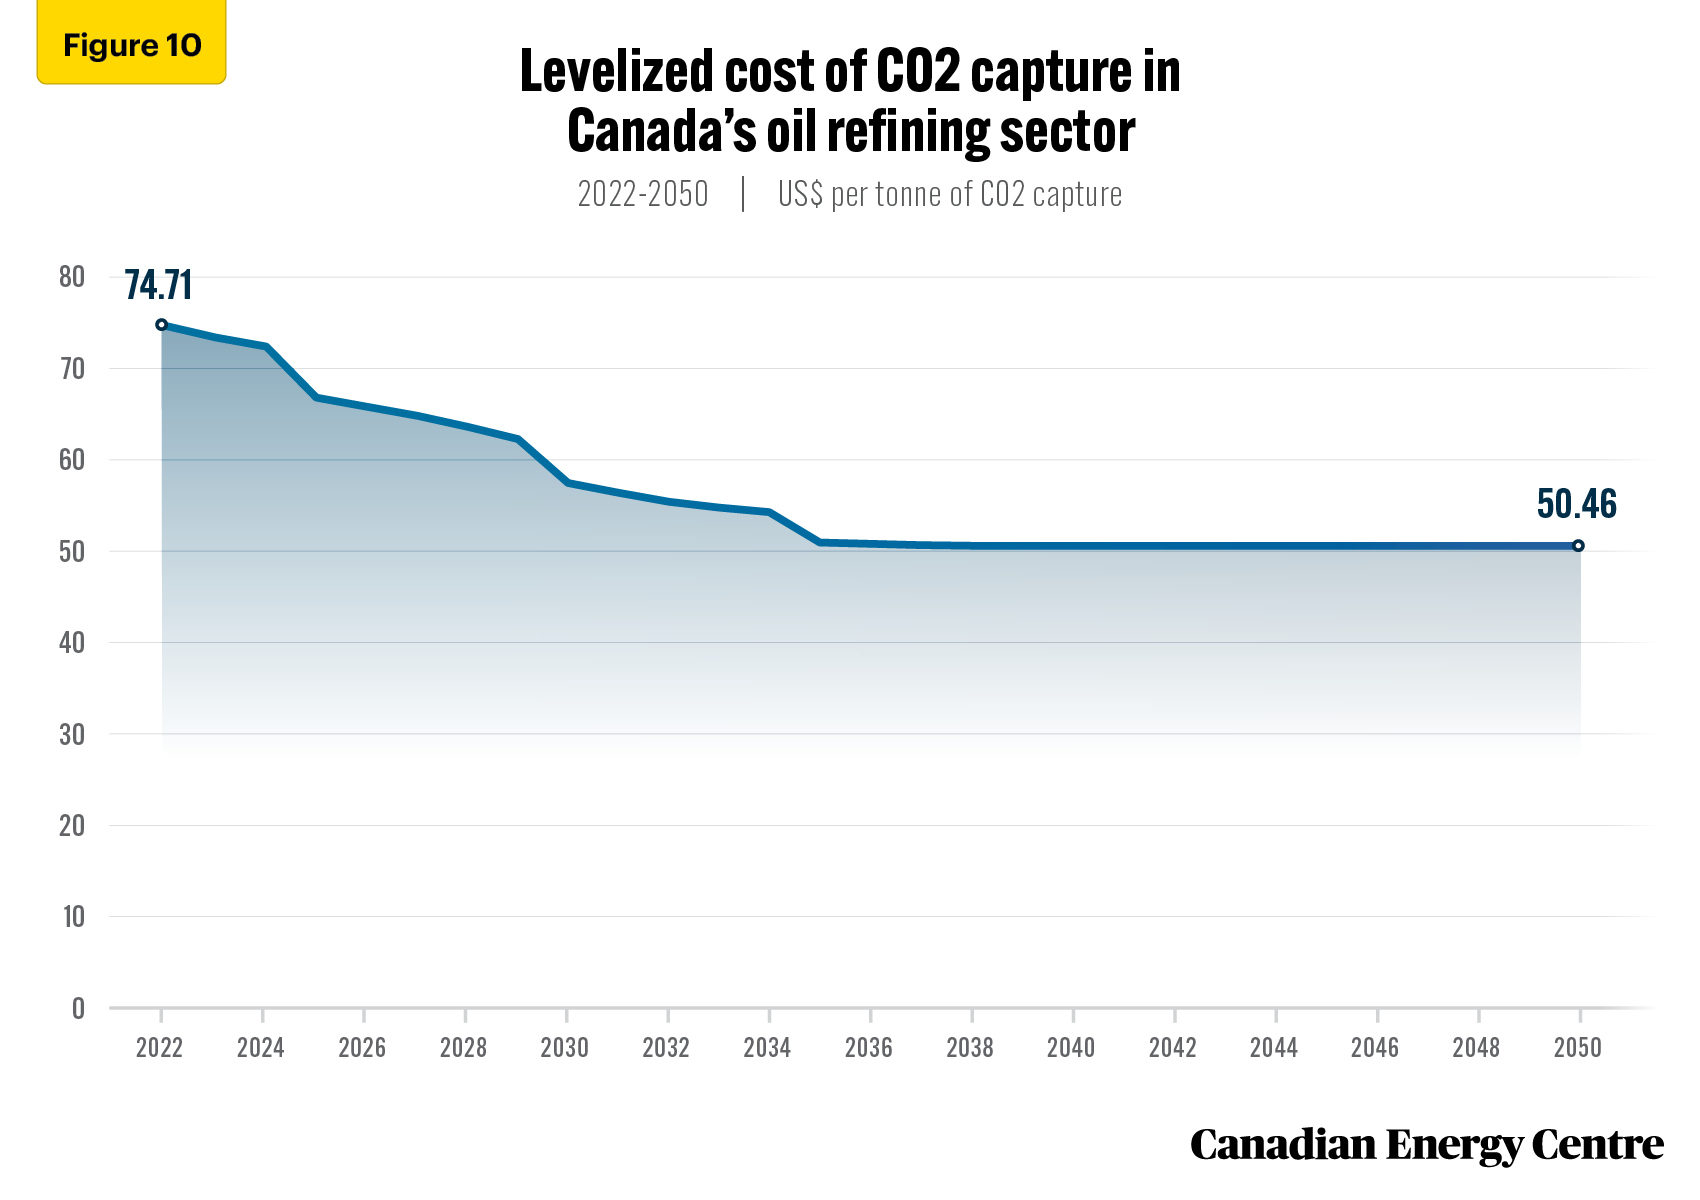
Source: Derived from the Rystad Energy CCUS Market Dashboard.
The LCOC for natural gas processing is expected to fall from $28.58 U.S. per tonne in 2022 to $25.28 U.S. per tonne in 2030 and level off at $24.10 U.S. per tonne by 2050 (see Figure 11).

Source: Derived from the Rystad Energy CCUS Market Dashboard.
One of the main issues currently impinging on the growth of the CCUS market in Canada is that CO2 infrastructure (that is, the transportation and storage components of the CCUS process) is often inaccessible. That is combined with a lack of nearby infrastructure with available capacity that can transport and store additional volumes of CO2 that will be tied into the carbon capture unit. As Riehl et al. (2021) note,
Without a significant CCUS industry in place, investment in pipeline infrastructure is hard to justify. At the same time, investment in a capture plant requires assurance that there is a way to transport the CO2 to a location where it can be stored… Captured CO2 must be transported to suitable geological storage. Deep porous rocks covered by a solid “cap rock” can permanently store CO2 underground. Unfortunately, the source of CO2 emissions is not always in a location with suitable storage. Consequently, transportation infrastructure is required to connect the point of capture to the point of storage (usually with pipelines).
The Economic Benefits of CCUS for Canada
By the end of the decade, the CCUS project proposed by the Oil Sands Pathways to Net Zero has the potential to generate approximately 35,000 jobs in construction and clean technology, protect 25,000 to 35,000 existing jobs, and add another 1,000 permanent jobs compared to a do-nothing scenario (Oil Sands Pathways to Net Zero, 2022).
The Oil Sands Pathways to Net Zero estimates that an oil sands industry making meaningful emissions reductions could contribute up to $3 trillion to the Canadian economy over the next 30 years (Oil Sands Pathways to Net Zero, 2022).
According to the government of Alberta, a $30 billion investment in CCUS would preserve Alberta’s industrial contribution to Canadian GDP of $1.2 trillion over 10 years, providing 40 times return on investment (ROI) to the Canadian economy (Alberta, 2021).
The International CCS Knowledge Centre estimates that the construction and development of three CCS projects in Canada would generate nearly $2 billion in GDP (directly and indirectly) and support over 4,500 direct and indirect jobs across Canada (International CCS Knowledge Centre, 2020).
Conclusion
The successful operation of CCUS facilities in Alberta and Saskatchewan demonstrates that the oil and gas industry has the technological resources and geological advantage to build and operate a thriving CCUS industry.
The global demand for oil and gas will increase in the coming decades. The Canadian oil and gas sector, with the third-largest proven oil reserves and fifth-largest natural gas reserves in the world, has a vital role in responsibly supplying the world’s energy needs. CCUS will be the bridging mechanism enabling Canada’s oil and gas industry to enhance energy security while also significantly lowering
carbon emissions.
References (Links live as of June 20, 2022)
Alberta. (2021). Alberta Industrial Emissions Reduction Strategy. <https://bit.ly/3xpEH0B>.
Riehl, Brianne, Michael Wolinetz, and Jotham Peters (2021). The Role of Carbon Capture and Storage in Canada’s Net Zero Future. Navius Research. <https://bit.ly/3LqU92e>.
Canada (2019). Government of Canada Releases Emissions Projections, Showing Progress Towards Climate Target. Environment and Climate Change Canada. <https://bit.ly/3wEDP7K>.
Canada Energy Regulator (2019). Market Snapshot: Carbon Capture, Utilization, and Storage Market Developments. <https://bit.ly/3NU6ddz>.
EIA (2022). Short-Term Energy Outlook. U.S. Energy Information Administration <https://bit.ly/3a1vCQT>.
Environment and Climate Change Canada (2022). 2030 Emissions Reduction Plan. <https://bit.ly/3sQ0ddm>.
Finance Canada. (2022). Budget 2022. Government of Canada. <https://bit.ly/3LEMQnH>.
Global CCS Institute. (2017). Global Costs of Carbon Capture and Storage. <https://bit.ly/3xPnXBa>.
IEA (2013). Technology Roadmap: Carbon Capture and Storage. <https://bit.ly/3GhK6dX>.
IEA (2021a). Carbon Capture, Utilisation and Storage. <https://bit.ly/3GgbuJl>.
IEA (2021b). Carbon Capture in 2021: Off and Running or Another False Start? <https://bit.ly/3wEEINC>
IEA (2021c). CCUS Facilities in Operation by Application, 1980-2021. <https://bit.ly/38FkVpH>.
International CCS Knowledge Centre. (2020). Incentivizing Large-Scale CCS in Canada. <https://bit.ly/3vWAaBQ>.
Oil Sands Pathways to Net Zero (2022). <https://bit.ly/3aZkjvx>.
Rystad Energy (2022a). Bright CO2 Capture Demand Outlook Towards 2030, but Short of 2050 Target. <https://bit.ly/3NS65LP>.
Rystad Energy (2022b). CCUSCube. <https://bit.ly/36Nr6XA>.
Rystad Energy (2022c). Energy Transition Webinar: Capturing the World’s Imagination: What Truly Lies Ahead for CCUS? <https://bit.ly/3vDnf7K>.
Rystad Energy (2022d). North American CCS: A deep dive into driving forces and challenges. <https://bit.ly/3y3Bwxc>.
Rystad Energy (2022e). 2nd Transition Report: CCS Market Update. <https://bit.ly/3Mx0qtr>.
CEC Research Briefs
Canadian Energy Centre (CEC) Research Briefs are contextual explanations of data as they relate to Canadian energy. They are statistical analyses released periodically to provide context on energy issues for investors, policymakers, and the public. The source of profiled data depends on the specific issue. All percentages in this report are calculated from the original data, which can run to multiple decimal points. They are not calculated using the rounded figures that may appear in charts and in the text, which are more reader friendly. Thus, calculations made from the rounded figures (and not the more precise source data) will differ from the more statistically precise percentages we arrive at using the original data sources.
About the authors
This CEC Research Brief was compiled by Ven Venkatachalam, Chief Research Analyst, and Lennie Kaplan Executive Director of Research, Canadian Energy Centre.
Acknowledgments and Notes
The authors and the Canadian Energy Centre would like to thank and acknowledge the assistance of two anonymous reviewers for the review of this paper.
Creative Commons Copyright
Research and data from the Canadian Energy Centre (CEC) are available for public usage under creative commons copyright terms with attribution to the Canadian Energy Centre. Attribution and specific restrictions on usage including non-commercial use only and no changes to the material should follow guidelines enunciated by Creative Commons here: Attribution-NonCommercial-NoDerivs CC BY-NC-ND.
Photo Credits
The Alberta Carbon Conversion Technology Centre – Shell (p.1), Innotech Alberta (p.2), Quest carbon capture storage project near Edmonton – Shell (p.4), Kelly L. from Pexels.com (p.9), Avijit Singh from Pexels.com