To sign up to receive the latest Canadian Energy Centre research to your inbox email: [email protected]
Download the PDF here
Download the charts here
Overview
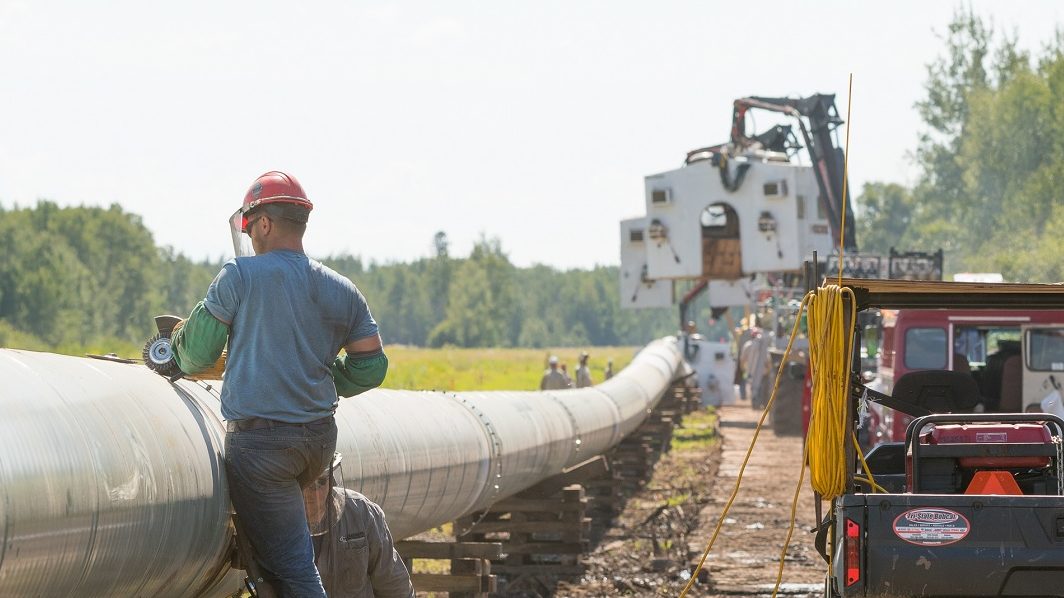
Work is underway to complete the final leg of Enbridge’s Line 3 Replacement Project, which will bring both employment and safer, more reliable energy to communities in Minnesota.
The project stretches from Edmonton, Alberta, to terminals in Clearbrook, Minnesota, and Superior, Wisconsin. Construction started in Minnesota in December 2020 following the completion of the parts of the line that are in Canada, North Dakota, and Wisconsin.
The Minnesota regulatory process took six years, including two reviews of a 13,000-plus page environmental impact statement, 70 public comment meetings, four separate legal reviews and 320 route modifications in response to stakeholder input (see Table 1).
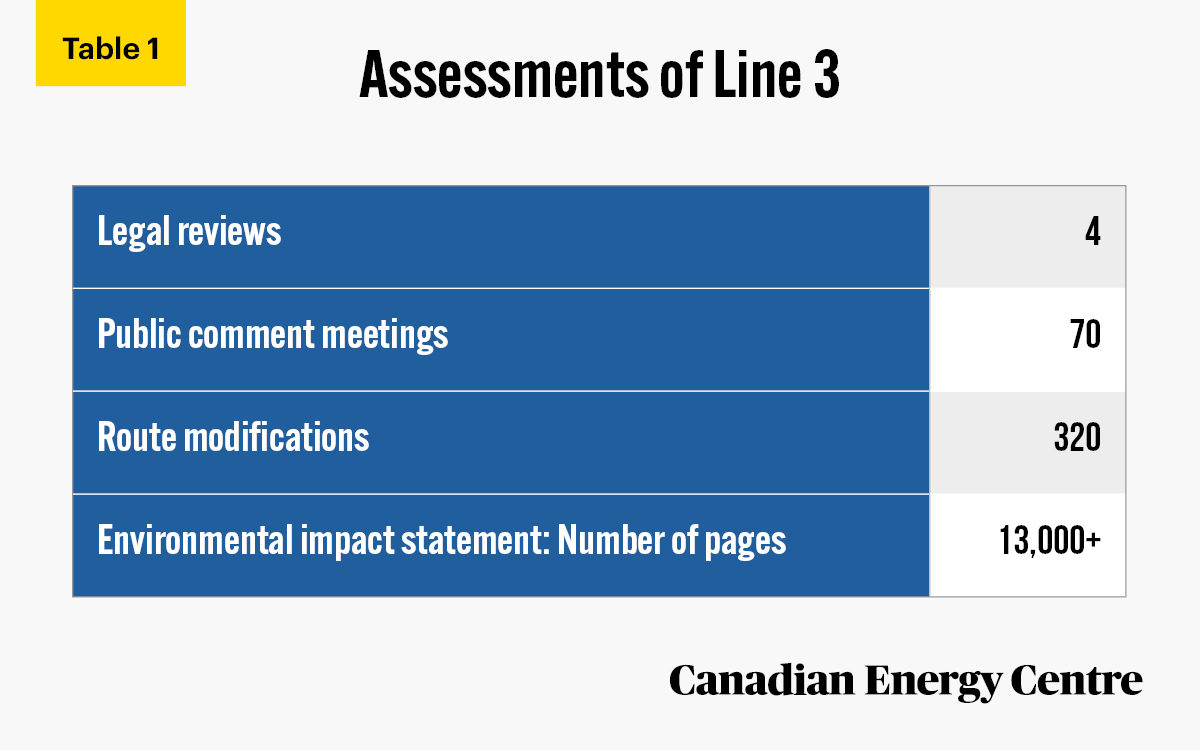
Source: Minneapolis Star-Tribune, 2020.
Despite the many discussions about the potential impact of the Line 3 Replacement Project, there has been little analysis of the strong energy-related links between Minnesota and Canada, most notably energy trade (exports and imports). Oil and gas are important to Minnesota’s economy, particularly to the state’s jobs, labour income, wages generated, and GDP. These impacts are useful to consider in any discussion of the Line 3 Replacement Project.
Energy trade flows between Minnesota and Canada
In 2019, the total value of the trade flows of energy products¹ between Minnesota and Canada was nearly CA$8.3 billion, or about US$6.4 billion (see Table 2).
1. Energy products include conventional crude oil, natural gas, hard coal, brown coal, fuel wood, and solid fuel products, coke and other coke oven products, motor gasoline (including blending components and ethanol fuels), electricity, nuclear fuel, aviation fuel, diesel and biodiesel fuels, light fuel oils, heavy fuel oils, and natural gas liquids (including condensate) and related products.
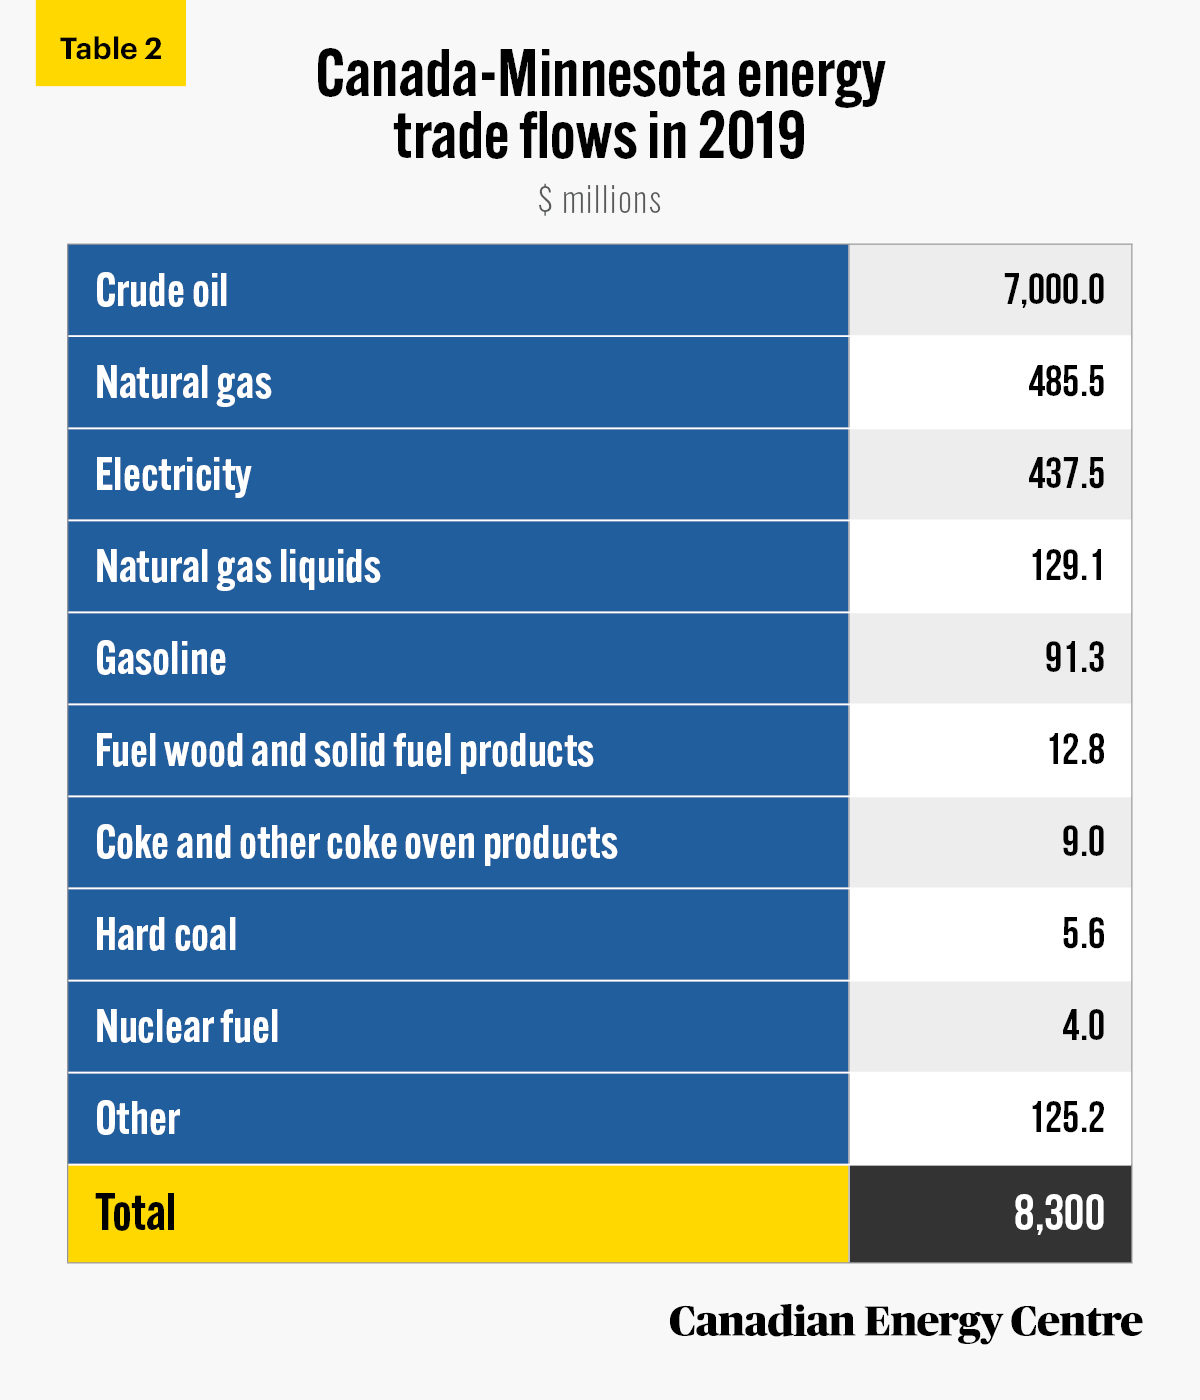
Source: Statistics Canada, International Accounts and Trade Division (2021a and 20201b).
The total value of energy products imported to Canada from Minnesota was over CA$134.2 million in 2019.²
This includes:
- $90.6 million in motor gasoline;
- $21.6 million in diesel and biodiesel fuels;
- $9 million in coke and other coke oven products;
- $5.6 million in hard coal; and
- $5.4 million in fuel wood and solid fuel products.
The total value of energy products exported from Canada to Minnesota was over CA$8.1 billion in 2019.³ This includes:
- Over $7 billion in conventional crude oil;
- $480.8 million in natural gas;
- $437.5 million in electricity;
- $127.3 million in natural gas liquids (including condensate) and related products;
- $49.3 million in diesel and biodiesel fuels;
- $7.4 million in fuel wood and solid fuel products; and
- $2.5 million in nuclear fuel.
2. See Statistics Canada, International Accounts and Trade Division, 2021a.
3. See Statistics Canada, International Accounts and Trade Division, 2021b.
Why is the oil pipeline industry important to the Minnesota economy?
Minnesota does not have its own source of petroleum. Why then does oil, its volumes, and oil pipelines have a significant, positive impact on Minnesota’s economy? The answer is found in Minnesota’s location and how it acts as key hub for the oil pipeline network.
Here is how the Minnesota House of Representatives’ Research Department describes the key aspects of oil (in particular), pipelines and refineries and their importance to the state and its strategic location and importance.
As a state with no indigenous oil supply situated in a relatively remote and sparsely populated region, Minnesota would not be expected to be more than a minor component of North America’s oil supply system. However, the state’s strategic location between the oilfields of western Canada and North Dakota and the refining centers of the Midwest, the Gulf of Mexico, and the eastern coasts of the United States and Canada, has greatly magnified the role it plays in meeting America’s demand for petroleum products.
The Minnesota Information Brief further notes that,
In addition to serving as the primary shipping route for Canadian crude oil destined for refineries in other states, Minnesota produced or imported more than five billion gallons of petroleum products for use by its own residents in 2017. As a state lacking petroleum deposits, Minnesota must import both the crude oil its refineries process and additional quantities of refined products, such as gasoline and fuel oil.
Here are the various ways in which the petroleum and pipeline industry exists in Minnesota and why its impact is significant to the Minnesota economy. We are citing directly from the state brief but in bullet points:
- Minnesota has two petroleum refineries, which produce more than two-thirds of the state’s petroleum products.
- Seventy per cent of these products are refined from Canadian crude oil, supplemented by supplies from North Dakota’s Bakken field.
- An extensive system of pipelines brings crude oil to Minnesota’s refineries and distributes refined products throughout the state, including products transported from refineries located in other states.
- Twenty-five major petroleum storage terminals located along the routes of these pipelines, including 15 in Minnesota, store refined petroleum products.
- The stored products are accessed by rail and truck for delivery to retailers throughout Minnesota.
In summary, Minnesota House of Representatives’ Research Department notes that,
Approximately 30 per cent of all U.S. crude oil imports flow through Minnesota, the primary route for Canadian oil supplies. Canada’s crude oil exports to this country grew by 81 per cent between 2007 and 2017, reaching 1.25 billion barrels per year. Canada is by far the largest foreign crude source for the United States, accounting for 43 per cent of all imports, more than those of the next six countries combined. Even as U.S. domestic crude production has soared over the past decade, Canadian supplies have become a larger fraction of the total of domestic and imported crude, rising from 11.4 per cent of the total in 2010 to 19.8 per cent in 2017. Twothirds of those Canadian imports are shipped through Minnesota….
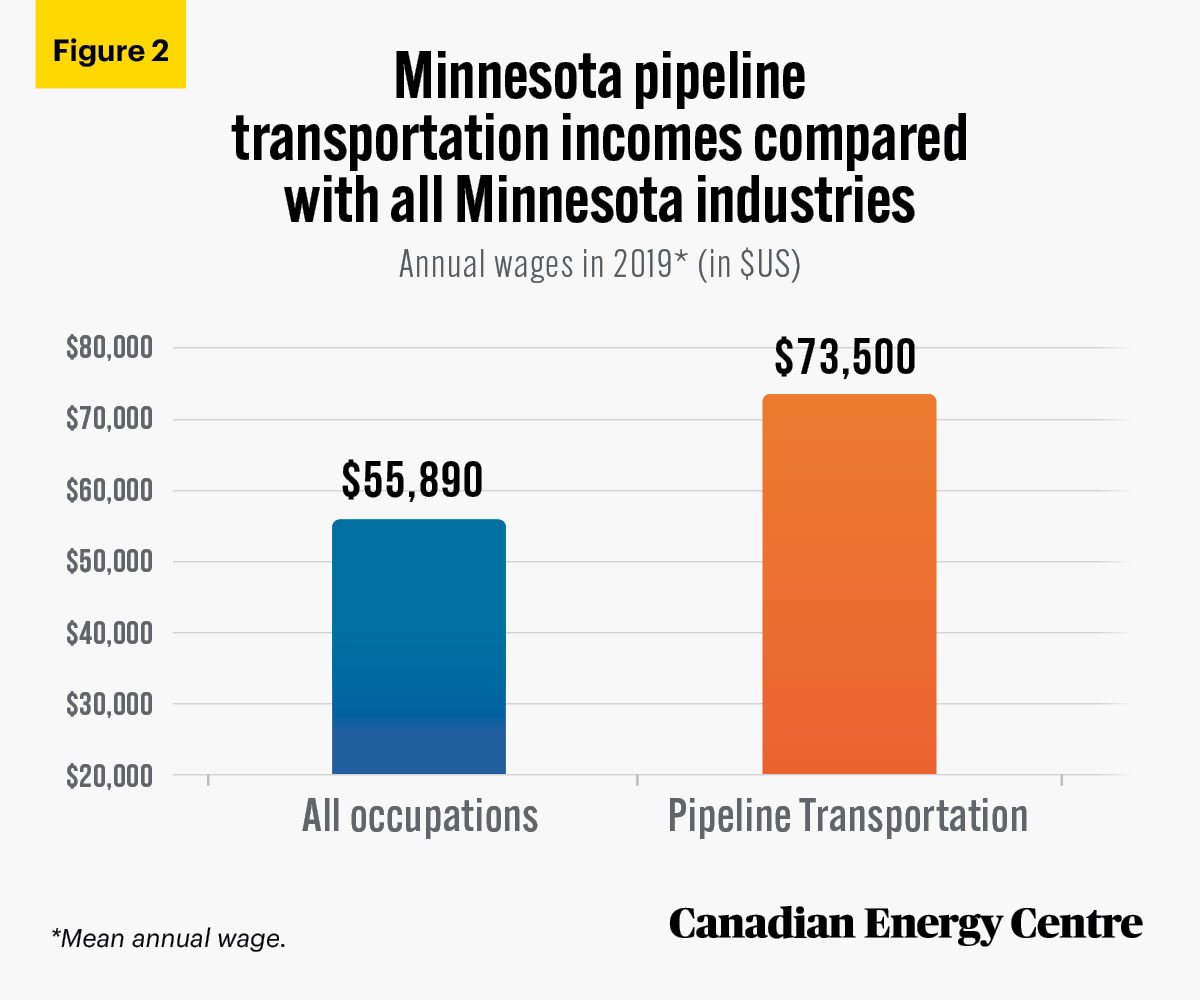
Key labour income statistics for pipelines
As an example of the benefits of the pipeline industry in Minnesota, consider a snapshot of wages and incomes (see Figure 1 and Figure 2). According to the US Bureau of Labour Statistics, as of May 2019, the annual mean wage⁴ for those employed in the pipeline transportation sector⁵ in Minnesota was $73,500. That was more than 32 per cent higher than the annual mean wage for all occupations in Minnesota ($55,890).
4. Annual wages have been calculated by multiplying the hourly mean wage by a “year-round, full-time” figure of 2,080 hours; for those occupations where there is no published hourly wage, the annual wage has been directly calculated from the reported survey data.
5. Industries in the Pipeline Transportation subsector use transmission pipelines to transport products, such as crude oil, natural gas, refined petroleum products, and slurry. Industries are identified based on the products transported (i.e., pipeline transportation of crude oil, natural gas, refined petroleum products, and other products).
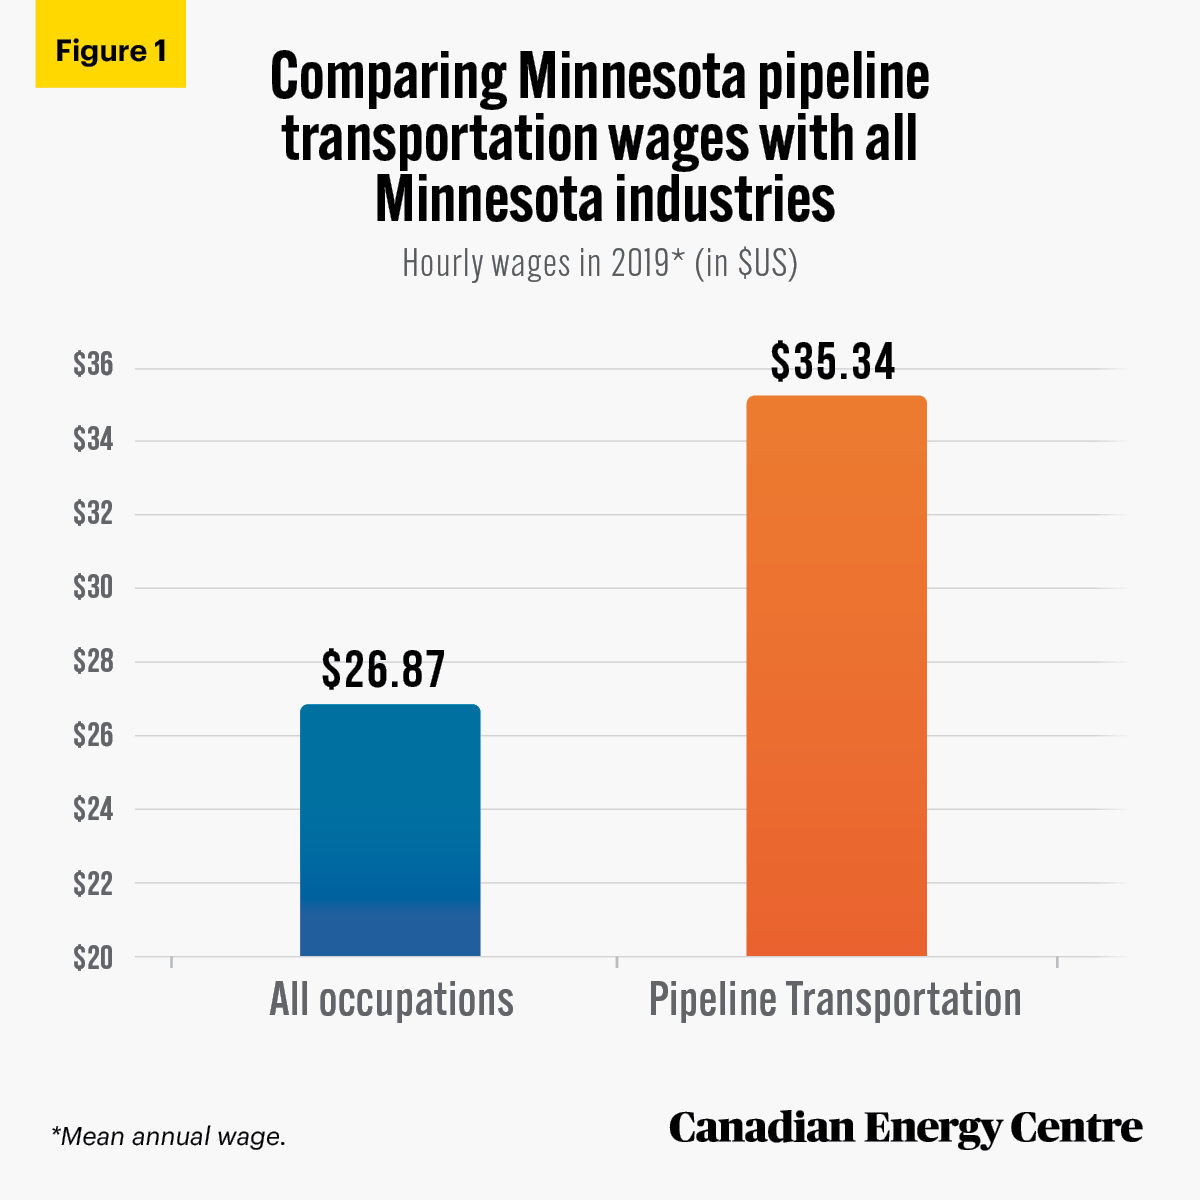
Source: US Bureau of Labor Statistics (2020).
Source: US Bureau of Labor Statistics (2020).
Conclusion
Minnesota and Canada have strong and valuable energy links. The impact of these links should be emphasized in the discussions taking place over the Line 3 Replacement Project.
Notes
This CEC Fact Sheet was compiled by Lennie Kaplan and Mark Milke at the Canadian Energy Centre (www.canadianenergycentre.ca). The authors and the Canadian Energy Centre would like to thank and acknowledge the assistance of Philip Cross in reviewing the data and research for this Fact Sheet. Image credit: Matt Barton from Unsplash.com
References (All links live as of March 24, 2021)
Bank of Canada (undated) <https://bit.ly/3spjpg0> Currency Converter, December 31, 2019 date assumed; Minneapolis Star Tribune (2020). The Approval of Enbridge Line 3 Should Be a No-Brainer. <http://strib.mn/3eP22kt>; Minnesota House of Representatives, Research Division (2018). Minnesota’s Petroleum Infrastructure: Pipelines, Refineries, Terminals. <https://bit.ly/3cDNbb9>; Statistics Canada, International Accounts and Trade Division (2021a), Imports for Specified NAPCS Codes from the United States (Country of Export) by U.S. State of Export, Province of Clearance and Mode of Transport (2019), Custom Tabulation; Statistics Canada International Accounts and Trade Division (2021b), Total Exports for Specified NAPCS Codes to the United States (Country of Destination) by U.S. State of Destination, Province of Origin, Province of Clearance and Mode of Transport (2019), Custom Tabulation; US Bureau of Labor Statistics (2020). Occupational Employment and Wages, May 2019 <http://bit.ly/3a9ZIRa>.
Creative Commons Copyright
Research and data from the Canadian Energy Centre (CEC) is available for public usage under creative commons copyright terms with attribution to the CEC. Attribution and specific restrictions on usage including non-commercial use only and no changes to material should follow guidelines enunciated by Creative Commons here: Attribution-NonCommercial-NoDerivs CC BY-NC-ND.