
To sign up to receive the latest Canadian Energy Centre research to your inbox email: [email protected]
Download the PDF Here
Download the charts Here
Overview
Given recent attention about the prospects for Canadian liquefied natural gas (LNG) exports to assist in providing global energy security and the reduction of global greenhouse gas (GHG) emissions, it is useful to examine global LNG markets and Canada’s role in those markets over the next decade. After years of regulatory stagnation and conflicted pipeline construction, Canada has yet to deliver a single LNG shipment, while competitors ramp-up production to meet soaring global demand.
However, there remains a very strong business case for Canadian LNG, particularly LNG exports into growing Asia-Pacific markets. In this CEC Fact Sheet, we examine projected trends in global LNG markets in 2035, around such indicators as production and demand, exports and imports, liquefaction capacity, and regasification capacity. We also assess the potential for Canada’s participation in global LNG markets on the assumption that current policy and regulatory impediments to LNG are finally removed.
The information is compiled using Rystad Energy’s Gas and LNG Markets Solution. The written content in this report was prepared by the Canadian Energy Centre (CEC) and does not represent the views of Rystad Energy.
Background on Rystad Gas and LNG Markets Solution and Upstream Solution
Rystad Energy is an independent energy research company providing data, analytics and consultancy services to clients around the globe.
The Rystad Energy Gas and LNG Markets Solution is a database that provides a comprehensive overview of production assets, country-specific demand, international pipeline gas and LNG trade, economic and financial field and infrastructure data, contract data, as well as long-term price forecasts for the main global trading hubs. It analyzes natural gas balances, including pipeline and LNG trade flows (Rystad Energy, 2023a).
The Upstream Solution is Rystad Energy’s global upstream database, including production and economics (costs, revenues, and valuations) for more than 80,000 assets, covering the portfolios of more than 3,500 companies. The UCube data set is used to study all parts of the global oil and gas exploration and production (E&P) activity value chain, including operational costs (opex), capital investment (capex), fiscal terms, and net cash flows for projects and companies, both globally and by country. (Rystad Energy, 2023b).
Global LNG production reaches nearly 720 million tonnes of LNG by 2035; Canada could become the world’s fifth largest LNG producer
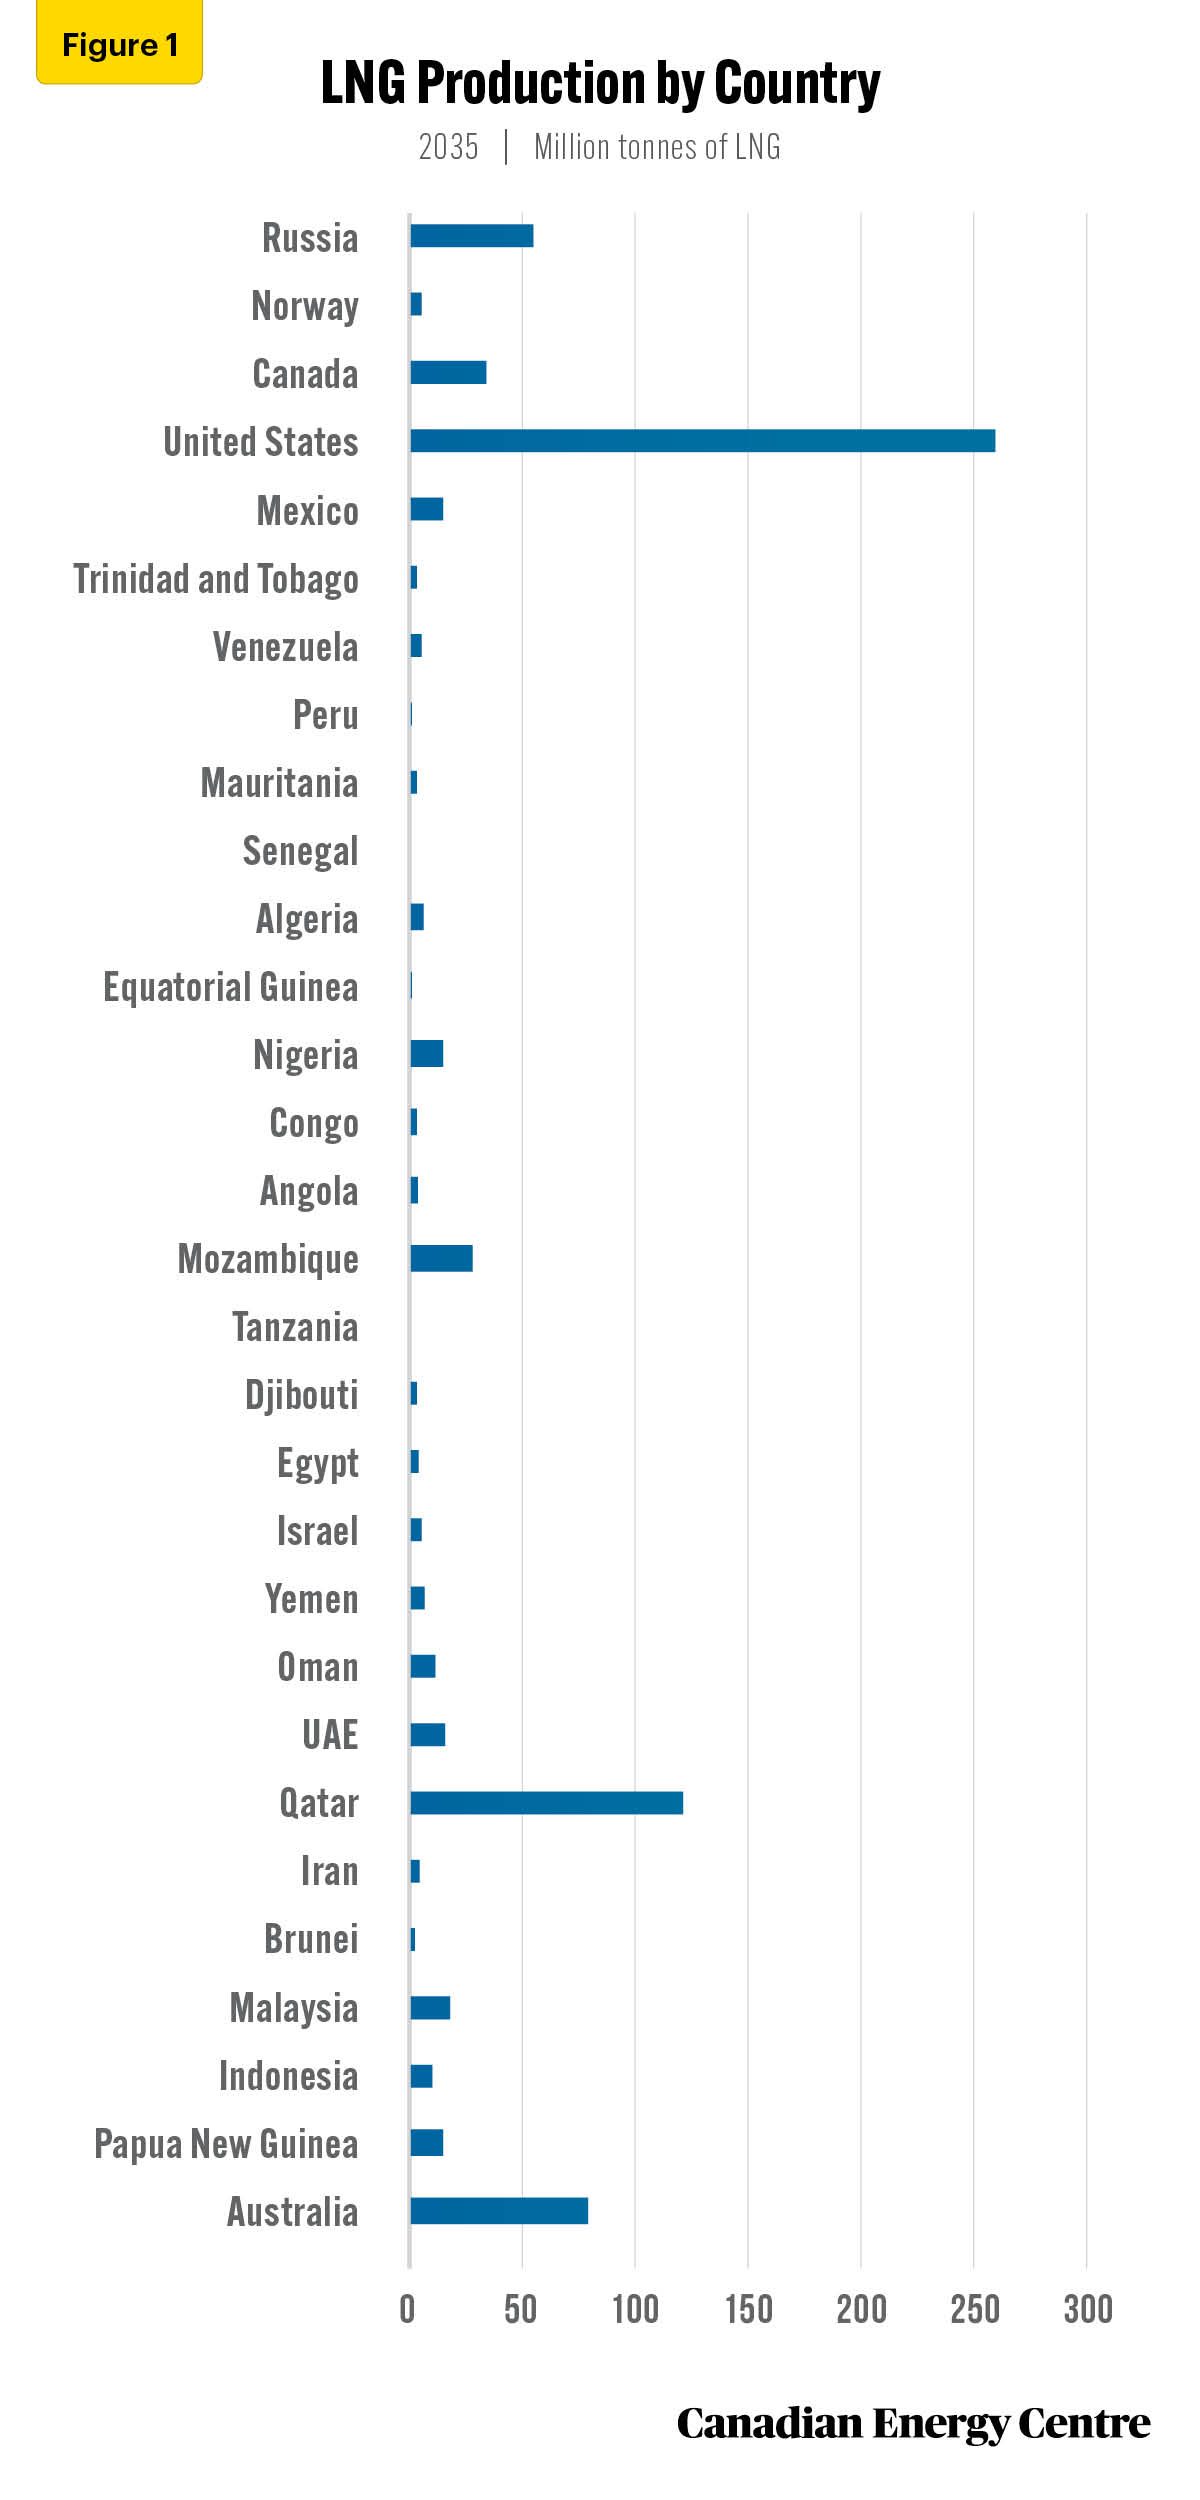
Global LNG production is forecast to increase to nearly 720 million tonnes of LNG by 2035.
Figure 1 shows LNG production in 2035 by major LNG[1]producing country. In 2035, the United States is the world’s leading LNG producer at 259 million tonnes of LNG, followed by Qatar at 121 million tonnes of LNG, and Australia at 78 million tonnes of LNG. Russian LNG supply was expected to grow to 54 million tonnes of LNG by 2035, but this is now in question, leaving opportunities for countries such as Canada to fill the void.
In fact, by 2035, Canada is projected to be the fifth largest LNG producer at nearly 33 million tonnes of LNG (see Figure 1).
Source: Derived from Rystad Energy Gas Market Cube.
Global LNG demand reaches over 702 million tonnes of LNG by 2035
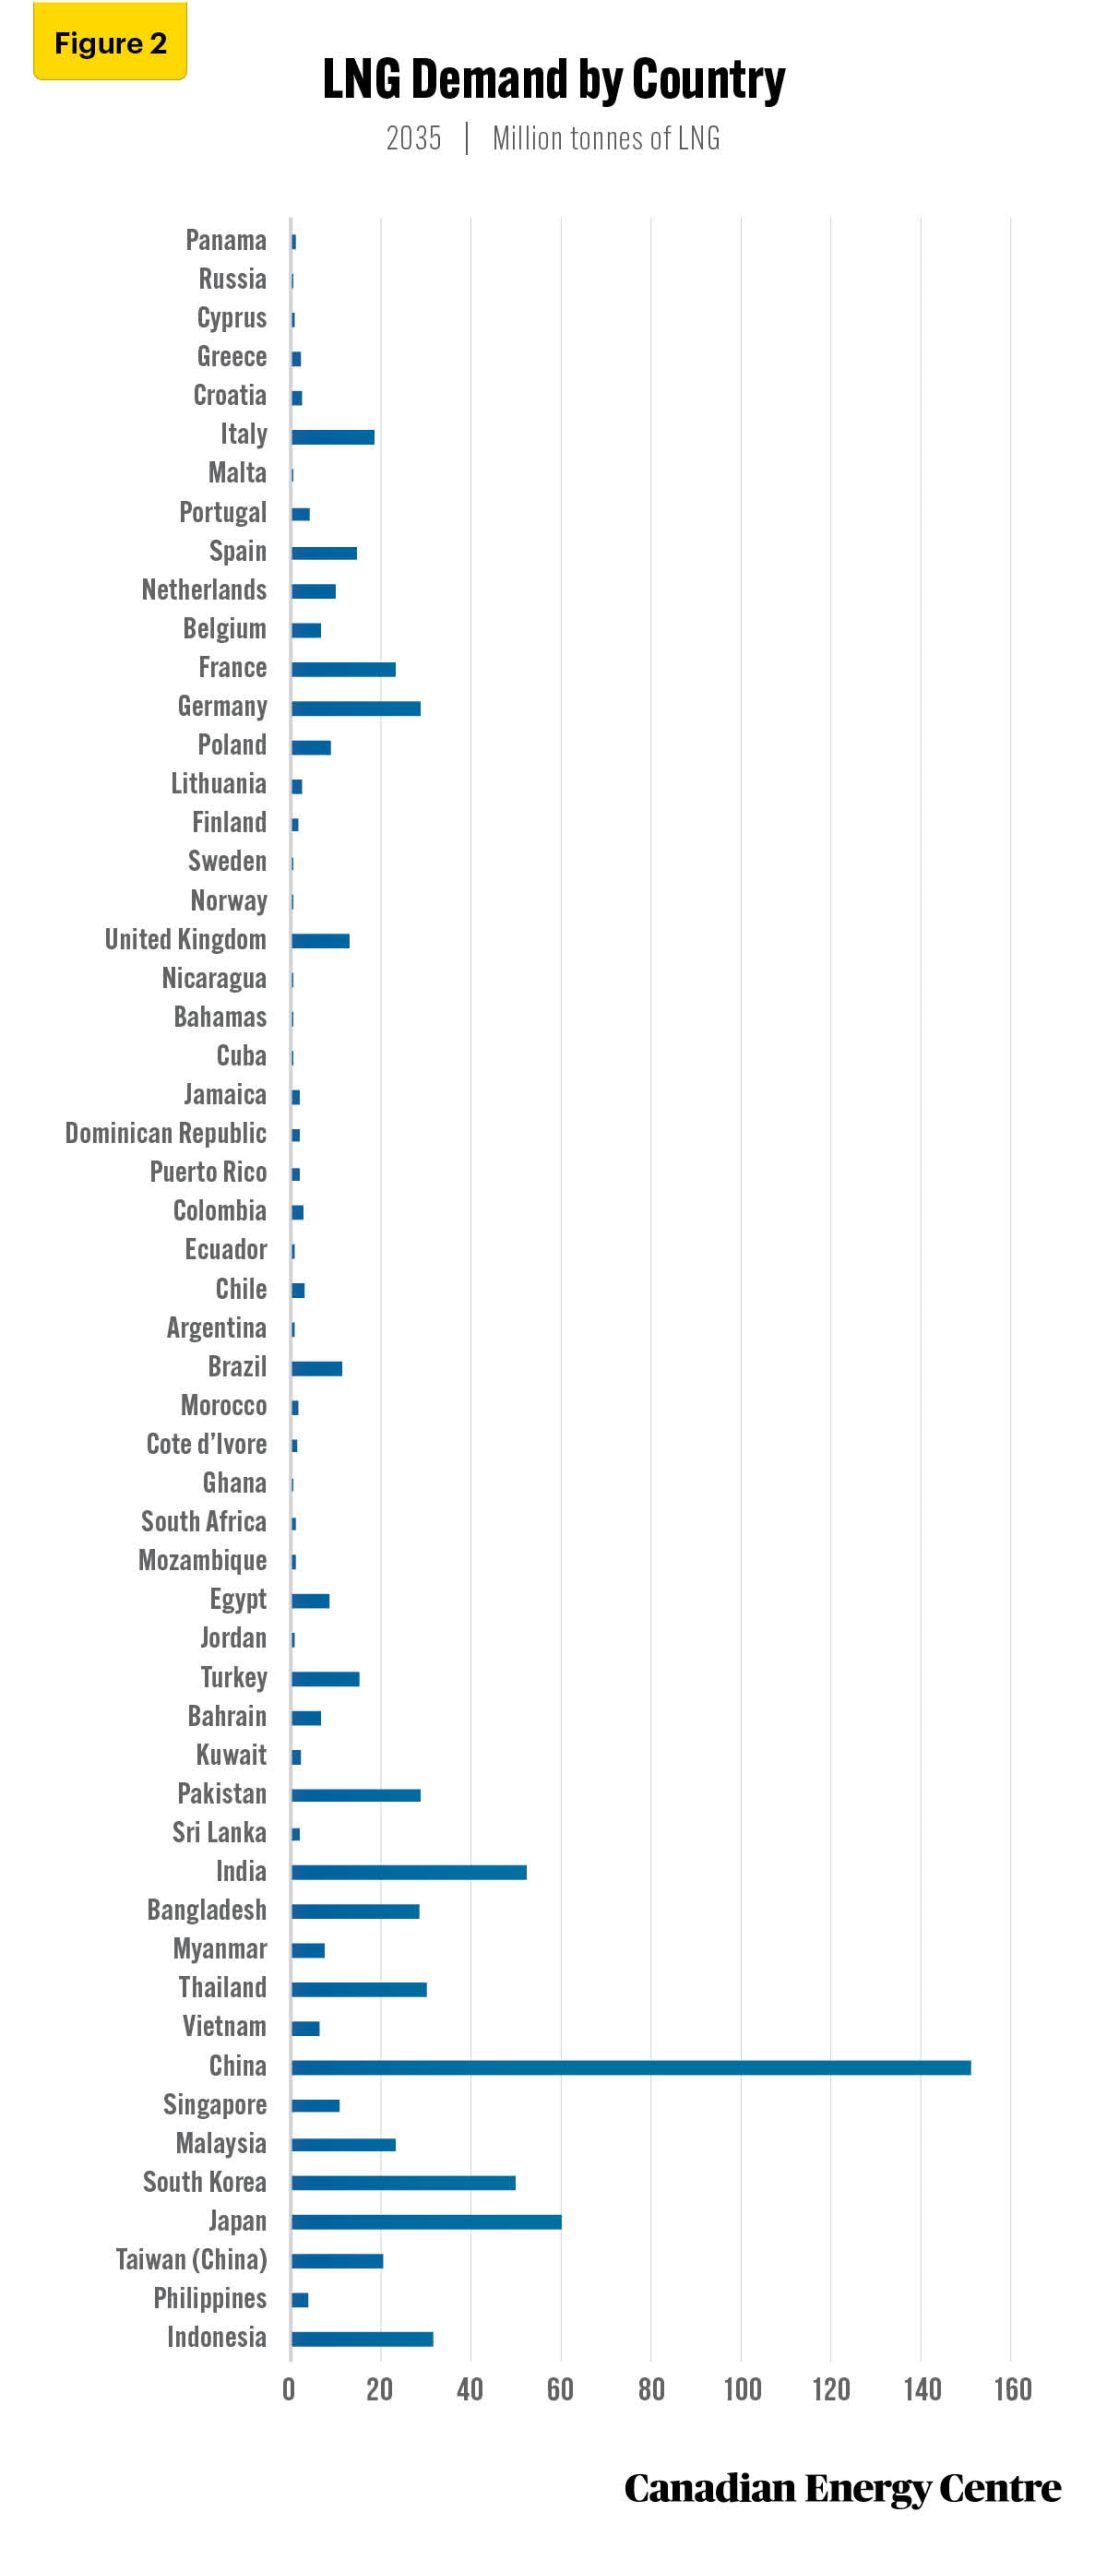
Global LNG demand is expected to reach over 702 million tonnes of LNG as of 2035.
In 2035, LNG demand in China is forecast to reach nearly 151 million tonnes of LNG, followed by Japan at 60 million tonnes of LNG, India at 52 million tonnes of LNG, South Korea at 50 million tonnes of LNG and Indonesia at 31 million tonnes of LNG. The largest demand markets for LNG are clearly in Asia (see Figure 2)
Source: Derived from Rystad Energy Gas Market Cube.
Global LNG exports reach nearly 715 million tonnes of LNG by 2035: Canada could become the world’s fifth largest LNG exporter
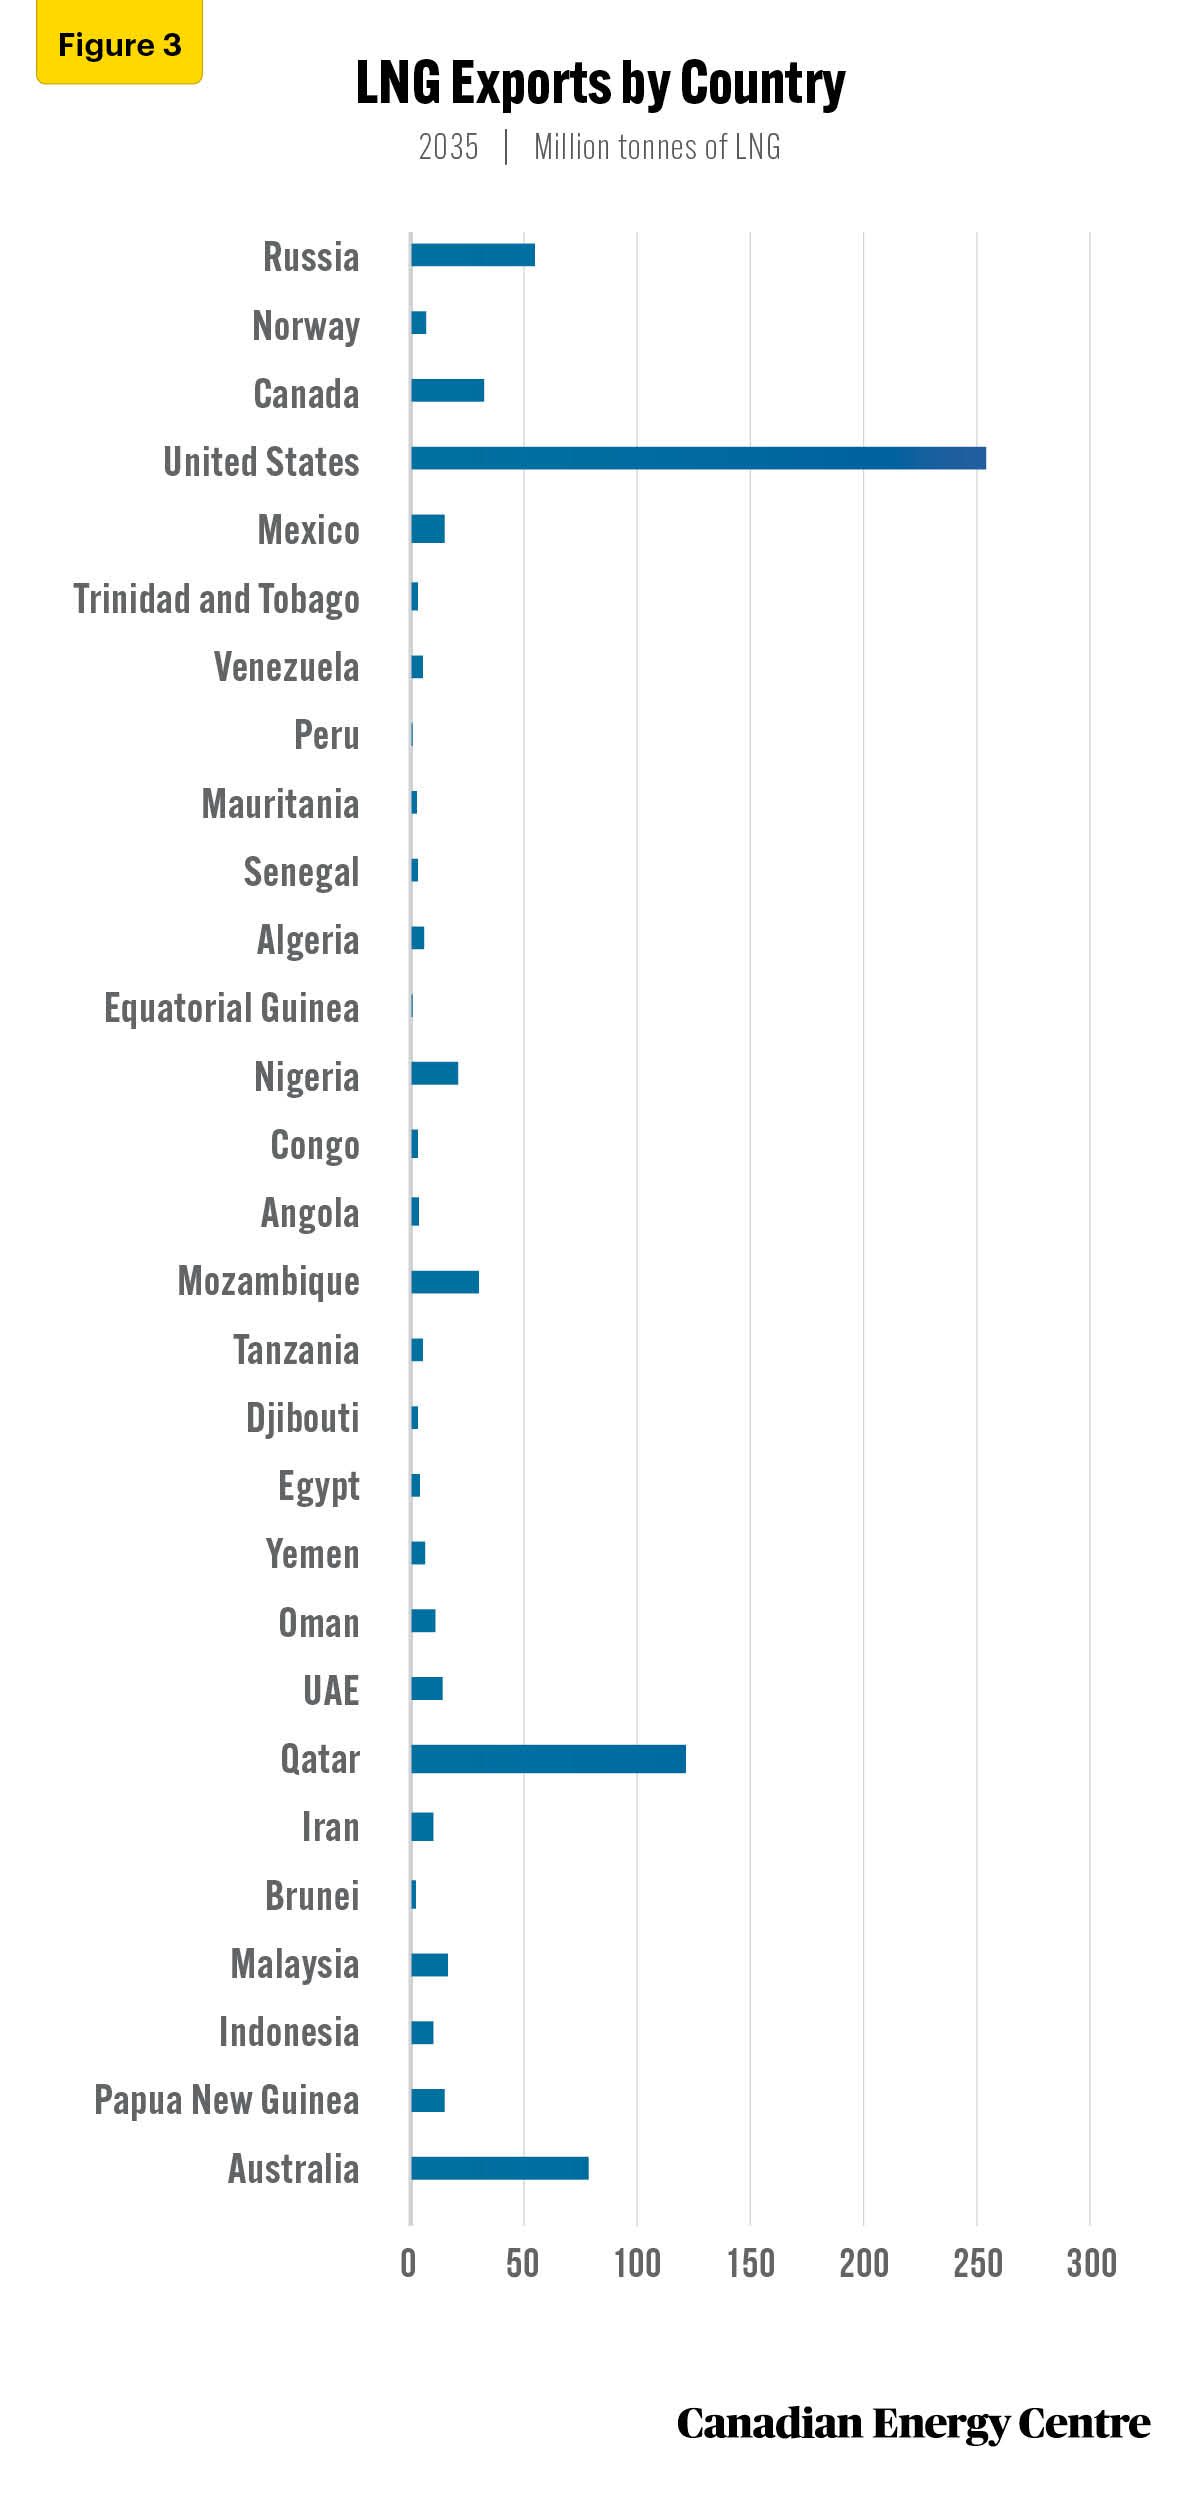
Global LNG exports are forecast to reach nearly 715 million tonnes of LNG by 2035.
Figure 3 shows LNG exports in 2035 by major LNG-exporting country. In 2035, the United States is expected to be the world’s leading LNG exporter at 253 million tonnes of LNG, followed by Qatar at 121 million tonnes of LNG, and Australia at 78 million tonnes of LNG. Russian LNG exports were expected to grow to 54 million tonnes of LNG by 2035, but this is now in question, leaving opportunities for countries such as Canada to fill the void.
In fact, by 2035, Canada is projected to be the fifth largest LNG exporter at nearly 32 million tonnes of LNG (see Figure 3)
Source: Derived from Rystad Energy Gas Market Cube.
Global LNG imports reach over 702 million tonnes of LNG by 2035
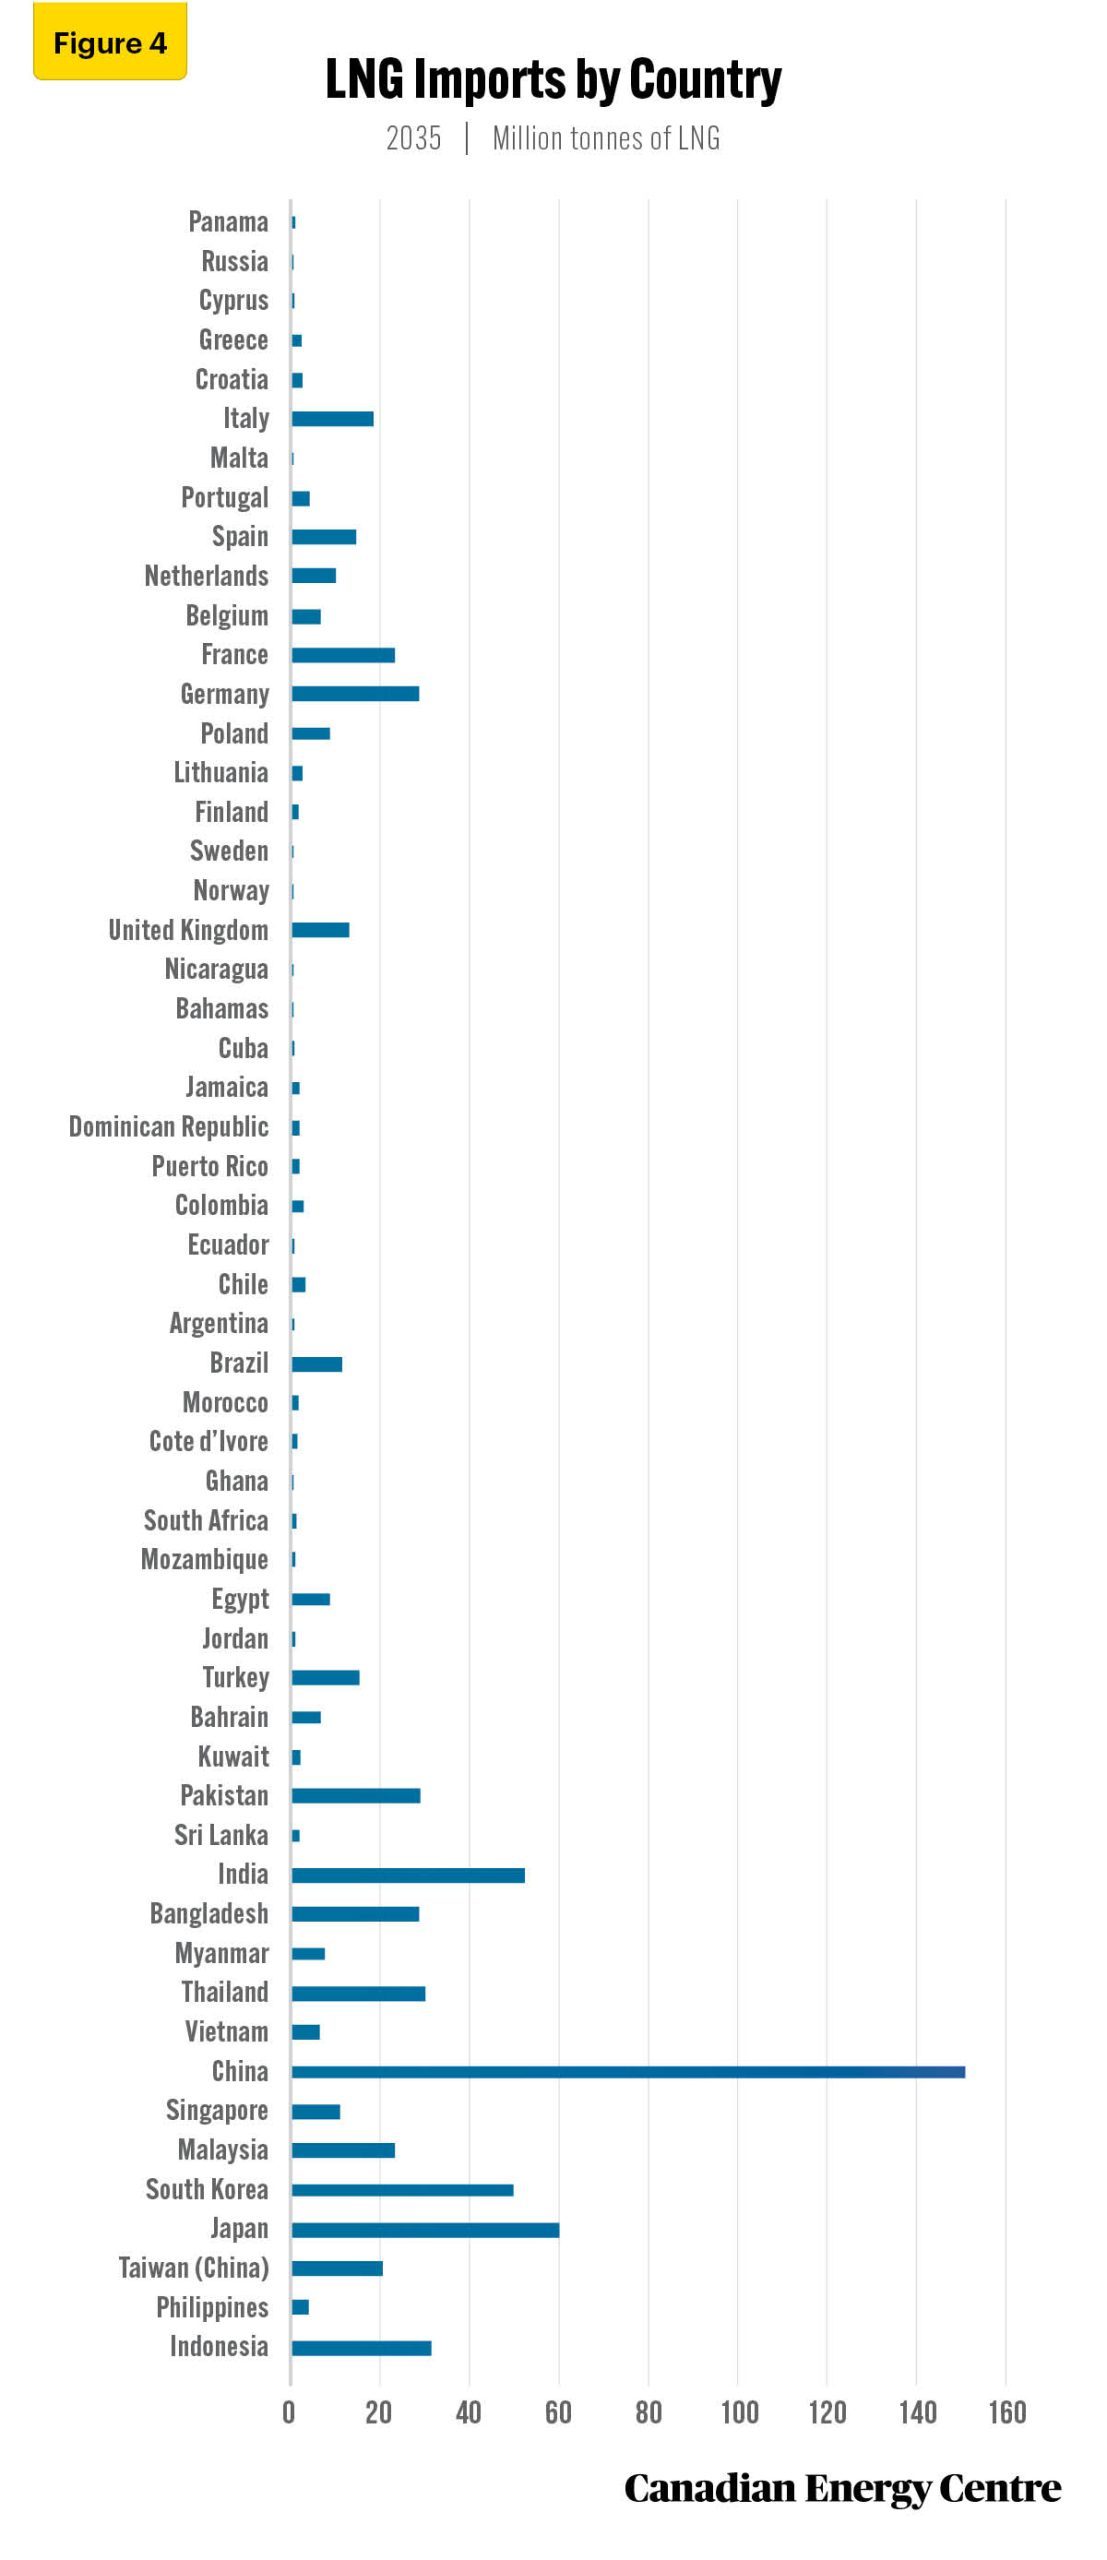
Global LNG imports are expected to reach over 702 million tonnes of LNG as of 2035. In 2035, LNG imports to China are forecast to reach nearly 151 million tonnes of LNG, followed by Japan at 60 million tonnes of LNG, India at 52 million tonnes of LNG, South Korea at 50 million tonnes of LNG, and Indonesia at 31 million tonnes of LNG. The largest import markets for LNG are clearly in Asia (see Figure 4)
Source: Derived from Rystad Energy Gas Market Cube.
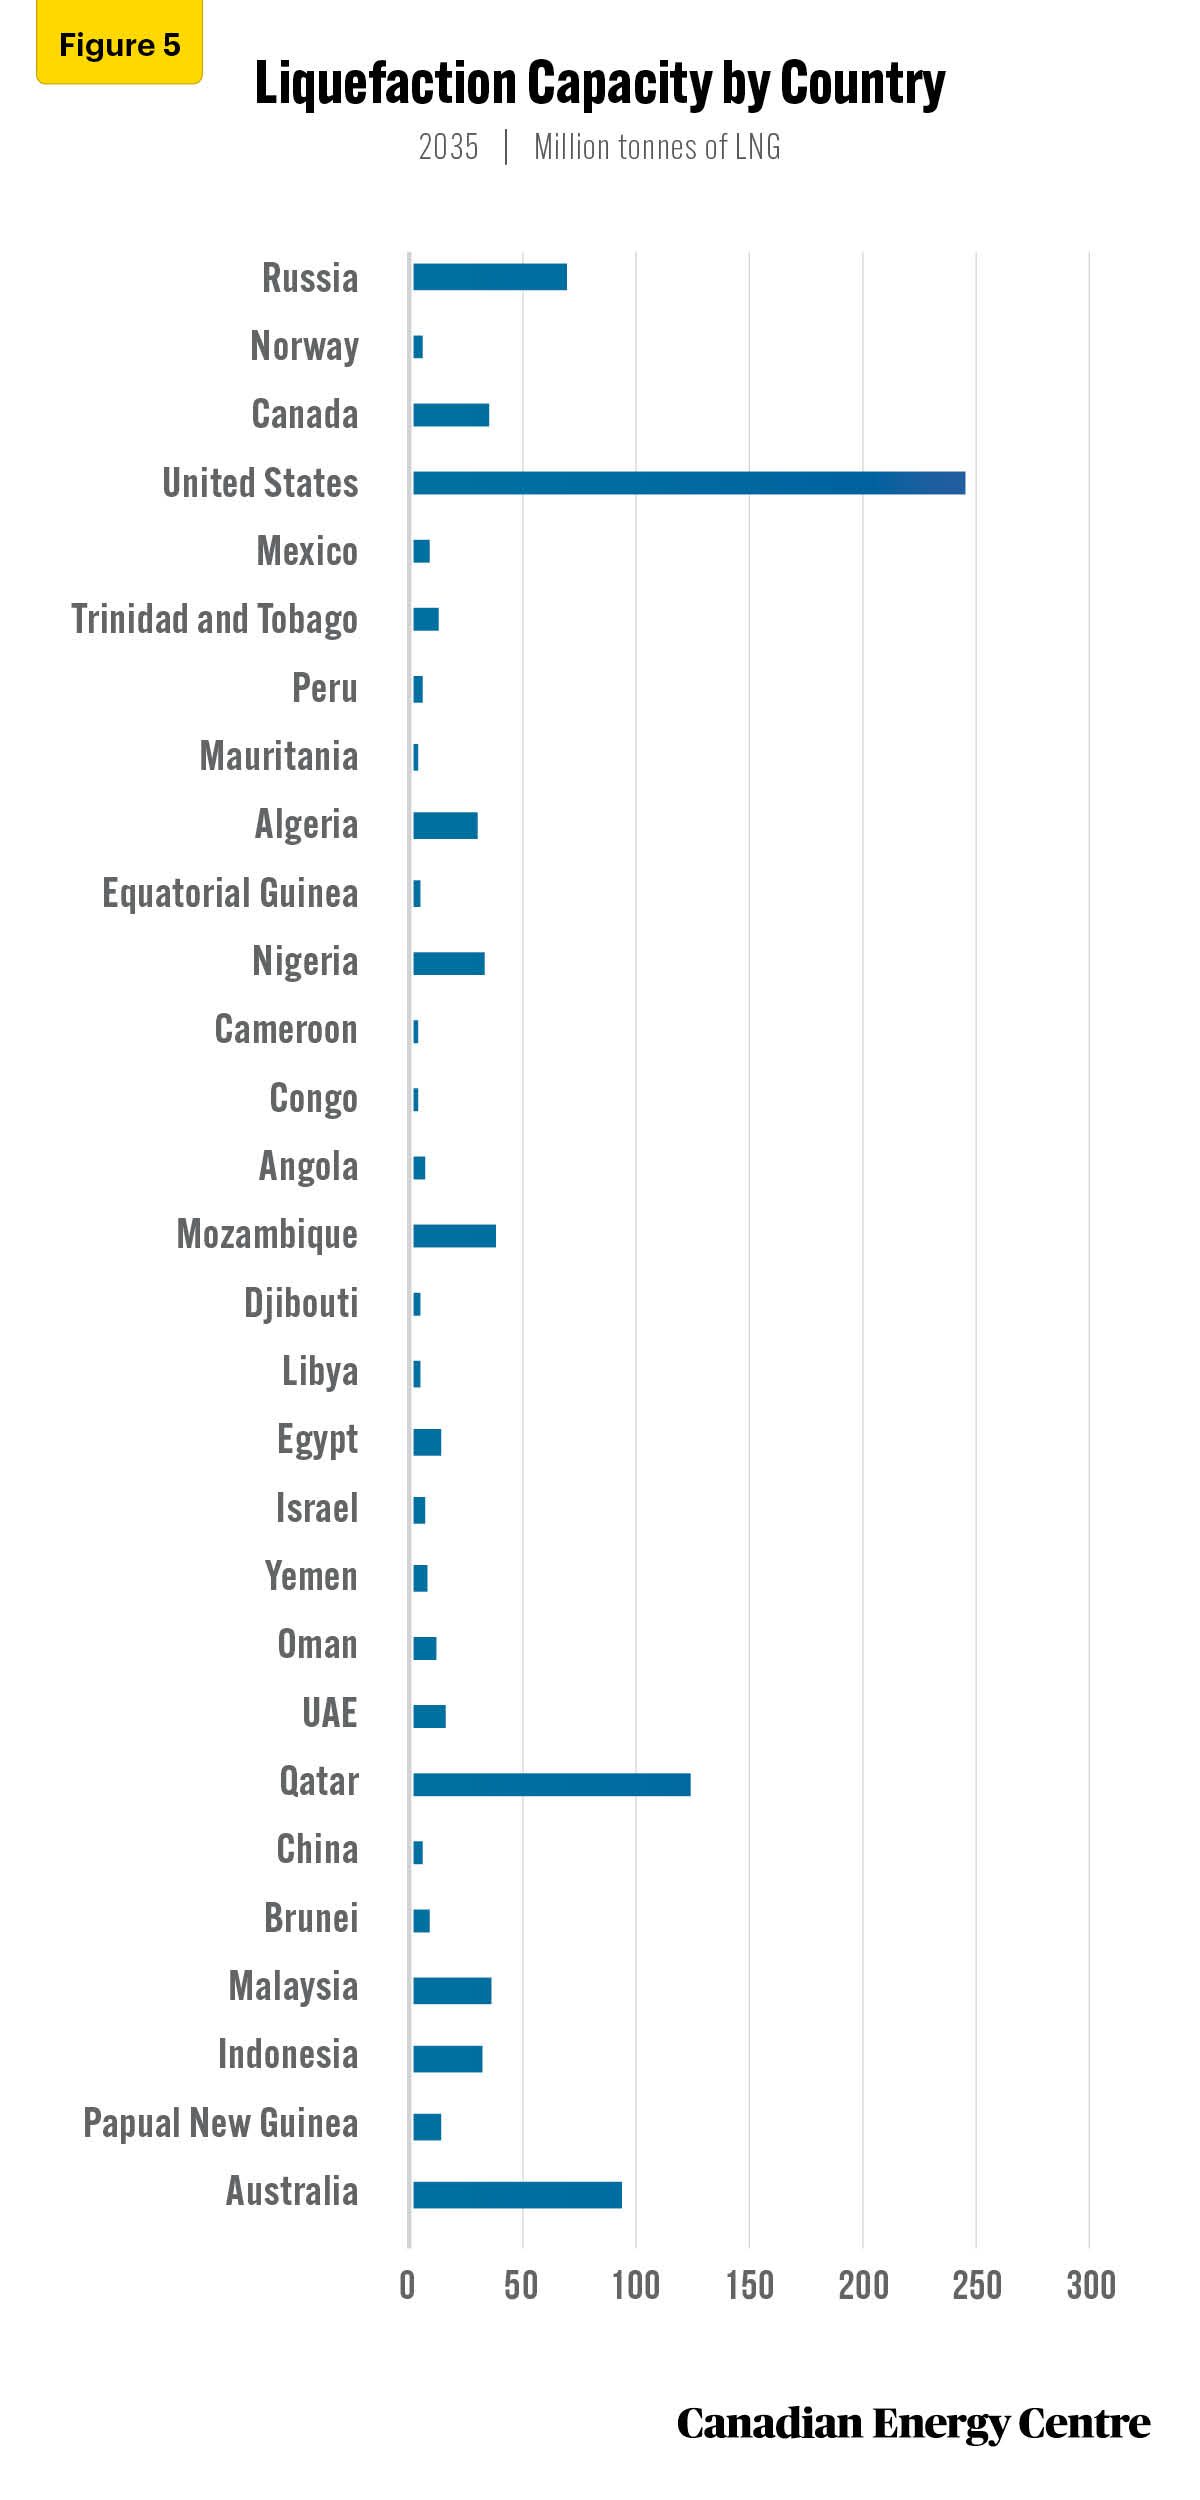
Global liquefaction capacity reaches over 850 million tonnes of LNG in 2035: Canada could have the seventh highest liquefaction capacity
Global LNG liquefaction (excluding speculative and closed projects) is expected to reach over 850 million tonnes of LNG as of 2035.
Figure 5 shows global liquefaction capacity in 2035 by country. In 2035, the United States will have the world’s leading liquefaction capacity at over 246 million tonnes of LNG, followed by Qatar at 124 million tonnes of LNG, and Australia at 93 million tonnes of LNG. Russian LNG supply was expected to grow to 68 million tonnes of LNG by 2035, but this is now in question, leaving opportunities for countries such as Canada to fill the void.
In fact, by 2035, Canada is projected to have the seventh largest liquefaction capacity at 34 million tonnes of LNG (see Figure 5)
Source: Derived from Rystad Energy Gas Market Cube.
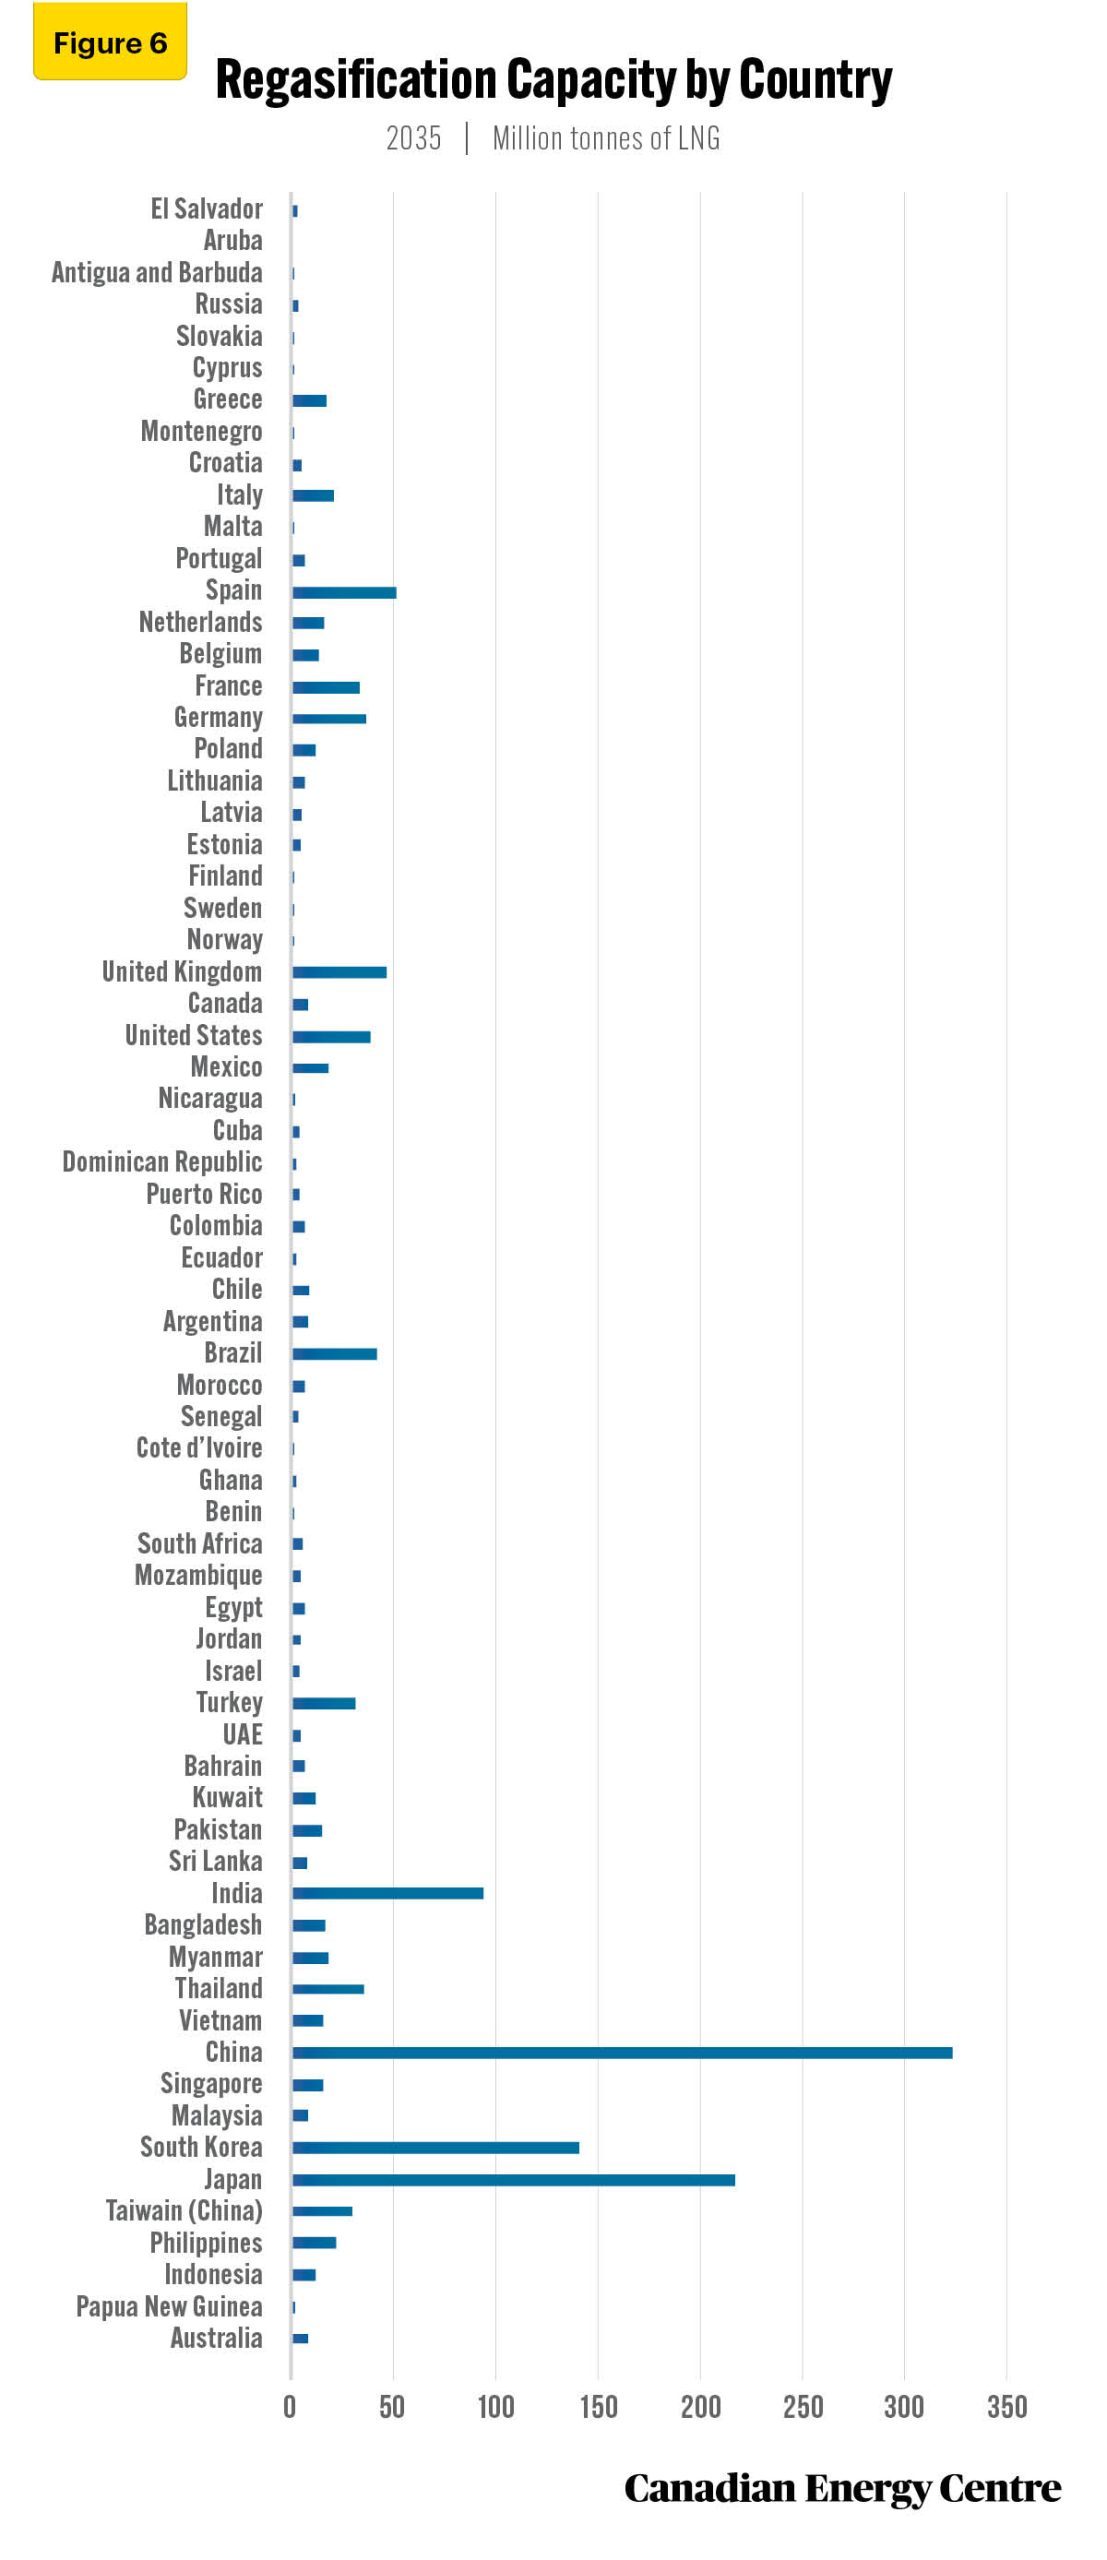
Global regasification capacity to reach nearly 1,471 million tonnes of LNG by 2035
Global regasification capacity (excluding speculative and closed projects) is expected to reach nearly 1,471 million tonnes of LNG as of 2035.
Figure 6 shows global regasification capacity in 2035 by country. In 2035, China will have the world’s leading regasification capacity at 324 million tonnes of LNG, followed by Japan at 218 million tonnes of LNG, South Korea at 141 million tonnes of LNG, and India at 94 million tonnes of LNG (see Figure 6).
Source: Derived from Rystad Energy Gas Market Cube.
Conclusion
Based on the analysis of such key indicators as production and demand, exports and imports and liquefaction and regasification capacity, it appears that the prospects for global LNG markets are promising through 2035. Clearly, there is at strong business case for Canadian LNG.
The rate at which the Canada evolves in these global LNG markets will greatly depend on responsive fiscal and regulatory regimes at the federal and provincial levels.
If policy and regulatory impediments are finally removed, Canada has the ability to become a LNG heavyweight: the world’s fifth largest LNG producer; the world’s fifth largest LNG exporter and having the world’s seventh highest liquefaction capacity by 2035.
Notes
This CEC Fact Sheet was compiled by Lennie Kaplan at the Canadian Energy Centre (www.canadianenergycentre.ca). The author and the Canadian Energy Centre would like to thank and acknowledge the assistance of two anonymous reviewers in reviewing the original data and research for this Fact Sheet. Image credits:
References (as of April 18, 2023)
Rystad Energy. (2023a). Gas and LNG Markets Solution. <http://bit.ly/3yWZtWk>.
Rystad Energy. (2023b). Upstream Solution. (2023b). <http://bit.ly/3JTk2JK>.
Creative Commons Copyright
Research and data from the Canadian Energy Centre (CEC) is available for public usage under creative commons copyright terms with attribution to the CEC. Attribution and specific restrictions on usage including non-commercial use only and no changes to material should follow guidelines enunciated by Creative Commons here: Attribution-NonCommercial-NoDerivs CC BY-NC-ND.