
To sign up to receive the latest Canadian Energy Centre research to your inbox email: [email protected]
Download the PDF here
Download the charts here
Summary
The bilateral trade in energy products between Canada and the United States is critical for economic prosperity and North American energy security. This CEC Research Brief analyzes the economic impacts in the United States that are attributable to natural gas imported from Canada.
In 2022, about 99 per cent of the U.S.’s total annual natural gas imports were from Canada, and nearly all were by pipeline. Its imports of natural gas from Canada help support fluctuating supply in the U.S. during the winter months.
In 2022, the economic impacts across the U.S. states from Canada’s natural gas exports included 7,300 jobs, US$1 billion in employee compensation, and US$2.40 billion in value-added.
Introduction
Imports and exports are essential for the smooth and efficient operation of natural gas markets in Canada and the United States. Canada and the U.S. rank among the world’s top natural gas producers, but both countries rely on one another to maintain reliable supply in domestic markets.
The demand for natural gas is increasing in the U.S. According to the U.S. Energy Information Administration (EIA), the projected demand for dry (or consumer-grade) natural gas in the U.S. will reach 88.38 billion cubic feet per day (bcfd) in 2024. Canada is a significant exporter of natural gas to the United States.
In 2022, about 99 per cent of the U.S.’s total annual natural gas imports were from Canada, and nearly all were by pipeline. Its imports of natural gas from Canada help support fluctuating supply in the U.S. during the winter months.
The bilateral trade in energy products between the U.S. and Canada reached $236.9 billion in 2022. Canada’s energy exports comprise more than one-third of all its merchandise exports. Canada exports half of the natural gas it produces to the United States.
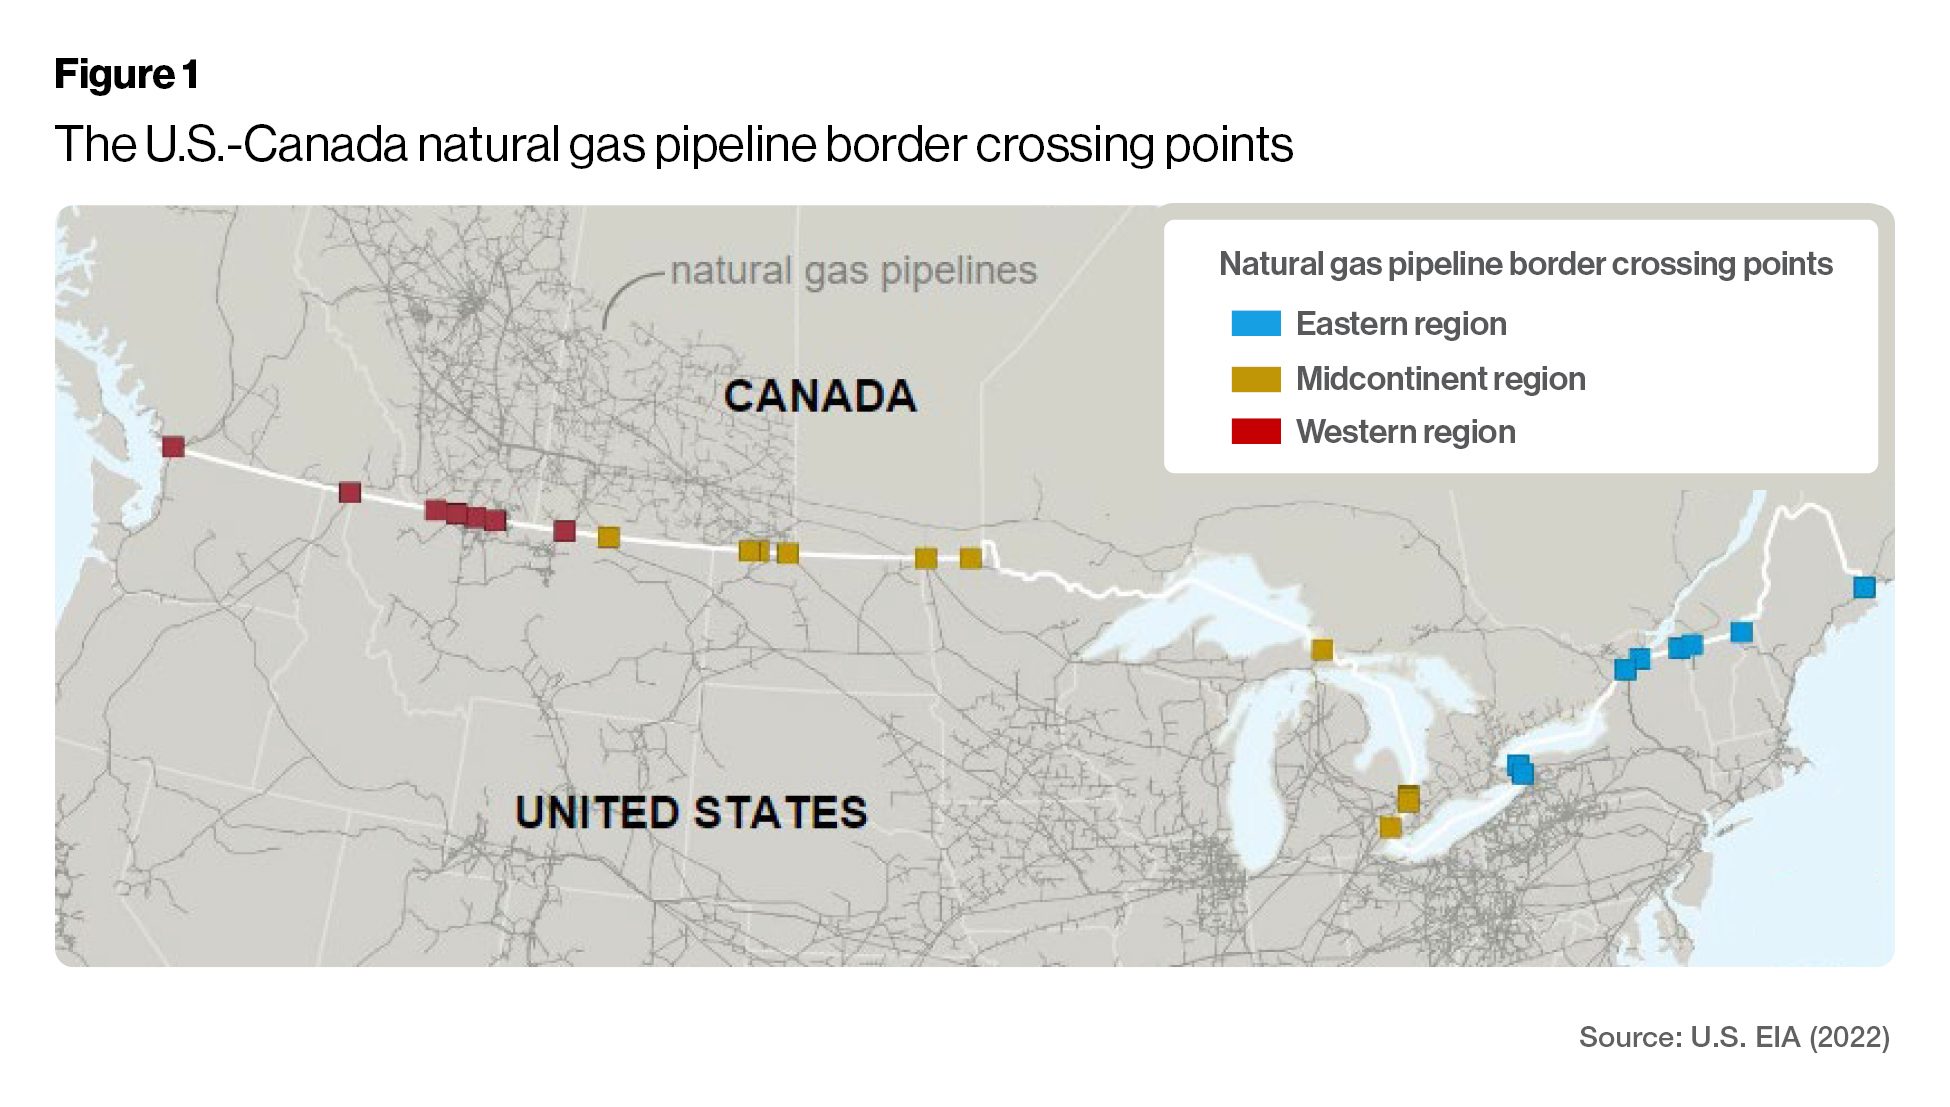
Canada’s natural gas market is highly integrated with the U.S. through a vast transmission network (see Figure 1). Seven Canadian provinces are directly connected to the U.S. pipeline network, which enables natural gas to flow between the two countries. In 2022, Canada exported natural gas worth CAN$24.6 billion to the U.S.¹
Canadian natural gas exports have an impact on the U.S. economy by adding value and creating jobs in states that import Canadian natural gas.
In this research brief, we explore the economic impact of Canadian gas exports on the downstream sector of the U.S. economy. The paper measures value-added Gross State Product (GSP) and employment to determine Canada’s contribution to the downstream natural gas distribution sector in the U.S
1. Data value for Harmonized System (HS) code 271121 – Natural gas, in gaseous state, from Canada (2023), Trade Data Online.
U.S.-Canada Natural Gas Trade
Most of the natural gas consumed in the U.S. is met by domestic production, but the U.S. still imports natural gas from Canada and Mexico to help supply domestic demand. Imports and exports are essential components of the natural gas market in the U.S. They provide additional sources of supply for U.S. natural gas customers.
Canada is the U.S.’s largest energy trading partner based on the combined value of energy exports and imports. Energy accounts for one-fourth of the value of all U.S. imports.
Most of Canada’s natural gas exports go to the U.S., though such exports have decreased in recent years. The emergence of shale gas in Western Canada and in the United States, particularly the Marcellus region, has changed international natural gas market dynamics, increasing supply in both the U.S. and Canada.
In 2022, about 99 per cent of all the natural gas that the United States imported came from Canada, nearly all transported to the U.S. through pipelines. In 2022, Canada exported 2.99 trillion cubic feet (tcf) of natural gas to the U.S., down from a peak of 3.78 tcf in 2002. On average, between January 2000 to August 2023, Canada’s monthly gas exports to the U.S. were 264,131 million cubic feet (MMcf).

Source: U.S. EIA (Undated c)
Between 2013 and 2020, the volume of natural gas exported from Canada to the U.S. declined. However, the export trade value rebounded in 2023 due to high energy prices. Between 2013 and 2022, Canada exported CAN$10 billion annually of natural gas to the U.S. In 2022, high energy prices coupled with high trade volume resulted in Canada exporting CAN$24.6 billion worth of gas to the U.S.

Source: Canada (2023), Trade Data Online
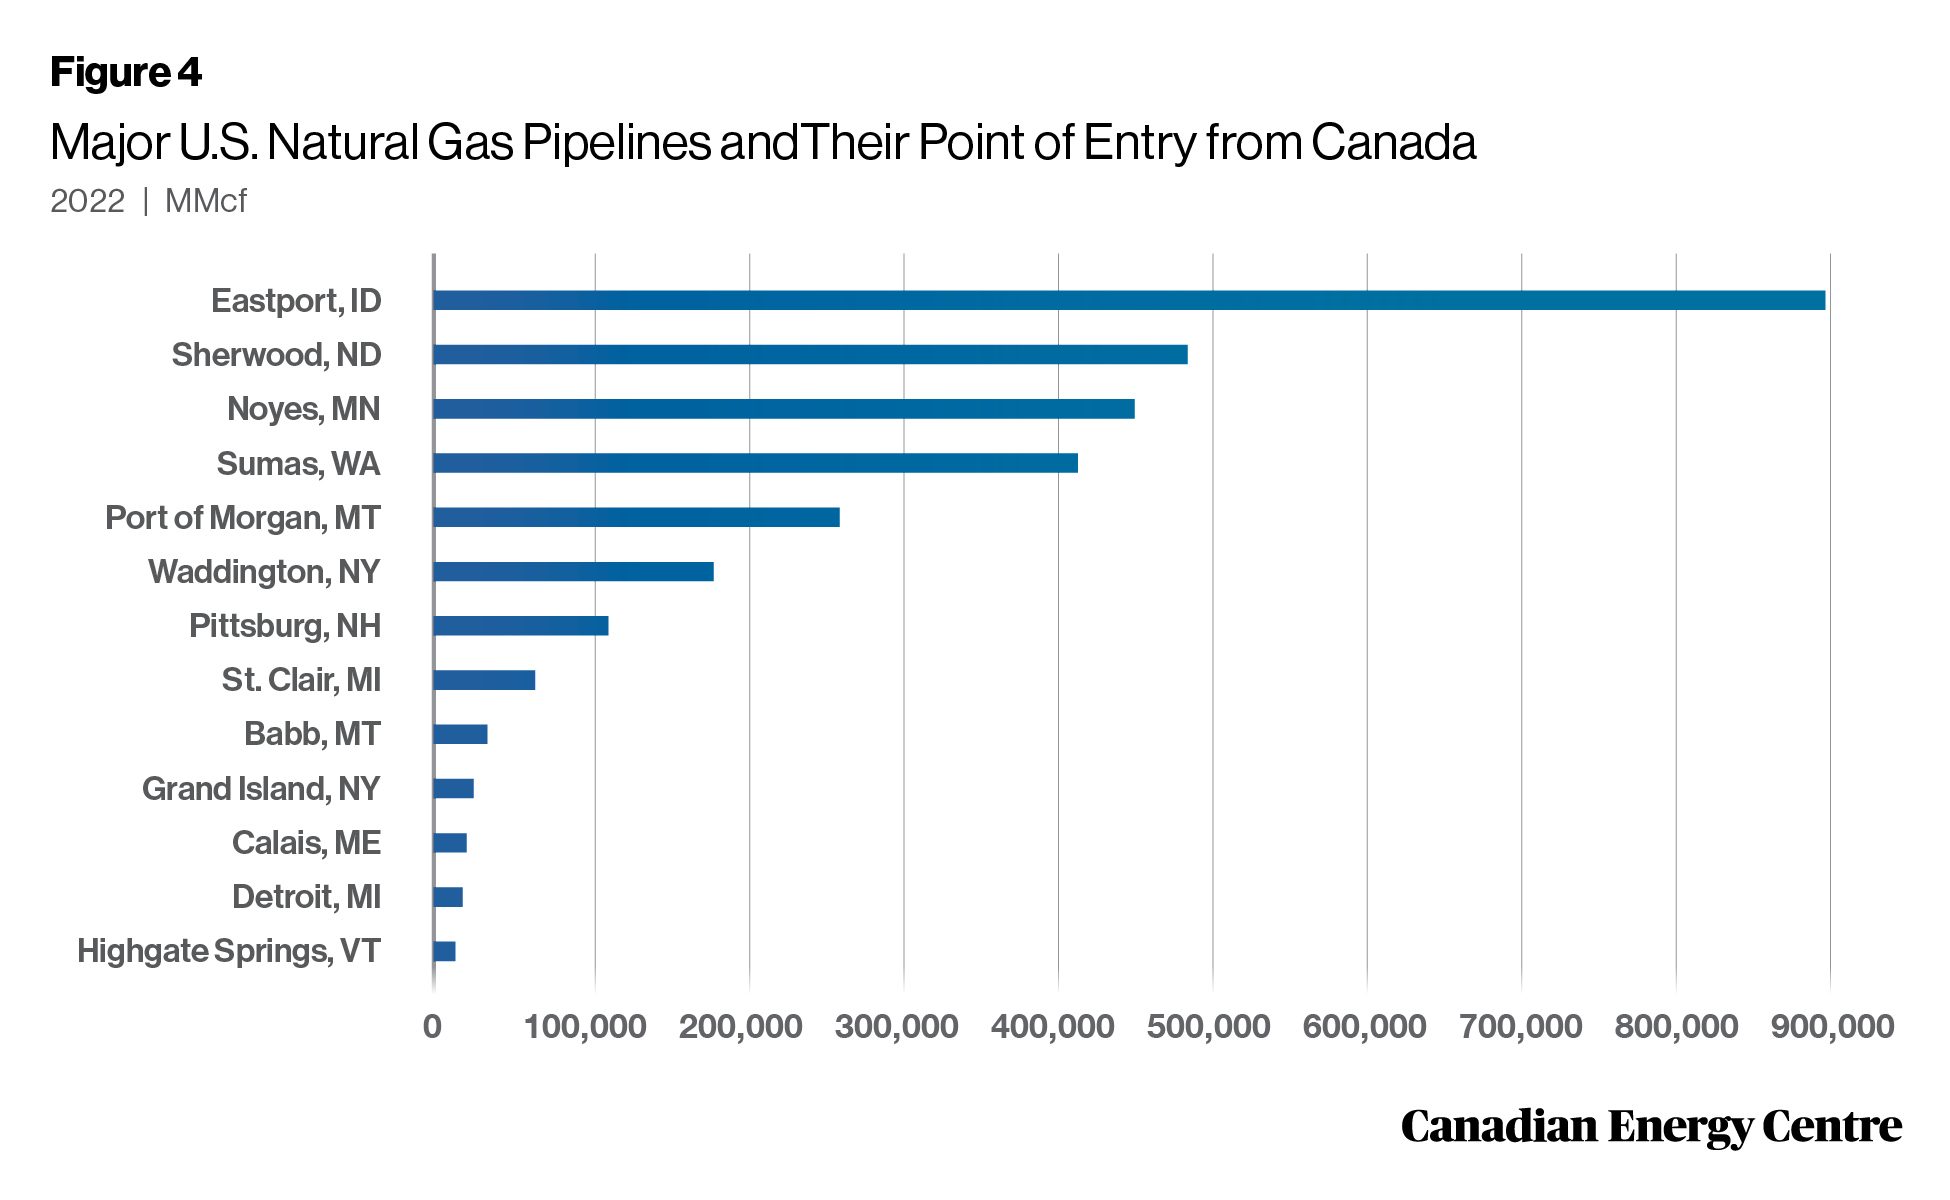
Many U.S. states rely on Canadian natural gas. In 2022, East Port Idaho was the largest Canadian natural gas importing pipeline by point of entry in the U.S., importing 897,492 million cubic feet (MMcf). Other pipelines include those in Sherwood, North Dakota (486,065 MMcf), Noyes, Minnesota (451,818 MMcf), Sumas, Washington State (415,186 MMcf), and Port of Morgan, Montana (261,471 MMcf).
Source: U.S. EIA (Undated a)
Economic Impacts in the U.S. from Canadian Natural Gas Exports
The study uses a two-step approach to determine the impact of Canadian natural gas exports on U.S. state economies. First, the study analyzes Canada’s share of the U.S. downstream natural gas flow based on Canada’s historical natural gas exports to the U.S. Second, it applies these shares to U.S. downstream natural gas distribution activity measured in terms of value-added and employment to determine the Canadian contribution to the U.S. downstream natural gas sector.
Canadian natural gas has provided a steady source of supply to many U.S. states and is exported to regions in the U.S. West,
U.S. Midwest, and the U.S. East.²
U.S. states receiving Canadian gas can be identified from gas volume data supplied by the U.S. Energy Information Administration (EIA). The EIA data shows natural gas imports at U.S. entry points. Using a simple analytical approach, the author determined the Canadian share of total natural gas flows to various states across the U.S. as a percentage of natural gas imported to the states in the U.S. West, U.S. Midwest, and the U.S. East regions.
2. The U.S. West region includes Washington and Idaho, the U.S. Midwest region includes Montana, North Dakota, Minnesota, and Michigan, and the U.S. East region includes New York, Vermont, and Maine.

Source: Author’s calculation from U.S. EIA (undated a)
Natural gas can be used either as a final product (for heating or cooling) or as an intermediate product (for electricity generation or petrochemical production). The natural gas distribution sector (NAICS Code 221210)³ is used as the final consumer of imported gas to simplify the analysis of the uses for the natural gas imported from Canada.⁴ The study used the 023 IMPLAN model⁵ (software that combines data and analytics) to examine the impacts on the study area.
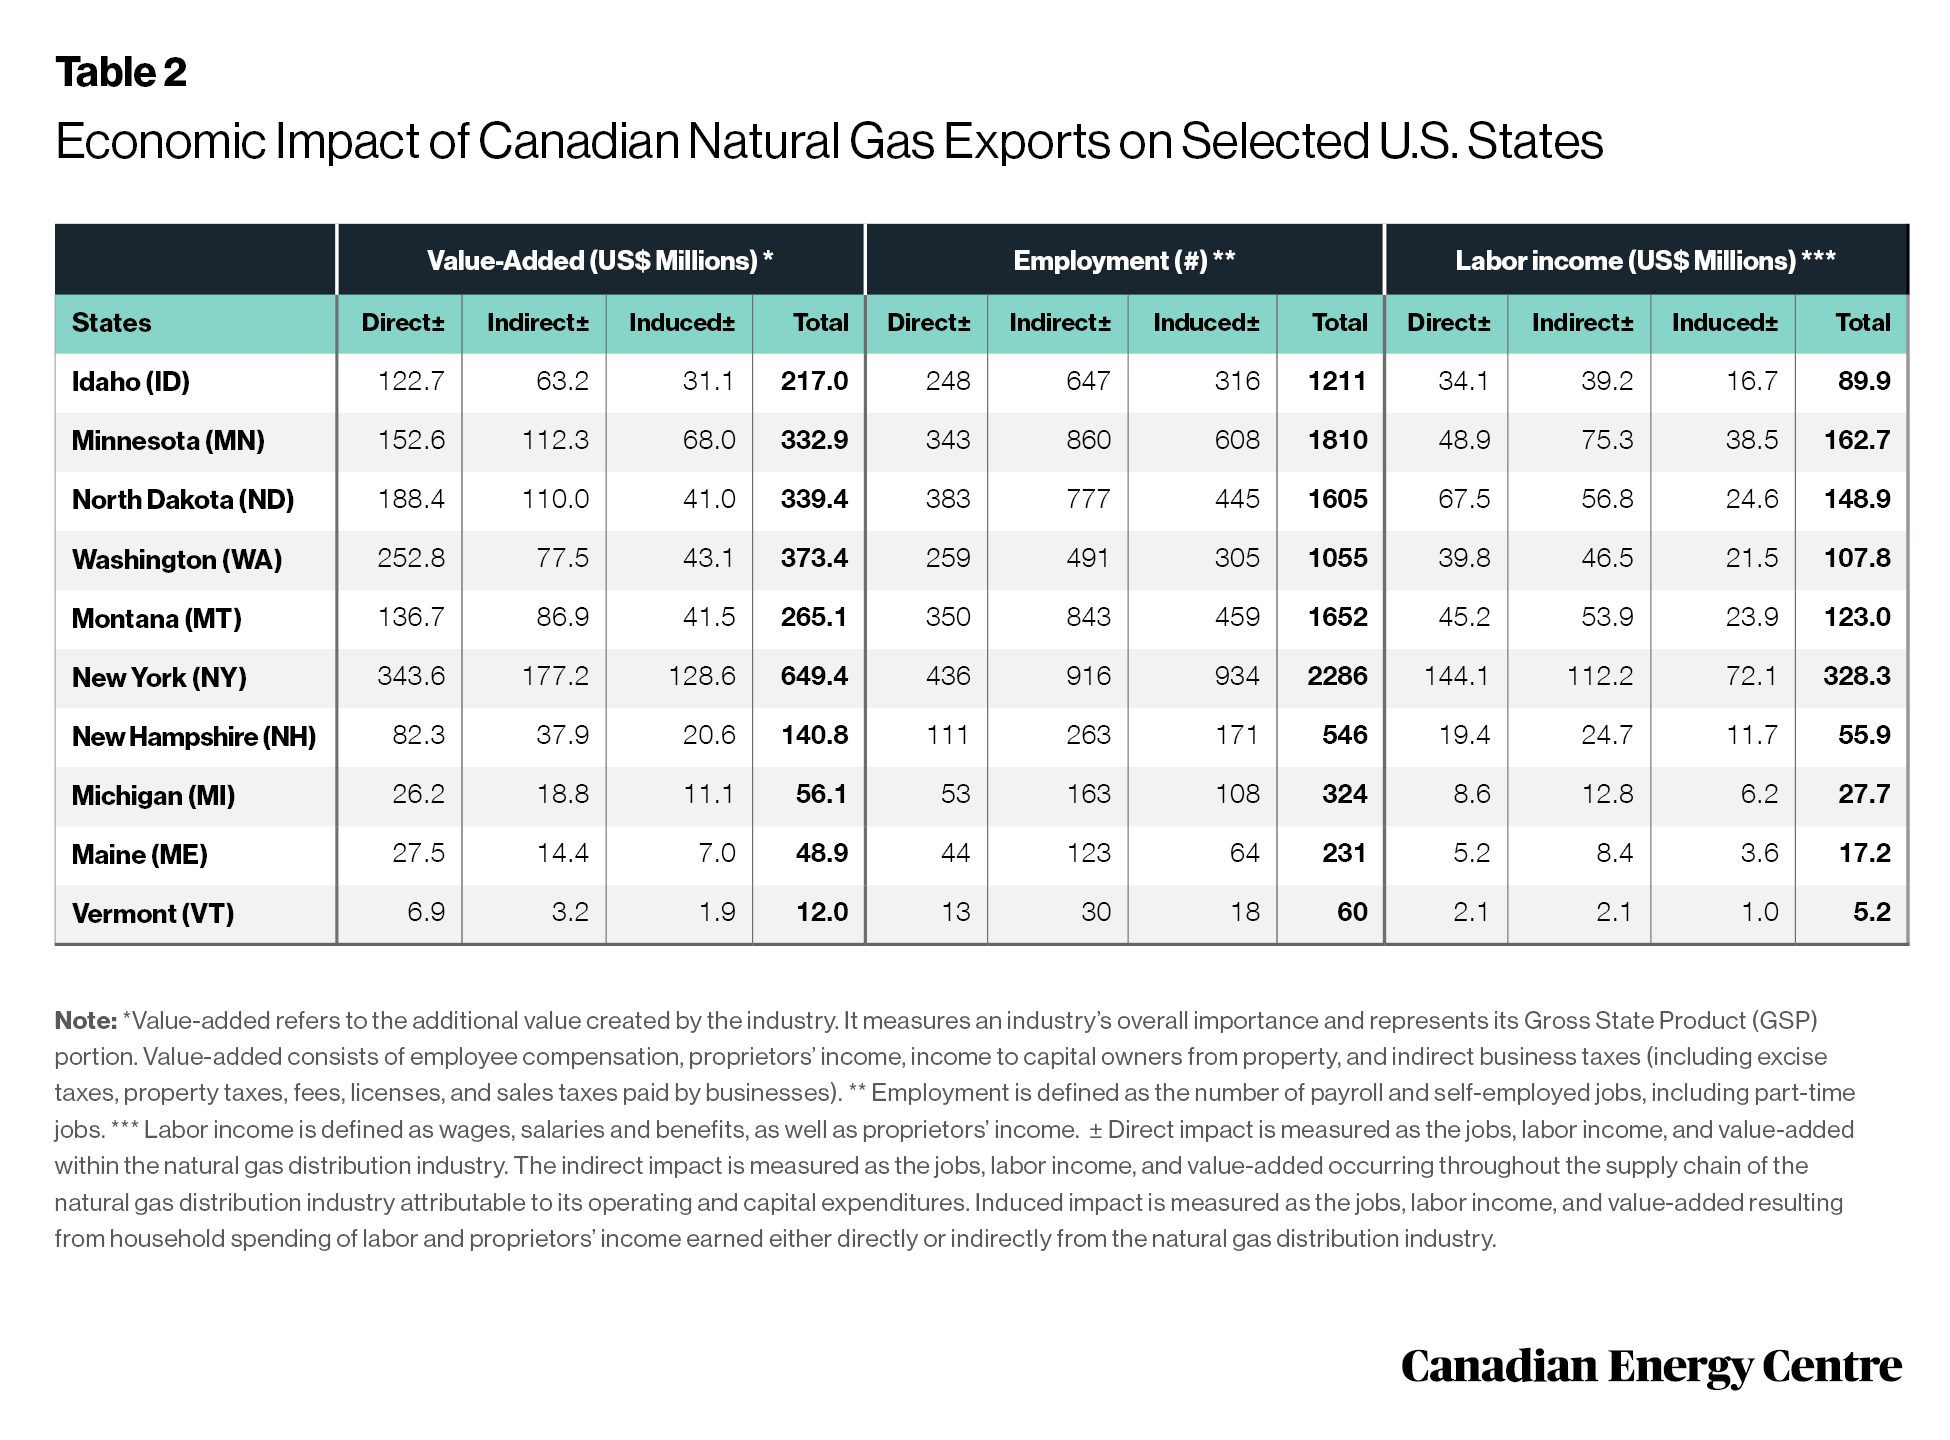
Table 2 summarizes the direct and indirect economic impacts of Canadian natural gas exports across various U.S. states in 2023. Direct impacts are measured as the jobs, labor income, employee compensation, and value-added attributable to Canadian gas exports. The indirect impact is measured as the jobs, labor income, and value-added occurring throughout the supply chain of the natural gas distribution industry that are attributable to its expenditures.
Across 10 states, the economic impact attributable to Canadian gas exports is US$2.40 billion in value-added, US$1 billion in employee compensation, and 10,780 jobs.
The value-added Gross State Product (GSP) impact is most significant in New York (US$649 million), followed by Washington state (US$373 million), North Dakota (US$339 million), and Minnesota (US$332 million).
The most significant impact on employment attributable to Canadian gas exports is in New York (2,286 jobs), followed by Minnesota (1,810 jobs), Montana (1,652 jobs), North Dakota (1,605 jobs), Idaho (1,211 jobs), and Washington (1,055 jobs).
3. NAICS Code 221210: Natural gas distribution. This sector comprises: (a) establishments primarily engaged in operating gas distribution systems (e.g., mains, meters); (b) establishments known as gas marketers that buy gas from the well and sell it to a distribution system; (c) establishments known as gas brokers or agents that arrange the sale of gas over gas distribution systems operated by others; and (d) establishments primarily engaged in transmitting and distributing gas to final consumers.
4. A few caveats should be considered. The analysis doesn’t employ the traditional input/output methodology of employing “expenditure shocks” in evaluating the U.S. economic impact attributable to Canadian natural gas exports to the U.S. states. The paper uses a simplified methodology of determining the Canadian share of the total U.S. downstream natural gas distribution flow based on trade patterns of natural gas across various states. Another caveat is that the downstream gas distribution sector can replace Canadian exported natural gas with interstate imports or imports from other countries, creating a “substitution effect.” Replacing imports from other sources can create the same impact and preserve the jobs in the sector.
5. For more information on the IMPLAN modeling process, visit https://IMPLAN.com.
Source: Author’s calculations using the IMPLAN modelling system. Details may not add up to totals due to rounding
Conclusion
Canadian natural gas exports to the United States have a critical impact on many states. The United States and Canada have strong and valuable energy links. The impact of these links should be emphasized in any discussions about the role of energy in both countries’ economies. Canadian natural gas exports to the U.S. generate spin-off effects in many states across the U.S. West, Midwest, and East.
The direct and indirect economic impacts of Canadian natural gas exports to U.S. states in 2023 included 7,300 jobs, US$1 billion in employee compensation, and US$2.40 billion in value-added.
A robust energy industry is critical to economic prosperity. Natural gas plays a key role in the bilateral trade in energy between Canada and the United States—and in North America’s overall energy security
CEC Research Briefs
Canadian Energy Centre (CEC) Research Briefs are contextual explanations of data as they relate to Canadian energy. They are statistical analyses released periodically to provide context on energy issues for investors, policymakers, and the public. The source of profiled data depends on the specific issue.
About the author
This CEC Research Brief was compiled by Ven Venkatachalam, Director of Research, Canadian Energy Centre.
Acknowledgements
The author and the Canadian Energy Centre would like to thank and acknowledge the assistance of two reviewers in reviewing the data and research for this Research Brief
References
Canada (2023). Trade Data Online. Government of Canada <https://ised-isde.canada.ca/site/trade-data-online/en>; Canada (undated). “Canada-United States Relations,” Government of Canada. <https://www.international.gc.ca/country-pays/us-eu/relations.aspx?lang=eng>; United States, Office of International Trade Commission [OITC] (2023). “Market Overview” (November 3). Canada – Country Commercial Guide. OITC. Government of the United States, Department of Commerce. <https://www.trade.gov/knowledge-product/canada-market-overview>; IMPLAN (2021). Gas Industry: Regions and Results, Custom Tabulation. IMPLAN <https://implan.com/>; U.S. Energy Information Administration [EIA] (2022). “Natural Gas Imports from Canada Continue Providing Winter Reliability to U.S. Markets.” Today in Energy (November 22). EIA. <https://www.eia.gov/todayinenergy/detail.php?id=54759>; U.S. Energy Information Administration [EIA] (Undated a). “International & Interstate Movements of Natural Gas by State.” Natural Gas. EIA <https://www.eia.gov/dnav/ng/ng_move_ist_a2dcu_SID_a.htm>; U.S. Energy Information Administration [EIA] (Undated b). “Natural Gas Explained: Where Our Natural Gas Comes From.” Basics. EIA. <https://www.eia.gov/energyexplained/natural-gas/where-our-natural-gas-comes-from.php>; U.S. Energy Information Administration [EIA] (Undated c). “U.S. Natural Gas Pipeline Imports from Canada.” Natural Gas. EIA. <https://www.eia.gov/dnav/ng/hist/n9102cn2m.htm>.
Creative Commons Copyright
Research and data from the Canadian Energy Centre (CEC) is available for public usage under creative commons copyright terms with attribution to the CEC. Attribution and specific restrictions on usage including non-commercial use only and no changes to material should follow guidelines enunciated by Creative Commons here: Attribution-NonCommercial-NoDerivs CC BY-NC-ND.