
To sign up to receive the latest Canadian Energy Centre research to your inbox email: [email protected]
Download the PDF here
Download the charts here
Introduction
The refining industry¹ in the United States is one of the world’s largest, with capacity to process 18 million barrels of oil per day. Canada plays a crucial role by supplying more than one-fifth of the crude oil refined in the U.S.
The U.S.–Canada cross-border crude oil trade is essential to North American energy security. Canadian crude oil exports and the U.S. refinery industry are highly integrated. In recent years, Canada’s crude oil sector has been making a growing contribution to the operations of U.S. oil refineries.
U.S. refineries are converting Canadian crude oil, including heavy oil,² into products that North Americans use daily, such as transportation fuels (gasoline and diesel), chemicals, and plastics. Although the U.S. has increased its production of oil in recent years, U.S. refineries still rely on Canadian heavy crude oil to meet their feedstock (i.e., the raw materials and intermediate materials processed at refineries to produce finished petroleum products, otherwise known as refinery inputs) specifications.
In this CEC Fact Sheet, we examine several economic indicators that illustrate the importance of Canadian crude oil, particularly heavy crude, to U.S. refineries. This fact sheet also analyzes the refining industry’s direct and indirect economic impacts on the U.S. economy.
1. NAICS Code 324110 (Petroleum Refineries): This industry comprises establishments primarily engaged in refining crude petroleum into refined petroleum.
2. A majority of the crude oil imported by the U.S. from Canada is heavy crude (between 15-25 API gravity). API gravity is a commonly used index for measuring the density of crude oil or refined products. Crude oil typically has an API between 15 and 45 degrees. The higher the API, the lighter the crude; the lower the API, the heavier the crude.
Imports of Canadian crude oil to refineries in the United States
The physical characteristics of crude oil determine how it is processed in refineries. Generally, heavy crude oil offers higher yields of low-value products (coke and asphalt) and lower yields of high-value products (gasoline). Heavy crude oil requires more complicated processing than lighter crude if it is to produce high-value products.
Overall, Canadian crude oil imports to U.S. refineries for processing have risen from over 1.3 million barrels per day in 2000 to just under 3.8 million barrels per day in 2022, an increase of 181 per cent (see Figure 1). The per cent of Canadian crude in U.S. refinery feedstock has steadily risen from nearly 9 per cent in 2000 to over 23 per cent by the end of 2022.
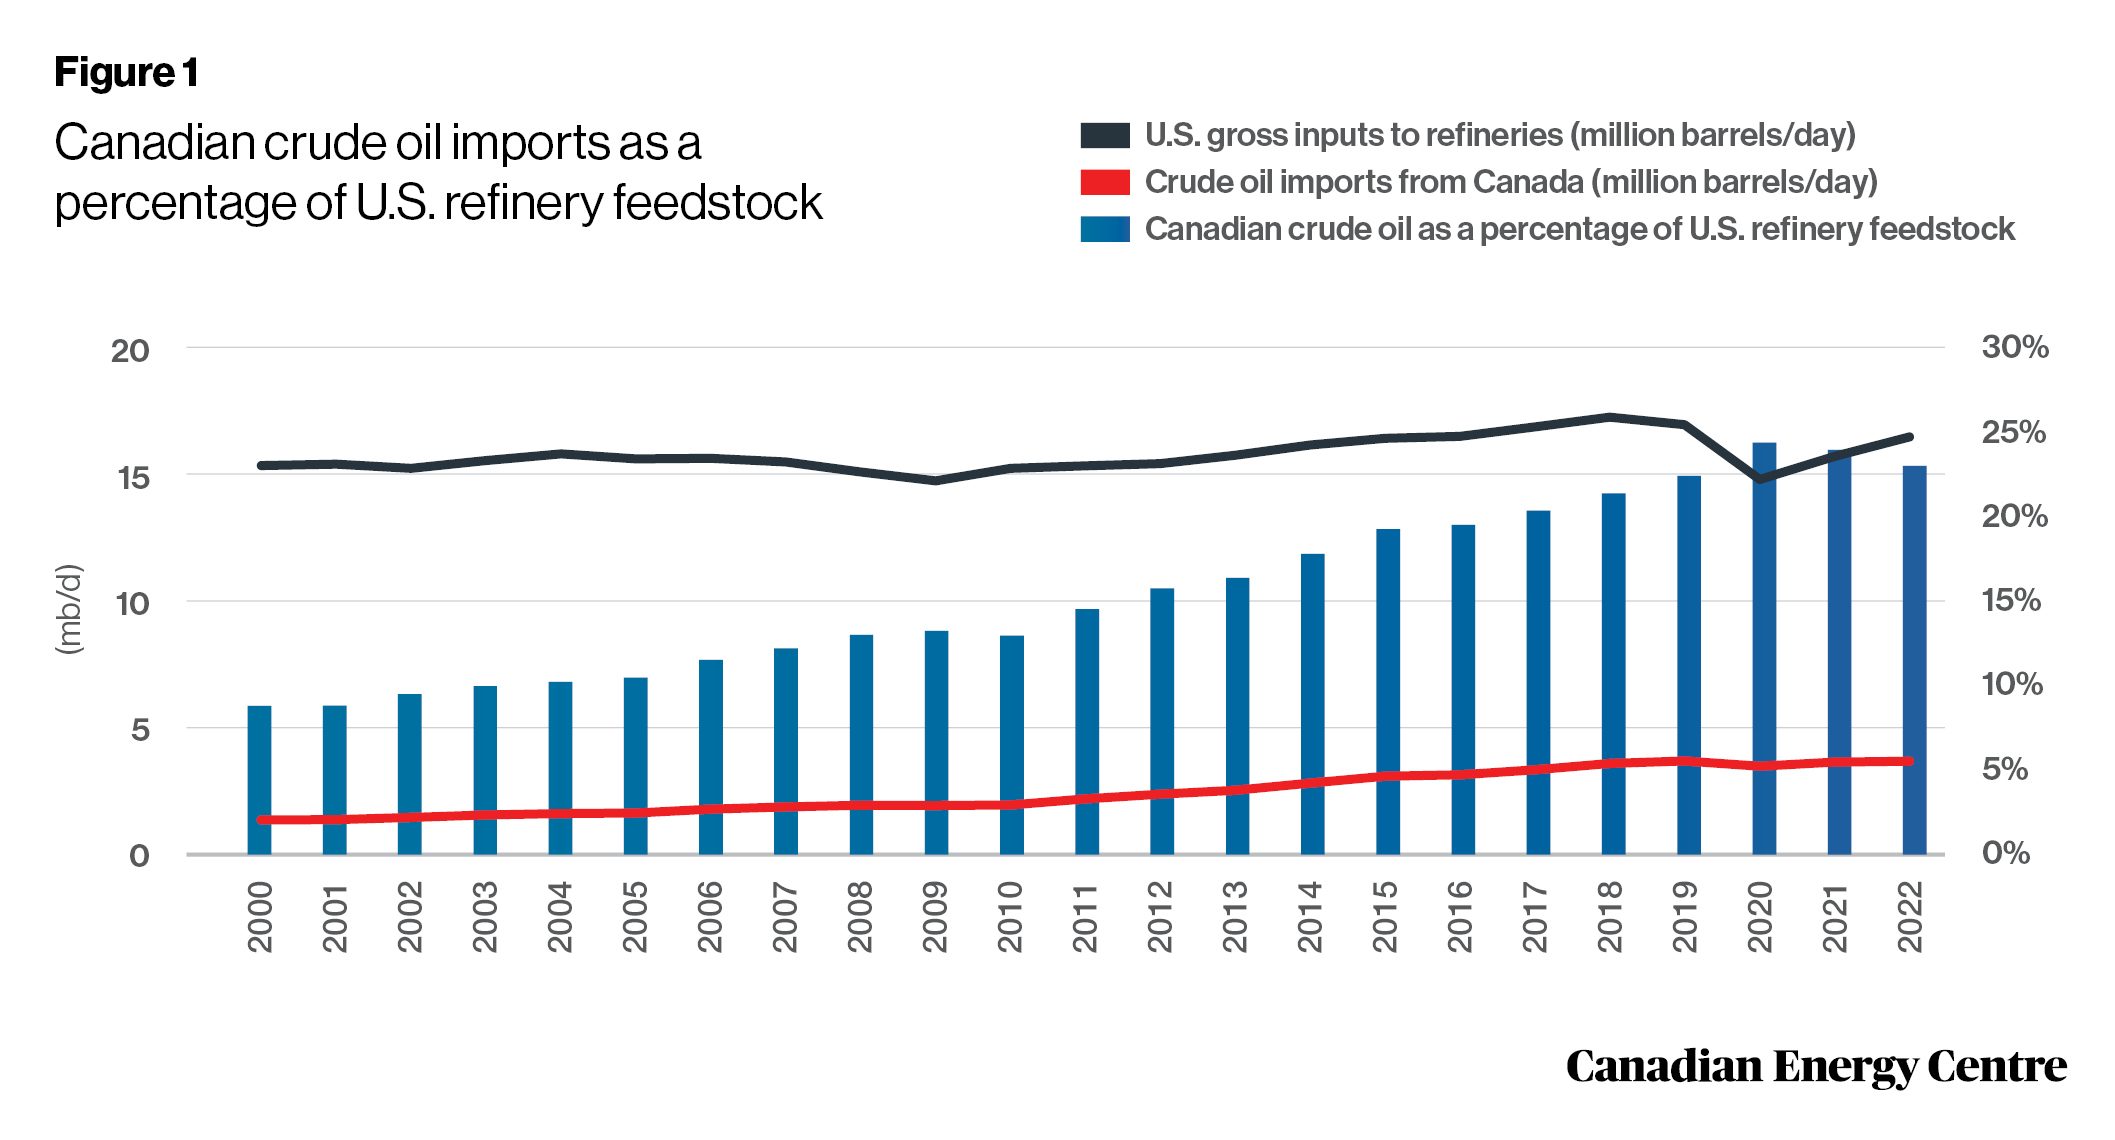
Source: U.S. Energy Information Administration (2024a, 2024b, 2024c)
The U.S. refining industry
Since the first U.S. refinery began operating in 1861, the refining industry has been one of the largest manufacturing sectors in the United States. There are currently 129 petroleum refineries across the five U.S. PADDS³ (125 operating refineries and five refineries that are idle but not permanently shut down) (see Table 1).
3. The United States is divided into five Petroleum Administration for Defense Districts (PADDs) for the allocation of fuels derived from petroleum products, including gasoline and diesel fuel. The geographic breakdown of PADDs enables U.S. policymakers to better analyze petroleum supplies in the country
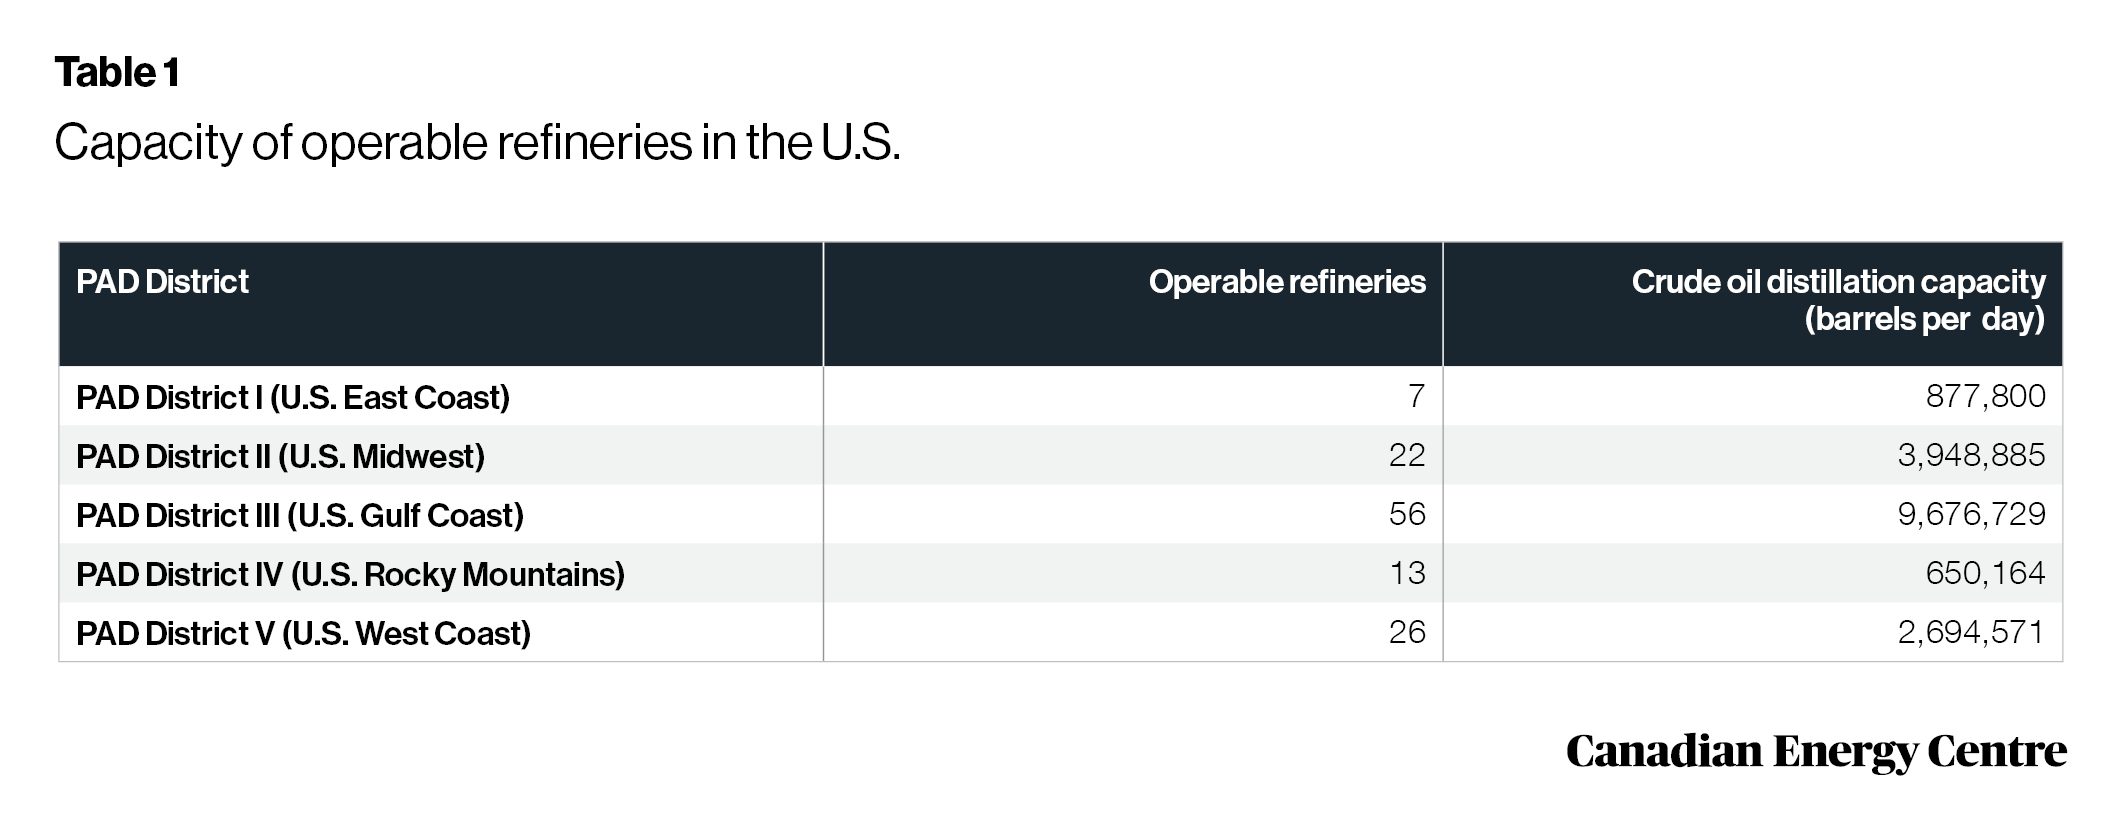
Source: U.S. Energy Information Administration (2023)
Total refining capacity in the United States has risen from 16.2 million barrels of crude processed in 2000 to nearly 17.8 million barrels per day in 2022, an increase of over 8 per cent (see Figure 2). The refining utilization⁴ has also recovered, growing from 79 per cent during COVID-19 to a high of 91 per cent in 2022.
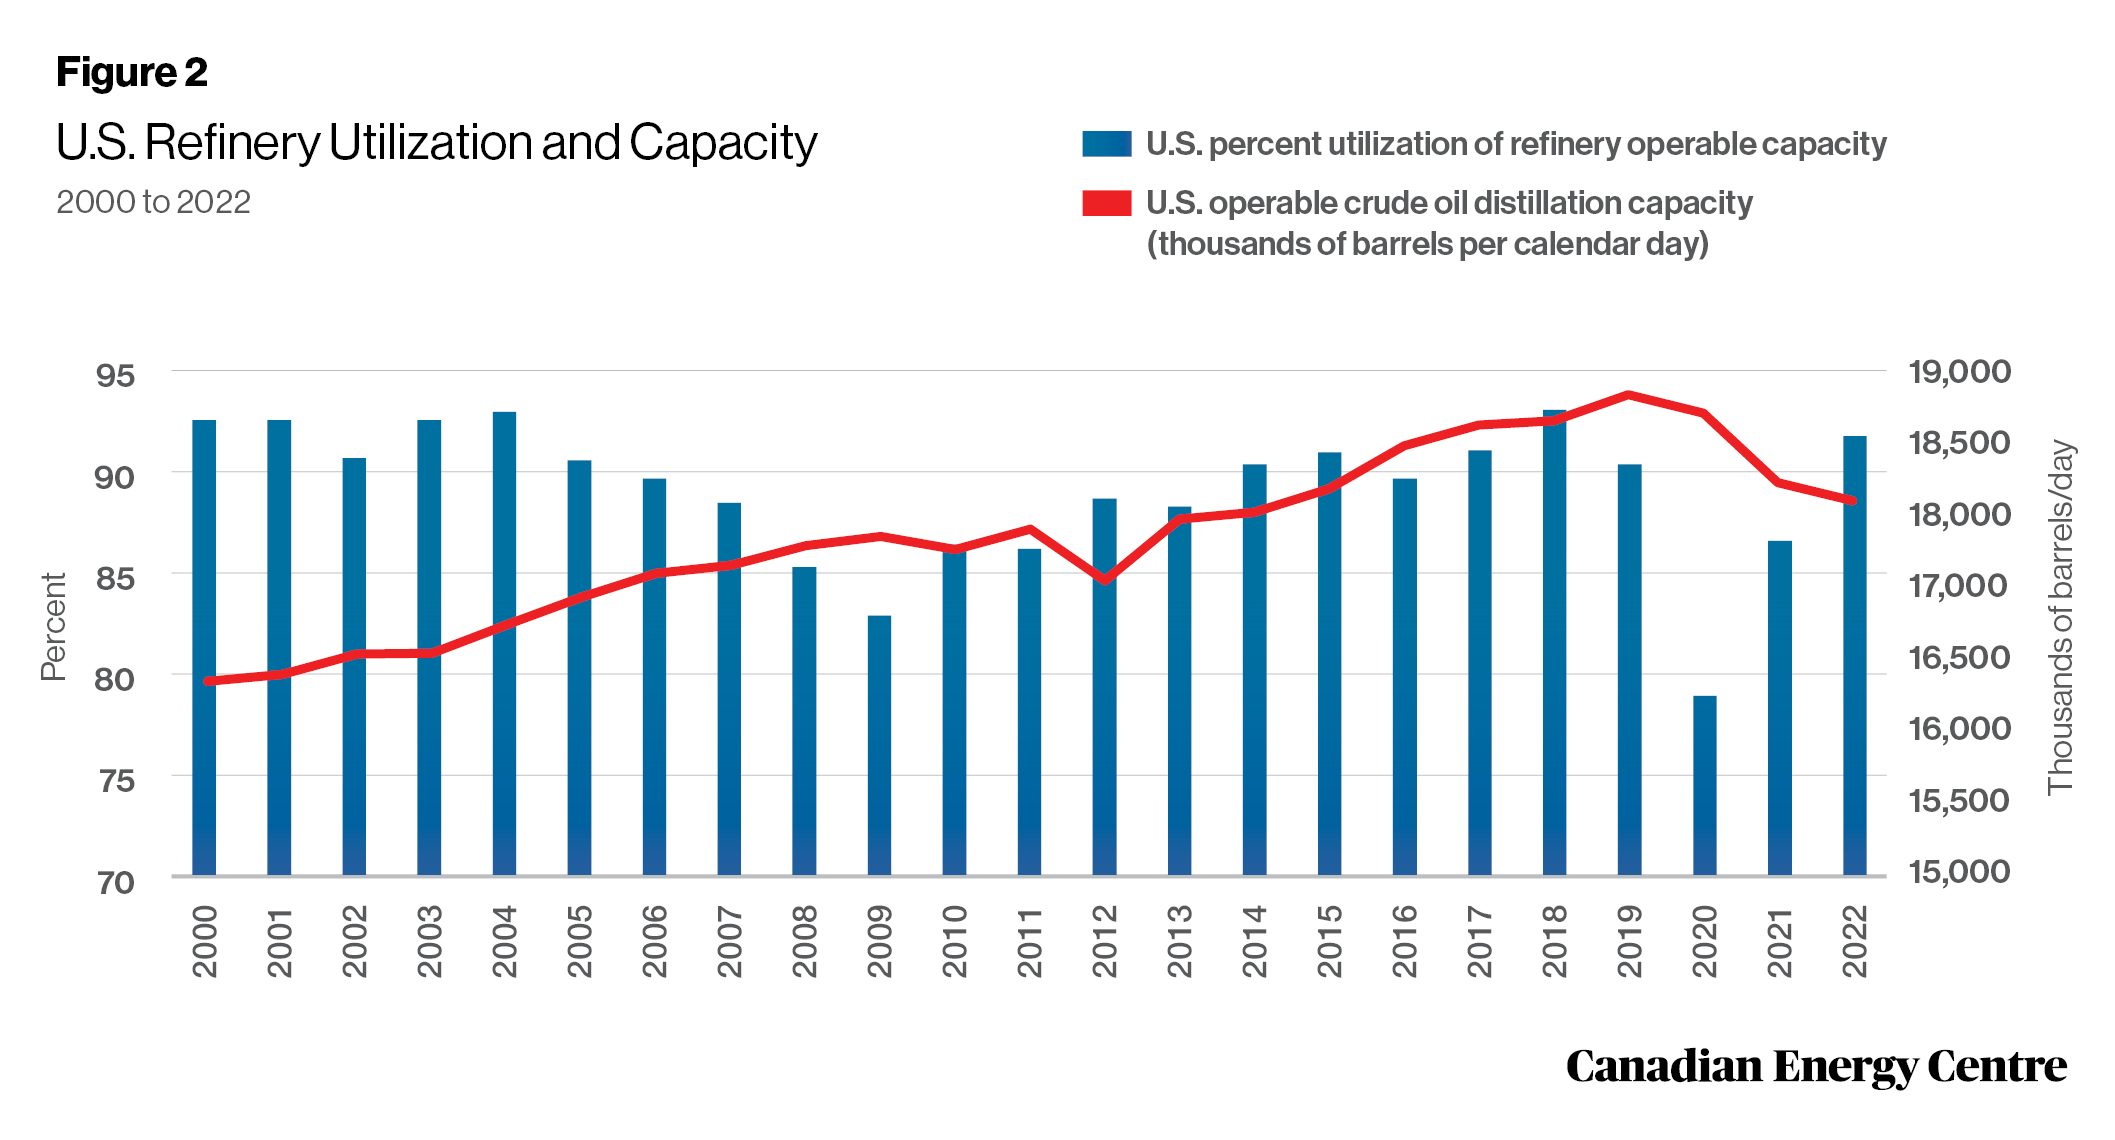
Source: U.S. Energy Information Administration (2024b)
The impact of the U.S. refining industry on the American economy
The estimated direct and indirect economic impacts of the U.S. refining industry in 2024 include 1.6 million direct and indirect jobs, $206 billion in labour income, $577 billion in direct and indirect value-added, and $1.6 trillion in what is known as “outputs,” i.e., the value of goods and services produced by the industry (see Table 2).⁵
4. Capacity measures how much crude oil refineries are able to process. Utilization measures how much is actually being processed (as a percentage of maximum capacity).
5. These projected amounts are in nominal U.S. dollars
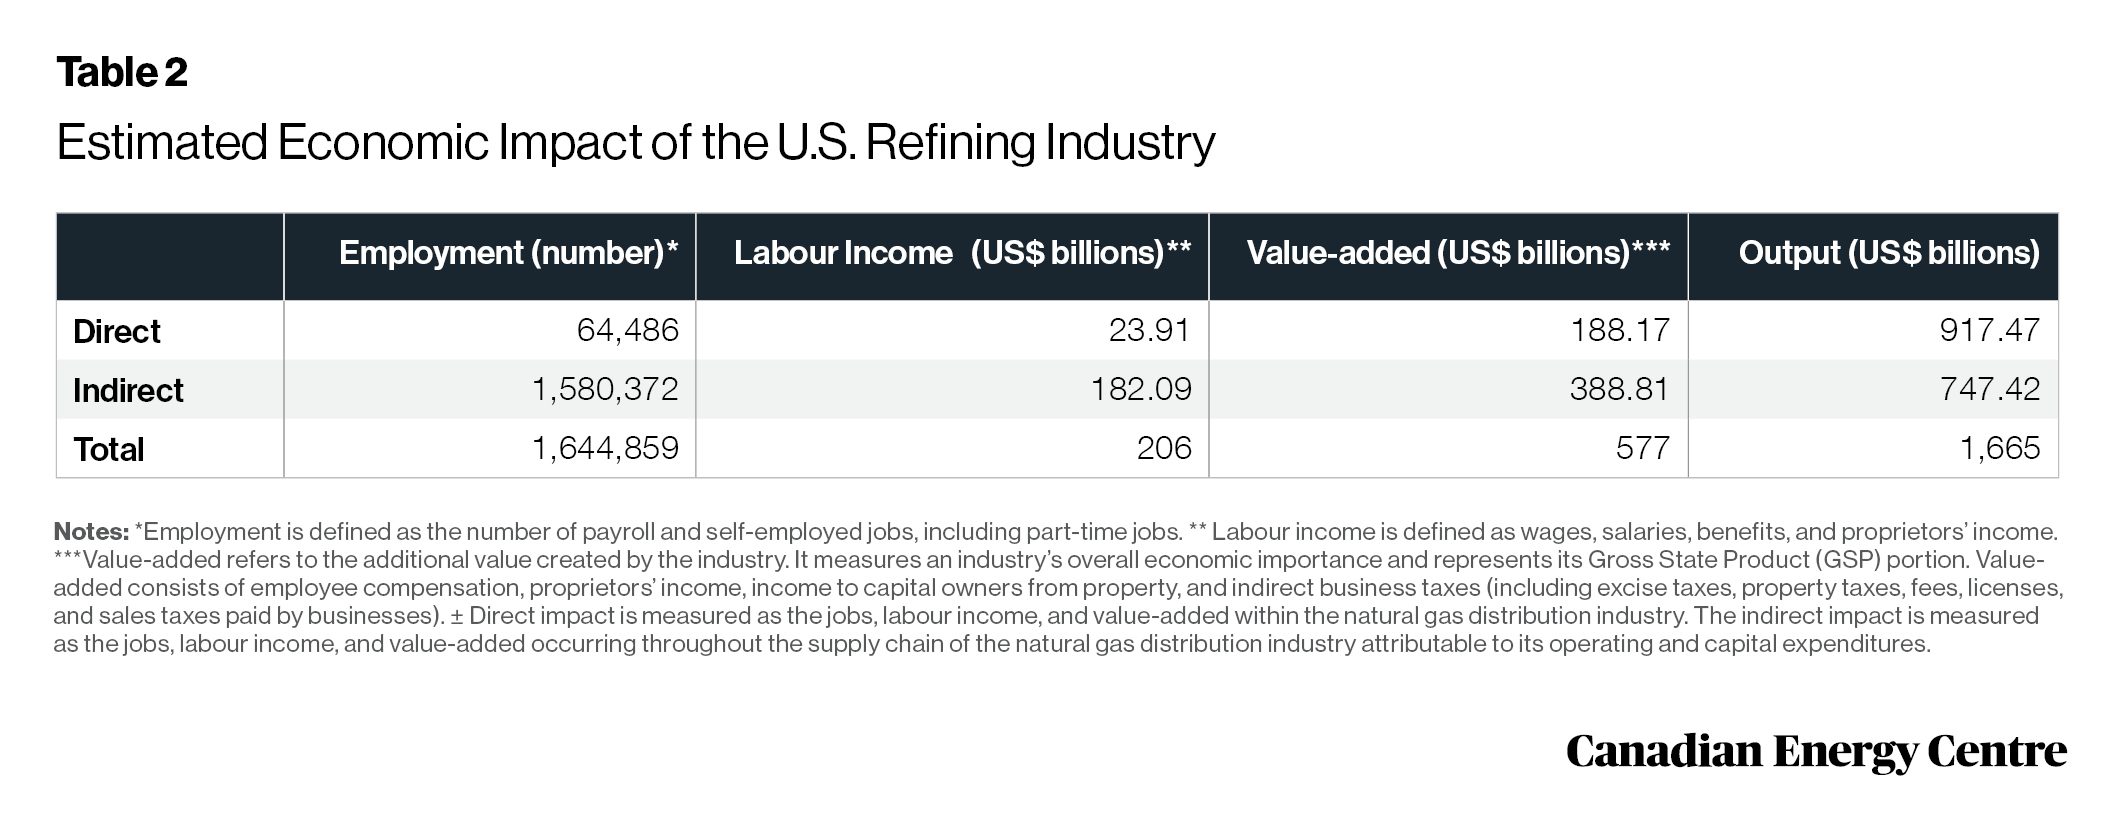
Source: Author’s calculations using the IMPLAN modelling system. Details may not add up to totals due to rounding
Projected spending by the U.S. refining industry, 2024-2030
Figure 3 illustrates the industry’s projected annual spending between 2024 and 2030. Industry spending is expected to be US$58 billion in 2024, rising to US$62 billion by 2030. This includes operating expenditures (OPEX) and capital expenditures (CAPEX). Cumulatively, between 2024 and 2030, the industry is projected to spend over US$428 billion.⁶
6. These projected amounts are in nominal U.S. dollars and are calculated using the Rystad Energy UCube.

Source: Derived from Rystad Energy (2024), Service Market Solution
Conclusion
American refineries are critical to the country’s strategic interest. U.S. refineries are projected to spend more than $428 billion in the next seven years on operating and capital expenditures. The industries support millions of jobs. Canadian crude is an important part of the equation. It supplies more than 23 per cent of U.S. refinery feedstock.
Not only are Canadian crude oil supplies critical for the U.S. refining industry, but they are key to North American energy security. Limiting access to Canadian crude oil for U.S. refineries would require increased U.S. imports from less-free countries, which in turn would risk North American energy security.
References
Rystad Energy (2024), Service Market Solution <http://tinyurl.com/28fmv6a6>; U.S. Energy Information Administration (Undated), Oil and Petroleum Products Explained: Refining Crude Oil <http://tinyurl.com/3b2uwrxh>; U.S. Energy Information Administration (2023), Refinery Capacity Report <http://tinyurl.com/2s4ybz9z>; U.S. Energy Information Administration (2024a), Petroleum and Other Liquids: PADD District Imports by Country of Origin <http://tinyurl.com/58mzvtts>; U.S. Energy Information Administration (2024b), Petroleum and Other Liquids: Refinery Utilization and Capacity <http://tinyurl.com/3wx957k4>; U.S. Energy Information Administration (2024c), Petroleum and Other Liquids: U.S. Imports by Country of Origin <http://tinyurl.com/bdcsbwhn>; U.S. Environmental Protection Agency (Undated), Appendix A — Overview of Petroleum Refining, Proposed Clean Fuels Refinery DEIS <http://tinyurl.com/dveyzc8k>.
Creative Commons Copyright
Research and data from the Canadian Energy Centre (CEC) is available for public usage under Creative Commons copyright terms with attribution to the CEC. Attribution and specific restrictions on usage including non-commercial use only and no changes to material should follow guidelines enunciated by Creative Commons here: Attribution-NonCommercial-NoDerivs CC BY-NC-ND.